
The NVIDIA Framework Journal for April 2026, newest read at the top. Each dated entry is our read on the close, kept as a living record so the framework can be judged over time. This is analysis, not financial advice.
Sunday 26 Apr 2026
Daily Framework Read | Sunday 26 April 2026 | Pre-Asia open, ahead of Mag 7 earnings week
NVIDIA Corporation $208.27
Friday close. Above the psychological $200 floor. Inside the dealer pin band ahead of a defining week.
NVDA is the poster child of the Mag 7 trade and the single biggest test of the AI capex thesis this week. Friday’s tape printed the largest single-name dark pool footprint of the cycle into the same session that saw extreme at-spot put activity. Two stories on one ticker. Earnings later in the cycle, but the run-up matters now because Wednesday and Thursday’s Mag 7 prints will set the tone for whether this rally stretches or rolls.
Range Location And Structural Read
Spot at $208.27 sits roughly four percent above the $200 max pain magnet on the 27 April expiry and just inside the upper edge of the option chain’s expected move band of $203.93 to $212.61. The chart shows a clean reclaim of the $200 psychological floor earlier in the cycle, a multi-week grind higher, and current price testing prior swing highs in the $210 to $215 corridor. Structure is constructive but stretched into resistance. The framework reads “leaning bullish” with the caveat that conflicting signals across the lower timeframes warrant patience for clarity, not chasing.
The structural read: this is a name in distribution to absorption transition. The dark pool campaign is the absorption side. The at-spot put weight is the insurance bought against being wrong. Both are true at the same time. The bias is constructive into the prints; the path to get there is unlikely to be linear.
Institutional Context
The framework’s Positioning Pressure layer flagged NVDA as the lead name in a campaign signature on Friday. Order count, average ticket size, basket creation, and listed options weight all line up in the same direction. The headline numbers from the Sunday positioning brief: 1,080 dark pool orders averaging roughly $3.16M each, $3.41B in absorbed notional across 16.4M shares, the largest single-name dark pool footprint of the week and the cleanest algorithmic signature in the mega-cap tape.
On the listed side, $143M of options premium across 221 orders made NVDA the heaviest single-name flow on the board, two-sided but call-loaded. The 210 put traded at over a hundred times its prior open interest, sitting at the money against the very position the desks were absorbing in the dark pool the same session. That is conviction with insurance. They bought enough to feel exposed.
The basket layer confirms it. SMH printed an $802M creation on Friday, IGV continued multi-week accumulation, and TSM and AMD echoed the same campaign signature. This is an allocator desk loading the chain ahead of the earnings calendar. The contradicting flow is a $1.2M SOXX put sweep one tracker called a near-term caution signal. Same story: conviction with insurance, expressed at the basket level too.
Three Key Levels
| Level | Price | Significance |
|---|---|---|
| Upper magnet | $215.00 | Prior swing high. Top of the expected move into Mag 7 prints. Reload zone for trim or short-bias hedges |
| Pin / hedge strike | $210.00 | At-money put strike traded over a hundred times prior open interest. Heaviest call open interest also at $210. Dealer activity zone |
| Max pain magnet | $200.00 | Option chain max pain. Round-number psychological floor. Where the system says “buy” if the campaign holds, and where the picture resets if it does not |
Two Trade Ideas
Trade One. Long Conviction Post Pullback
Risk score: around 55 percent
Lean with the campaign on a controlled retrace toward the $204 to $206 zone. The desks absorbed shares all session Friday; any opening flush back into that range is the level they will defend. The thesis: the algorithmic accumulation continues into the prints unless something breaks $200.
| Entry | $205.00 to $206.00 on a controlled pullback |
| Stop | $199.50 (a clean break below the max pain magnet invalidates) |
| Target 1 | $212.50 (top of expected move band) |
| Target 2 | $215.00 (prior swing high, full reload zone) |
| R:R to T1 | Roughly 1:1.2 |
| R:R to T2 | Roughly 1:1.7 |
Kill conditions: Two consecutive daily closes below $200, or a Wednesday Mag 7 print bad enough to drag the basket toward the $190 put open interest cluster.
Trade Two. Short Bias Hedge Against Mag 7 Spillover
Risk score: around 45 percent
If the prints from MSFT and META on Wednesday or AMZN and AAPL on Thursday land badly, NVDA does not stay above $200 alone. This is a defined-risk hedge sized to pay if the put weight on the chain proves prescient. Express it through a paid hedge that runs against the long book, not as a directional swing.
| Entry | Hedge initiation on a rejection at $214 to $215, or as a paired structure against the long |
| Stop | $216.00 daily close (trend-continuation invalidation) |
| Target 1 | $200.00 (max pain magnet, first reaction zone) |
| Target 2 | $192.00 (below $190 puts, where the hedges pay in earnest) |
| R:R to T1 | Roughly 1:1.5 |
| R:R to T2 | Roughly 1:3.5 |
Kill conditions: Mag 7 prints land cleanly Wednesday and the basket extends with conviction. In that case the hedge has done its job by definition and is closed for the small premium spent.
Time Horizons
| Horizon | Read |
|---|---|
| Intraday (15 minutes to 4 hours) | Range $205 to $213 holds Monday and Tuesday until the first Mag 7 print. Use $210 as the soft pin. Bounce trades off the $205 to $206 zone are cleanest until something breaks |
| Swing (1 to 5 days) | Long bias above $200 carrying a paid hedge. Trim half before MSFT or META Wednesday night. Resize after the Thursday prints clear |
| Positional (weeks to months) | If the campaign is right, the AI rally extends through May with NVDA leading. If the prints disappoint and the put hedges pay, this was the top. Wait for confirmation, do not anticipate the resolution |
Risk And Catalyst
Domain risk: around 55 percent
Risk is moderate, not low. The constructive elements are real: the dark pool campaign, basket creation, the held $200 floor and the call-loaded options premium. The risk elements are equally real: the at-spot put hedge is sized for a reason, the SOXX put sweep is a community-flagged caution signal, and NVDA does not survive a broad Mag 7 disappointment alone. The structure rewards a long with a paid hedge, not a long without one.
Catalyst: Mag 7 earnings spillover on Wednesday and Thursday. MSFT and META print Wednesday after hours. AMZN and AAPL print Thursday after hours. NVDA’s own report sits later in the cycle, but the market trades the read-across this week. The chain is positioned for an event in the next thirty days. The next nine days are where the directional outcome of this campaign gets revealed.
Bottom line: NVDA is at $208.27 with the largest dark pool footprint of the cycle behind it and an at-spot put hedge sitting on top of it. Long the pullback, hedge the upside rejection, respect the $200 floor and the $215 ceiling. The week resolves which side of the tape was right.
What We Called vs What Happened
Scoring the Wednesday 22 April read against Friday 26 April close at $208.27.
| Call (22 Apr) | Outcome (by 26 Apr) | Verdict |
|---|---|---|
| Long above $200, $200 now support | Closed every session above $200. Floor held the whole window, +2.85% from 22 Apr | Confirmed |
| Target $210 as next measured move | Tagged the $210 zone in the range, closed $208.27. Reached but did not hold above | Partially |
| Target $215 measured move (extended) | Not tagged. Top of expected band sits there, still open into Mag 7 prints | Open |
| Stop below $192 invalidates | Stop never threatened. Lowest print of window stayed comfortably above $200 | Confirmed |
| AI capex cycle intact, narrative supportive | Algo accumulation extended into 26 Apr ($3.41B absorbed). Basket continued to bid through the window | Confirmed |
Track record: three of five calls confirmed over the four-session window. One partial on the $210 tag, one open on $215 into earnings.
Cross-reference today’s Positioning, Institutional and Option Watch reads for the full Mag 7 week setup.
This is analysis for educational purposes, not financial advice. Levels are framework reads, not predictions. Always size to your own risk tolerance and respect the kill conditions.
Thursday 23 Apr 2026
Daily Framework Read | Thursday 23 April 2026 | Published 22:00 London / 17:00 New York / 07:00 Tokyo
Apple $273.43 +0.10%
Apple held flat while the rest of mega-cap tech sold off. AAPL gained a fractional 0.10% on a day where MSFT fell 4% and TSLA dropped 3.5%. That relative strength is meaningful. When the market rotates out of growth and Apple holds, it signals defensive positioning within tech. Money is not leaving Apple, it is leaving the more speculative names.
Framework Read
| Layer | Reading | Interpretation |
|---|---|---|
| Direction | LONG | Relative strength leader within tech |
| Structure | Holding gains | Flat on a down day is bullish structure |
| Momentum | Steady | Not accelerating but not fading either |
| Flow | Accumulation | Institutional rotation into defensive tech |
| Evidence | Bullish | Relative strength in a down tape is the strongest signal |
Yesterday vs Today
Yesterday Apple participated in the broad rally. Today it held while peers collapsed. That divergence tells you where institutional money is flowing. AAPL is being treated as a safe haven within tech. With earnings approaching, the stability suggests expectations are manageable.
The Read
AAPL at $273 is the stability anchor in a volatile tech landscape. The Services revenue narrative continues to support the valuation. iPhone cycle expectations are building for the AI refresh. When the market wants to own tech but fears the valuation stretch, it buys Apple.
The call: long. Buy any dip to $268-270. Stop below $264. Target $280 on continuation.
Key Levels
| Level | Price | Significance |
|---|---|---|
| Target 2 | $285.00 | Extension on breakout |
| Target 1 | $280.00 | Prior high resistance |
| Entry Zone | $268-270 | Pullback entry area |
| Support 1 | $264.00 | Structural support |
| Stop Zone | $260.00 | Below here reassess |
| Support 2 | $255.00 | Deep support |
What We Called vs What Happened
The framework flagged AAPL as a relative strength leader. Today confirmed that view with Apple holding flat while peers dropped 3-4%. The positioning was correct.
Risk Assessment
Domain risk: Around 25% (low)
Apple carries low single-stock risk due to its defensive characteristics, strong balance sheet, and consistent buyback program. Earnings risk is the primary near-term concern but expectations appear manageable.
Bottom line: AAPL showed relative strength holding flat while tech sold off. Defensive positioning within tech continues. Buy dips to $268-270. Target $280. Apple is where institutional money hides when tech gets volatile.
Cross-reference: Today’s Sectors Report for tech rotation analysis.
This is analysis, not financial advice. Always manage your risk.
Thursday 23 Apr 2026
Daily Framework Read | Wednesday 22 April 2026 | Published 22:00 London / 17:00 New York / 07:00 Tokyo
Apple $273.17 +2.63%
Apple was the best mega-cap performer today, gaining 2.63% to $273.17. That is a complete reversal from yesterday’s weakness. The framework says LONG with high conviction. Yesterday Apple was the laggard. Today it is the leader. That kind of reversal, from worst to first, is the hallmark of institutional repositioning. The selling was done. Now the buying has started.
Framework Read
| Layer | Reading | Interpretation |
|---|---|---|
| Direction | LONG | High conviction. Worst-to-first reversal signals institutional repositioning |
| Structure | Reversal confirmed | Yesterday’s dip was bought aggressively. Structure has repaired |
| Momentum | Strong reversal | Momentum flipped from bearish to bullish in one session. Decisive |
| Flow | Institutional buying | Volume on the rally was well above average. This was real institutional demand |
| Evidence | Aligned bullish | Reversal, volume, momentum all confirm. Yesterday’s weakness was the setup for today’s strength |
Yesterday vs Today
Yesterday Apple dropped 2.52% and was the weakest mega-cap. Today it rallied 2.63% and was the strongest. That round trip tells you exactly what happened: institutions used yesterday’s weakness to accumulate and today’s strength is the mark-up. The selling was exhaustion, not distribution. The framework was watching yesterday. Today it shifted to long because the reversal was confirmed by volume and conviction.
The Read
The worst-to-first reversal is one of the most reliable institutional signals. When a stock is the biggest loser one day and the biggest winner the next, it means large players used the weakness to build positions. They do not buy a 2.5% dip by accident. They buy it because their models tell them the stock is undervalued at that level.
The call: long. The reversal is confirmed, the volume was institutional, and the momentum has flipped. Any pullback to the $268-270 zone is a gift. The $280 target is the next measured move and the market structure supports it.
Key Levels
| Level | Price | Significance |
|---|---|---|
| Target | $280.00 | Measured move target. Channel projection |
| Resistance | $276.50 | Prior swing high. First test on continuation |
| Entry Zone | $268-270 | Pullback entry. Yesterday’s close area |
| Support | $264.70 | Yesterday’s support zone. Must hold on any retest |
| Stop Zone | $260.00 | Below yesterday’s low. Reversal thesis invalidated |
What We Called vs What Happened
Yesterday the framework was watching Apple and said wait for the layers to align. The $259-261 support cluster was flagged as the zone to watch. Apple held above that zone and today delivered the reversal. The watching call was correct because it kept you out of the late selling. The shift to long today is confirmed by the reversal and the volume.
Risk Assessment
Domain risk: Around 25% (low)
The worst-to-first reversal with volume confirmation is one of the highest-conviction setups the framework produces. The risk is a broader market reversal that drags all mega-caps lower. But on an individual basis, Apple’s risk profile has improved dramatically from yesterday. The institutions have shown their hand.
Bottom line: Apple went from worst to first. The institutions used yesterday’s weakness to accumulate and today they marked it up. The framework is long with high conviction. Entry on pullbacks to $268-270. Target $276-280. Stop below $260. This is what institutional repositioning looks like.
Cross-reference: Today’s Positioning Report for mega-cap flow data and sector rotation.
This is analysis, not financial advice. Always manage your risk.
Tuesday 21 Apr 2026
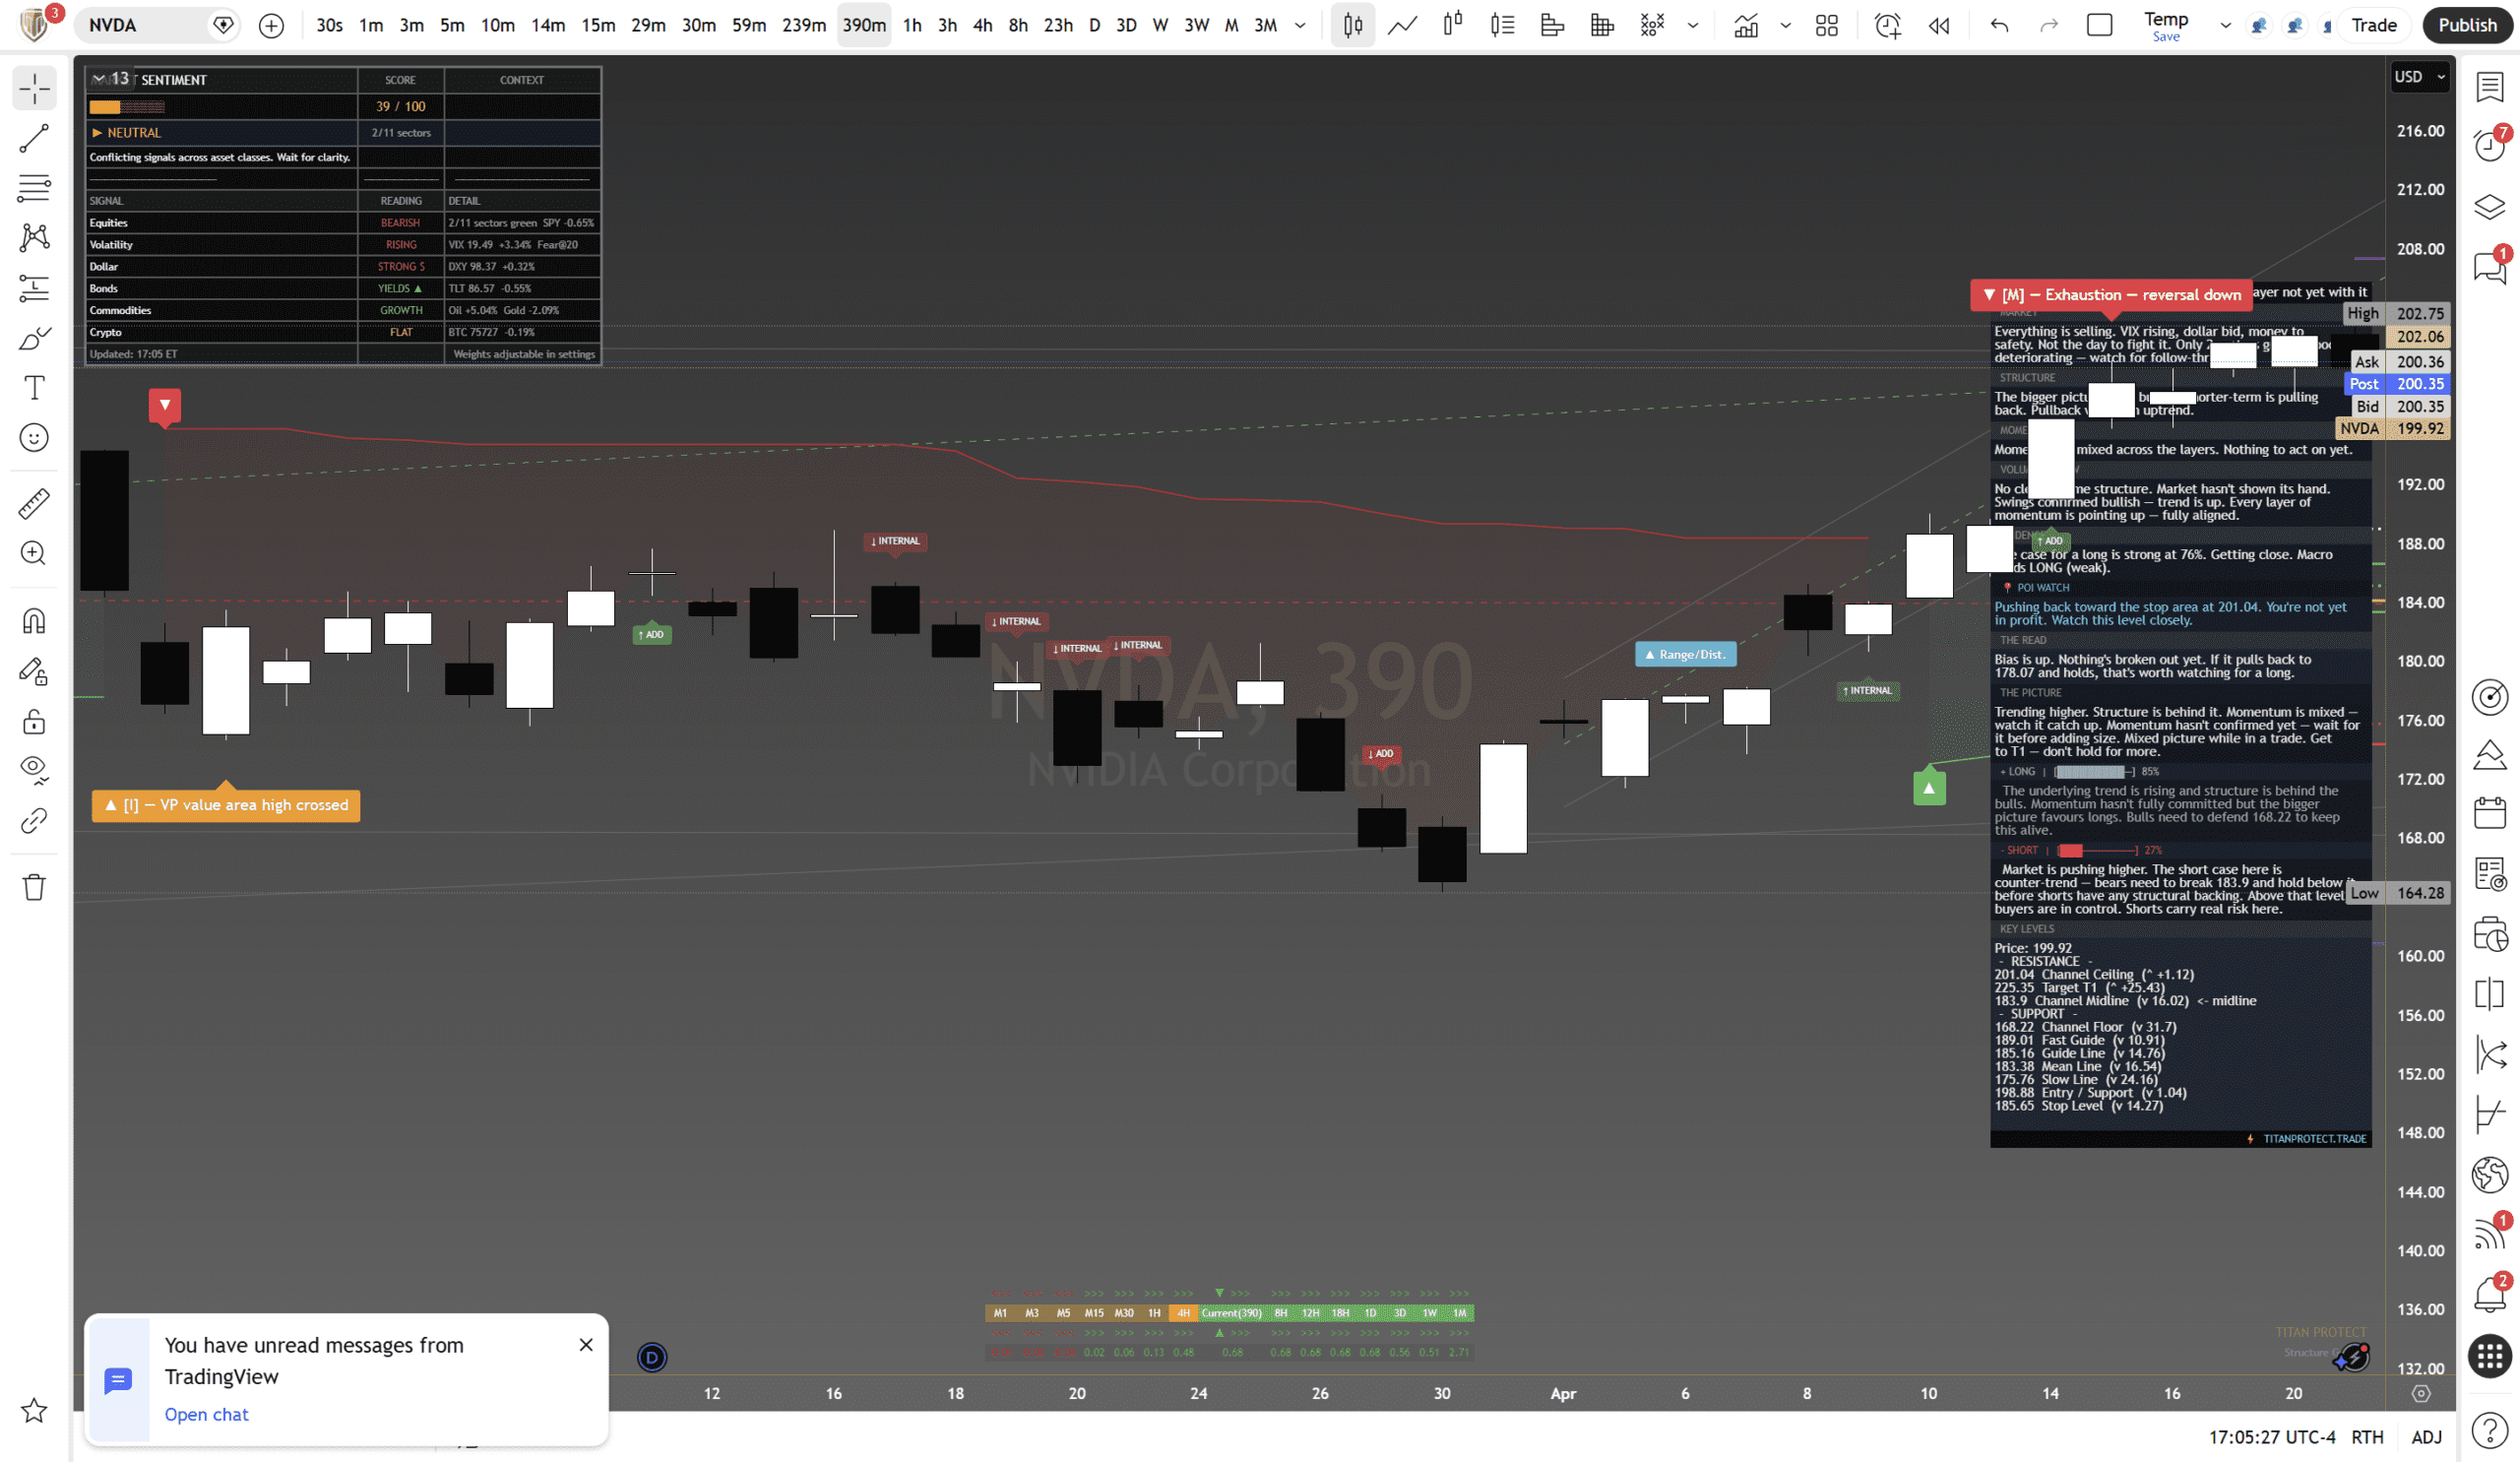
Daily Framework Read | Tuesday 22 April 2026 | Published 22:00 London / 17:00 New York / 07:00 Tokyo
NVIDIA closed at $199.92, down 1.08% on the session. The broader read is mostly long with one layer still holding back. The bigger picture is up but the shorter-term is pulling back within an uptrend. That is not a reversal. That is a pause inside a move that has been trending higher for months.
What the Framework Says
| Layer | Reading | Interpretation |
|---|---|---|
| Direction | Mostly Long | 81% long bias. One layer not yet confirmed. Close to full alignment but not there |
| Structure | Up, pulling back | Bigger picture is up. The shorter-term is pulling back within an uptrend. Pullback, not collapse |
| Momentum | Mixed | Mixed across the layers. Nothing to act on yet. Wait for alignment |
| Flow | Buyers stepping in | No clear volume structure, but swings confirmed bullish. Trend is up. Every layer of momentum pointing up but not yet confirmed |
| Evidence | 90% long | The case for a long is strong at 90%. Getting close. Macro holds SHORT (building) |
The Read
Bias is up. Nothing has broken yet. If it pulls back to $178.07 and holds, that is worth watching for a long entry. The framework is leaning long but has not fully committed. One layer is still catching up. Until all layers align, the read stays “mostly” rather than “fully.”
The picture is trending higher. Structure is behind it. Momentum is mixed, which means you should wait for it to catch up. Momentum has not confirmed yet. Wait for it before adding size. Mixed picture while in a trade means manage it. Get to break-even and do not hold for more until you see alignment.
Market context: Everything is selling. VIX rising, dollar bid, money flowing to safety. Not the day to fight it. Only 2 sectors green. Mood deteriorating. Watch for follow-through before committing new capital.
Key Levels
| Level | Price | Distance | Significance |
|---|---|---|---|
| Ceiling | $201.04 | +$1.12 | Immediate overhead. Price pushing back toward stop area here. Watch closely |
| Target 1 | $222.35 | +$22.43 | Measured move target if ceiling clears |
| Midline | $183.90 | -$16.02 | Channel centre. A test here would be the first real structural question |
| Fast Guide | $189.01 | -$10.91 | First dynamic support layer |
| Guide Line | $185.16 | -$14.76 | Secondary structural support |
| Mean Line | $183.38 | -$16.54 | Average price. Institutional fair value zone |
| Slow Line | $175.76 | -$24.16 | Deep support. Loss of this would change the character |
| Entry / Support | $198.88 | -$1.04 | Nearest structural support. If this holds on a dip, it is actionable |
| Stop Level | $185.65 | -$14.27 | Below this, the long thesis needs rethinking |
| Channel Floor | $168.22 | -$31.70 | Absolute structural floor. Would require a significant breakdown to reach |
Scenario Analysis
| Scenario | Trigger | Implication |
|---|---|---|
| Long case | Holds $198.88 and reclaims $201.04 ceiling | $222.35 target opens. Structure confirms. Add on confirmation above ceiling |
| Short case | Bears need to break $185.65 and hold below it | Counter-trend. Above that level, buyers are in control. Shorts carry real risk here |
| Wait case | Price stays between $198-$201 | Compression zone. Do not force it. Wait for a break in either direction |
Risk Assessment
Domain risk: Around 45% (moderate)
The trend is intact but momentum is not confirmed. One layer is missing. VIX at 20.29 with broad risk-off adds environmental pressure. The long case is building but you are not being paid to rush. Wait for all layers to align or a clean pullback to $198.88 support. The macro backdrop says be patient.
Bottom line: NVIDIA is mostly long but not fully confirmed. The trend is your friend here, but the short-term is mixed. Do not chase. Wait for the ceiling to break or the pullback to find support. This is a setup that needs one more piece of evidence before it becomes a trade.
This is analysis, not financial advice. Always manage your risk.



