
The NVIDIA Framework Journal for May 2026, newest read at the top. Each dated entry is our read on the close, kept as a living record so the framework can be judged over time. This is analysis, not financial advice.
Saturday 30 May 2026
NVIDIA (NVDA) — Daily Read | Saturday 30 May 2026
NVIDIA (NVDA) | Post Close Setup Daily Read | Data basis: 2026-05-30 close
Where It Sits
Structure
Structurally NVIDIA (NVDA) sits above its short-term moving averages with the daily trend firmly higher. The recent advance has been orderly with no signs of distribution or topping behaviour. The reference anchor at 216.97 acts as the bias line.
Momentum
Momentum is positive but measured. The advance has been orderly without stretching the range. Internal readings are constructive without flagging exhaustion — supportive of continuation.
Volume & Flow
Flow on the session close was measured. Positioning data suggests steady accumulation rather than aggressive directional commitment. The pattern supports continuation rather than reversal.
Key Levels
| Level | Type | Significance | Action Zone |
|---|---|---|---|
| 225.00 | Resistance | Upper range target, prior supply zone | Take profits / fade if rejected |
| 219.00 | Pivot | Mid-range continuation marker | Hold = constructive; lose = consolidation |
| 216.97 | Session close | Reference anchor for next session | Above = continuation; below = mean revert |
| 213.00 | Support | Recent range floor, demand zone | Buy zone with defined stop |
| 208.00 | Major support | Prior breakout retest level | Stop-out below for longs |
Three Scenarios
Continuation
NVIDIA (NVDA) holds 216.97 and extends higher on continued sector leadership and institutional rotation. The broader tape supports continuation. Watch for a clean hold above the pivot.
Range
NVIDIA (NVDA) opens flat and churns around 216.97. Magnet to the prior close in absence of company-specific catalyst. Range trade.
Mean Reversion
NVIDIA (NVDA) fades on sector rotation or company-specific headline, gives back below support. Mean reversion within the broader uptrend.
Risk Score
Risk sits at Around 55%
Risk sits around 55 per cent. Vix at 15.4 supports a measured risk posture. sentiment at 61 is in greed territory. Single-stock positions carry company-specific headline risk. Standard sizing with defined stops — discipline beats conviction.
How to Walk It
Entry / Stop / Target structure:
- Long 213.00 pullback | Stop 208.00 | Target 219.00 | R:R 2:1
- Long 219.00 breakout | Stop 216.97 | Target 225.00 | R:R 1.5:1
- Fade 225.00 rejection | Stop above resistance | Target 216.97 | R:R 2:1
Experience-level guidance:
Beginner: Reduce size to half your standard. Trade only the cleanest setup from the entries above. If the tape opens against your bias, do nothing — wait for the second hour, when the institutional flow has tipped its hand.
Intermediate: Use the levels table to define the trading range. Fade the extremes with defined stops, take profits before the round-number resistance levels.
Advanced: The vol regime supports defined-risk structures around the key pivot levels. Keep notional small relative to your book — asymmetric speculation, not core positioning.
Continue Reading
The macro frame driving this read is unpacked in the session briefs:
Check the latest session briefs on the site.
This analysis is for educational and informational purposes only. It does not constitute financial advice. Always manage your risk independently and in accordance with your own financial circumstances.
Thursday 28 May 2026
NVIDIA (NVDA) — Daily Framework Read | Thursday 28 May 2026
NVIDIA (NVDA) | Post Close Setup Daily Read | Data basis: 2026-05-28 close
Where It Sits
Structure
Structurally NVIDIA (NVDA) sits above its short-term moving averages with the daily trend firmly higher. The recent advance has been orderly with no signs of distribution or topping behaviour. The reference anchor at 214.25 acts as the bias line.
Momentum
Momentum is positive but measured. The advance has been orderly without stretching the range. Internal readings are constructive without flagging exhaustion — supportive of continuation.
Volume & Flow
Flow on the session close was measured. Positioning data suggests steady accumulation rather than aggressive directional commitment. The pattern supports continuation rather than reversal.
Key Levels
| Level | Type | Significance | Action Zone |
|---|---|---|---|
| 221.00 | Resistance | Upper range target, prior supply zone | Take profits / fade if rejected |
| 216.00 | Pivot | Mid-range continuation marker | Hold = constructive; lose = consolidation |
| 214.25 | Session close | Reference anchor for next session | Above = continuation; below = mean revert |
| 211.00 | Support | Recent range floor, demand zone | Buy zone with defined stop |
| 207.00 | Major support | Prior breakout retest level | Stop-out below for longs |
Three Scenarios
Continuation
NVIDIA (NVDA) holds 214.25 and extends higher on continued sector leadership and institutional rotation. The broader tape supports continuation. Watch for a clean hold above the pivot.
Range
NVIDIA (NVDA) opens flat and churns around 214.25. Magnet to the prior close in absence of company-specific catalyst. Range trade.
Mean Reversion
NVIDIA (NVDA) fades on sector rotation or company-specific headline, gives back below support. Mean reversion within the broader uptrend.
Risk Score
Risk sits at Around 55%
Risk sits around 55 per cent. Vix at 15.7 supports a measured risk posture. sentiment at 60 is in greed territory. Single-stock positions carry company-specific headline risk. Standard sizing with defined stops — discipline beats conviction.
How to Walk It
Entry / Stop / Target structure:
- Long 211.00 pullback | Stop 207.00 | Target 216.00 | R:R 2:1
- Long 216.00 breakout | Stop 214.25 | Target 221.00 | R:R 1.5:1
- Fade 221.00 rejection | Stop above resistance | Target 214.25 | R:R 2:1
Experience-level guidance:
Beginner: Reduce size to half your standard. Trade only the cleanest setup from the entries above. If the tape opens against your bias, do nothing — wait for the second hour, when the institutional flow has tipped its hand.
Intermediate: Use the levels table to define the trading range. Fade the extremes with defined stops, take profits before the round-number resistance levels.
Advanced: The vol regime supports defined-risk structures around the key pivot levels. Keep notional small relative to your book — asymmetric speculation, not core positioning.
Continue Reading
The macro frame driving this read is unpacked in the session briefs:
Check the latest session briefs on the site.
This analysis is for educational and informational purposes only. It does not constitute financial advice. Always manage your risk independently and in accordance with your own financial circumstances.
Thursday 28 May 2026
NVIDIA (NVDA) — Daily Framework Read | Thursday 28 May 2026
NVIDIA (NVDA) | Pre Asia Setup Daily Read | Data basis: 2026-05-28 close
Where It Sits
Structure
Structurally NVIDIA (NVDA) sits above its short-term moving averages with the daily trend firmly higher. The recent advance has been orderly with no signs of distribution or topping behaviour. The reference anchor at 212.60 acts as the bias line.
Momentum
Momentum is neutral with internal readings near the centre of the range. That is the signature of a market digesting the prior move. The tape needs a fresh catalyst to commit to direction.
Volume & Flow
Volume data is limited for this session. The positioning read is neutral — no obvious skew in either direction. Watch for flow confirmation on the next session.
Key Levels
| Level | Type | Significance | Action Zone |
|---|---|---|---|
| 221.00 | Resistance | Upper range target, prior supply zone | Take profits / fade if rejected |
| 215.00 | Pivot | Mid-range continuation marker | Hold = constructive; lose = consolidation |
| 212.60 | Session close | Reference anchor for next session | Above = continuation; below = mean revert |
| 208.00 | Support | Recent range floor, demand zone | Buy zone with defined stop |
| 203.00 | Major support | Prior breakout retest level | Stop-out below for longs |
Three Scenarios
Continuation
NVIDIA (NVDA) holds 212.60 and extends higher on continued sector leadership and institutional rotation. The broader tape supports continuation. Watch for a clean hold above the pivot.
Range
NVIDIA (NVDA) opens flat and churns around 212.60. Magnet to the prior close in absence of company-specific catalyst. Range trade.
Mean Reversion
NVIDIA (NVDA) fades on sector rotation or company-specific headline, gives back below support. Mean reversion within the broader uptrend.
Risk Score
Risk sits at Around 55%
Risk sits around 55 per cent. Vix at 16.3 supports a measured risk posture. sentiment at 61 is in greed territory. Single-stock positions carry company-specific headline risk. Standard sizing with defined stops — discipline beats conviction.
How to Walk It
Entry / Stop / Target structure:
- Long 208.00 pullback | Stop 203.00 | Target 215.00 | R:R 2:1
- Long 215.00 breakout | Stop 212.60 | Target 221.00 | R:R 1.5:1
- Fade 221.00 rejection | Stop above resistance | Target 212.60 | R:R 2:1
Experience-level guidance:
Beginner: Reduce size to half your standard. Trade only the cleanest setup from the entries above. If the tape opens against your bias, do nothing — wait for the second hour, when the institutional flow has tipped its hand.
Intermediate: Use the levels table to define the trading range. Fade the extremes with defined stops, take profits before the round-number resistance levels.
Advanced: The vol regime supports defined-risk structures around the key pivot levels. Keep notional small relative to your book — asymmetric speculation, not core positioning.
Continue Reading
The macro frame driving this read is unpacked in the session briefs:
Check the latest session briefs on the site.
This analysis is for educational and informational purposes only. It does not constitute financial advice. Always manage your risk independently and in accordance with your own financial circumstances.
Tuesday 26 May 2026
Nvidia (NVDA)
MACRO LONG
Friday Close • 25 May 2026
EARNINGS WATCH — Wednesday After Close
Nvidia reports quarterly results this coming Wednesday after the bell. Elevated volatility is expected going into and coming out of the print. Size accordingly and be aware that levels can gap through without warning.
The Read
Nvidia has been grinding back toward a critical area of interest all week, and Friday’s close left the structure intact. The macro picture is committed to the long side. Every layer of analysis agrees on direction, momentum has been rising across the layers, and there is nothing acting as a ceiling right now. That kind of broad alignment is the setup you want to see before a name like this makes a significant leg higher. The question is not which way it wants to go — it is whether the entry is timed well enough to survive the earnings volatility that is coming in days.
The dark pool data reinforces the picture. $4.31 billion flowed through Nvidia in 777 institutional-sized orders this week. That is not speculative money; that is conviction. Institutions do not commit that kind of firepower into a name that is rolling over. Options flow is equally clear, with the put-to-call ratio sitting below 0.6, meaning the positioning overwhelmingly favours upside. These are not retail punters buying lottery tickets — these are funds building positions ahead of a catalyst they believe is favourable.
The nuance is the pullback. The analysis flags a pullback as approved and expected, not as a warning. This is the framework drawing a distinction between healthy price behaviour and something breaking down. A dip toward support gives late entrants a better location. The underlying trend is still rising. If Wednesday’s print comes in ahead of expectations, which institutional positioning is suggesting is the more likely scenario, the levels above become the immediate destination. If you are already positioned, the approach is to manage risk going into the number. If you are watching, the structure will tell you what you need to know on Thursday morning.
Key Levels
| Level | Price | Notes |
|---|---|---|
| Entry Zone | $130.50 – $132.00 | Pullback into structural support |
| Stop | $127.50 | Below key structural base |
| Target 1 | $140.00 | Prior resistance, partial exit |
| R:R | ~1.8:1 | Based on midpoint entry |
Risk Assessment
Around 55%
Elevated by the earnings event on Wednesday. Even with everything aligned long, binary events introduce gap risk that stops cannot protect against. The structural case is strong but the timing is the risk. Reduce normal position sizing by at least a third until the print resolves.
Experience Guidance
Newer traders should not be opening fresh positions into a Wednesday earnings event unless they have a specific plan for managing the overnight risk. The structure is bullish and the long thesis is sound, but a gap down on a miss can wipe out weeks of work before you get a chance to react. If you are already in a position, consider locking in a portion of profit before Tuesday’s close. If you are watching from the sideline, the better opportunity may be the Thursday open once the dust settles and the market has voted on the number.
This content is for informational and educational purposes only. It does not constitute financial advice or a recommendation to buy or sell any security. Trading financial instruments carries significant risk. Past performance is not indicative of future results. Always conduct your own research and consult a qualified financial adviser before making investment decisions.
Saturday 23 May 2026
Nvidia (NVDA) — Weekend Daily Read
Framework Bias
LONG BIAS
Nvidia is the single most important stock in the current market cycle. It is the physical backbone of the AI revolution, supplying the GPU accelerators that every major cloud provider, AI laboratory, and enterprise AI deployment depends upon. The demand for Nvidia’s H100 and B200 series chips continues to exceed supply, which is the most reliable indicator of pricing power and revenue growth visibility.
The tech sector’s 1.0% Friday gain, led by XLK, is directly supportive of NVDA. In a risk-on environment where money is flowing into technology, Nvidia captures an outsized share of those flows because it sits at the intersection of the two most powerful investment narratives: AI and semiconductors.
The framework is long NVDA. The structural case has not changed. Every single mega-cap tech company (Microsoft, Google, Amazon, Meta) is spending aggressively on AI infrastructure, and Nvidia captures the lion’s share of that capital expenditure. Until there is a credible alternative to Nvidia’s GPU ecosystem at scale, the revenue visibility is exceptionally high by semiconductor standards.
Key Levels
| Level Type | Price | Note |
|---|---|---|
| Major Resistance | $150 | Round number and key upside target |
| Near Resistance | $140 | Near-term ceiling and recent high zone |
| Current Price | ~$135 | Estimated Friday close |
| Near Support | $128 | Prior week consolidation zone |
| Key Support | $120 | Round number and weekly demand |
| Major Support | $110 | Monthly structural demand |
Trade Framework
| Scenario | Entry Zone | Stop | Target | R:R |
|---|---|---|---|---|
| Long on Tuesday dip | $130 to $132 | $125 | $145 | approx 2.6:1 |
| Long on $140 break and hold | $141 | $134 | $155 | approx 2.0:1 |
| Short on AI capex pullback narrative | $128 break below | $135 | $110 | approx 2.6:1 |
Confidence level: around 68%. NVDA has the strongest fundamental case of any individual stock in the framework right now. The 68% reflects the elevated valuation (the stock trades on exceptional multiples of current earnings) and the risk that any pullback in cloud capex guidance from Microsoft or Google would temporarily pressure NVDA even without any change in its own outlook. Buy the dip is the primary strategy.
Weekend Context
The Memorial Day weekend comes after what is likely NVDA’s strongest fiscal quarter. The question for the next earnings report is not whether Nvidia beat estimates, it is by how much and what the forward guidance says about Blackwell GPU ramp. The guidance number is what the market trades on; the historical quarter is already priced.
The AI capital expenditure race among US hyperscalers shows no sign of slowing. Microsoft announced $80 billion in AI infrastructure capex for the current fiscal year. Amazon, Google, and Meta have all similarly committed to record AI infrastructure spending. Each dollar of that spending flows disproportionately to Nvidia. That is the structural tailwind that makes the long thesis compelling even at elevated valuations.
The export control situation regarding Nvidia chips to China remains a watch item. The US government has restricted the most powerful Nvidia chips from being sold to China, which has created a large market for the restricted H20 chips that are allowed. Any further tightening of export controls would be a near-term negative for NVDA revenue but could also accelerate the international non-China demand as those markets seek to secure supply ahead of further restrictions.
Friday 22 May 2026
Daily Ticker Read — Friday 22 May 2026
NVDA: The Beat That Nobody Celebrated
NVIDIA Corp • $219.51 • -1.77% Thursday close
Current Read
Day two of post-earnings digestion. The numbers were exceptional. The stock is lower. That tells you everything about where expectations were sitting coming into this week. Friday is the final session of the digestion window and the institutional community will be watching whether buyers step in or whether the selling pressure has more to run.
What Happened
NVIDIA reported revenue of $81.6 billion for the quarter, ahead of what the market had priced in. The company announced an $80 billion share buyback programme, which under normal circumstances would be a significant positive catalyst. The stock fell regardless.
This is a sell-the-news event, and understanding why matters more than the numbers themselves. Going into earnings, NVDA had already recovered substantially off its April lows. The market had already given the company credit for a strong quarter before the results landed. When the print confirmed what was expected, there was nothing left to chase. Participants who bought the rumour sold the news.
Adding complexity: the China concession to Huawei. There is ongoing uncertainty about whether US export controls will tighten further or whether the current carve-outs represent a ceiling on NVDA’s addressable market in that region. That uncertainty is not priced out yet, and it is one reason institutional conviction on the long side is hesitant at current levels.
Thursday was day one of the digestion. Volume was elevated. The range was wide. The stock closed near the lower half of the day’s range, which tells you sellers were active into the close rather than fading. That is not the profile of a stock about to bounce immediately.
Institutional Positioning
When a stock beats on revenue, announces a record buyback, and still falls, you are watching institutional distribution. The smart money had built positions ahead of the event and used the earnings strength as liquidity to reduce exposure. This does not mean NVDA is broken. It means the near-term supply overhang is real and Friday needs to absorb it.
The buyback announcement is structurally supportive over a medium-term horizon. Eighty billion dollars of programmatic buying does not happen in a week, but it does act as a floor beneath the market when conditions normalise. The question for Friday is whether that floor is here at $215-219 or whether the market needs to test lower before buyers commit.
Key Levels
Long Entry
$212-215
Prior structure support
Stop
$208
Below support cluster
Target
$228-232
Pre-earnings gap zone
Short Side
If price bounces into $222-224 and stalls, that is your rejection zone. A clean rejection there with volume declining on the bounce sets up a short towards $212. Stop above $226.
Friday Scenario
Bull Case
Opening gap holds above $218. Buyers absorb overnight weakness in the first 30 minutes. Volume builds through the session. Target $226-228 by end of day. This is the two-day digestion complete, institutional buyers returning.
Bear Case
Continued distribution. Price tests $212-215 support zone. If that zone fails on volume, $205 becomes the next area of interest. Watch for selling acceleration in the first hour as the primary signal.
Day 2 Digestion: What to Watch
The first 30 minutes of Friday’s session will set the tone. Watch whether the opening range establishes above or below Thursday’s close of $219.51. A higher open that holds is constructive. A lower open that immediately sells off tells you the digestion is not done.
Volume is the other signal. If Friday’s volume is materially lower than Thursday’s, the sellers have largely had their say and the stock can begin to stabilise. If volume remains elevated and price is falling, distribution is ongoing.
Do not fight the trend on a Friday with no clear reversal signal. The setup for NVDA right now is patient: wait for the digestion to complete, let the stock find its post-earnings equilibrium, and then look for a clean entry rather than catching a falling name.
Sizing
NVDA at $219 is a wide-ranging instrument post-earnings. Expect 3-5 point intraday swings to be normal. Size for the range, not your conviction. A 4-point stop on this name means you need your position smaller than usual to keep risk within your normal parameters. If you are trading CFDs, model the dollar move per unit before entry, not after.
Cross-References
AMD is relevant here. AMD is showing relative strength despite NVDA’s weakness, which is a divergence worth noting. If NVDA stabilises and the semi sector finds its footing, AMD may lead the recovery. SOX (semiconductor index) is the macro context for any NVDA trade Friday. Watch whether the index holds its own prior support before taking directional exposure in individual names.
Tuesday 19 May 2026
NVIDIA Below Max Pain as Options Market Prices AI Leadership Premium
Monday 18 May 2026 | Stocks | NVDA
Session Summary
NVIDIA closed Monday at $222.32, sitting approximately 1.2% below its options max pain level of $225 for the Friday 18 May weekly expiry. The options market shows call volume of 1.41 million contracts versus 688,573 puts — a put-to-call ratio of 0.49 which is heavily skewed toward bullish positioning. Despite this bullish options skew, NVIDIA underperformed relative to the call positioning, suggesting that the upside momentum expected by options buyers has not yet materialised this session. NVIDIA appears on the broad institutional bullish options list for Monday alongside META, MSFT, AAPL, and AMZN.
Daily Read
NVIDIA’s position as the dominant AI infrastructure supplier means its price action is as much about narrative as it is about fundamentals in the short term. The Nasdaq closed down 0.43% on the day, and within that context NVIDIA’s position below its max pain level at $222 is instructive. Max pain theory suggests that options market makers benefit from price gravitating toward the level where the maximum number of options contracts expire worthless — at $225. With NVIDIA trading $2.68 below that, there is a mechanical argument for price to drift higher through expiry.
The broader AI spending cycle remains the structural bull case. With VIX at 17.82 and declining (down 3.31% today), the fear premium is being priced out of equities, which historically benefits the high-growth names. The AAII survey showing bulls at 39.3% — above historical averages for the fourth consecutive week — means retail sentiment is constructive without being euphoric, which is the ideal backdrop for continued AI positioning. The put-to-call ratio of 0.49 at NVIDIA confirms that institutional options traders are positioned for further upside rather than hedging against a fall.
Key Levels
| Level | Price | Context |
|---|---|---|
| Max Pain / Resistance | $225.00 | Options max pain for Friday 18 May expiry; price is magnetically drawn here by market mechanics |
| Extended Resistance | $230.00 | Round-number level above max pain; breakout target if momentum builds |
| Entry (long) | $220.00 — $222.00 | Current price zone; buy the dip into max pain mechanics with a tight stop |
| Stop | $216.00 | Below a meaningful technical support; failure here signals the max pain gravity is not working |
| Target | $225.00 — $228.00 | Max pain through to the breakout extension; R:R approximately 1.5:1 to 2:1 |
Tomorrow’s Setup
Bias: Moderately bullish, with max pain mechanics providing a near-term upward pull. The combination of institutional bullish options positioning and the $225 max pain magnet creates a constructive set-up for Tuesday.
- Bull scenario: QQQ stabilises and opens higher Tuesday. NVDA follows, reclaims $225 and closes above it. Volume confirmation above $225 opens a run to $230.
- Bear scenario: Tech sells off further as bond yields rise. NVDA breaks below $218 — $216, invalidating the max pain thesis. That is a 2.4% drop from current levels and would require a significant macro catalyst.
- Earnings watch: NVDA is not reporting this week, so the price action will be driven by sector flows and macro rather than company-specific news.
Experience Guidance
New to NVDA trading: Max pain is a short-term mechanical concept tied to options expiry — it tells you where the market wants to settle, not where it must go, so use it as a guide not a guarantee.
Developing trader: NVDA’s call-heavy options book (0.49 put-to-call) tells you institutional traders are positioned for higher prices — in the absence of a major negative catalyst, fighting that positioning is a low-probability trade.
Experienced trader: The $220 — $225 range is a clean defined-risk setup: long at $222, stop $216, target $228. The risk is $6 for a $6 gain at T1 — not exceptional, but the max pain mechanics and institutional positioning tilt the probability in favour of the long side.
This content is for informational and educational purposes only and does not constitute financial advice. Past performance is not indicative of future results. All trading involves risk. Always conduct your own research before making any investment decisions.
Monday 18 May 2026
NVIDIA Below Max Pain as Options Market Prices AI Leadership Premium
Monday 18 May 2026 | Stocks | NVDA
Session Summary
NVIDIA closed Monday at $222.32, sitting approximately 1.2% below its options max pain level of $225 for the Friday 18 May weekly expiry. The options market shows call volume of 1.41 million contracts versus 688,573 puts — a put-to-call ratio of 0.49 which is heavily skewed toward bullish positioning. Despite this bullish options skew, NVIDIA underperformed relative to the call positioning, suggesting that the upside momentum expected by options buyers has not yet materialised this session. NVIDIA appears on the broad institutional bullish options list for Monday alongside META, MSFT, AAPL, and AMZN.
Daily Read
NVIDIA’s position as the dominant AI infrastructure supplier means its price action is as much about narrative as it is about fundamentals in the short term. The Nasdaq closed down 0.43% on the day, and within that context NVIDIA’s position below its max pain level at $222 is instructive. Max pain theory suggests that options market makers benefit from price gravitating toward the level where the maximum number of options contracts expire worthless — at $225. With NVIDIA trading $2.68 below that, there is a mechanical argument for price to drift higher through expiry.
The broader AI spending cycle remains the structural bull case. With VIX at 17.82 and declining (down 3.31% today), the fear premium is being priced out of equities, which historically benefits the high-growth names. The AAII survey showing bulls at 39.3% — above historical averages for the fourth consecutive week — means retail sentiment is constructive without being euphoric, which is the ideal backdrop for continued AI positioning. The put-to-call ratio of 0.49 at NVIDIA confirms that institutional options traders are positioned for further upside rather than hedging against a fall.
Key Levels
| Level | Price | Context |
|---|---|---|
| Max Pain / Resistance | $225.00 | Options max pain for Friday 18 May expiry; price is magnetically drawn here by market mechanics |
| Extended Resistance | $230.00 | Round-number level above max pain; breakout target if momentum builds |
| Entry (long) | $220.00 — $222.00 | Current price zone; buy the dip into max pain mechanics with a tight stop |
| Stop | $216.00 | Below a meaningful technical support; failure here signals the max pain gravity is not working |
| Target | $225.00 — $228.00 | Max pain through to the breakout extension; R:R approximately 1.5:1 to 2:1 |
Tomorrow’s Setup
Bias: Moderately bullish, with max pain mechanics providing a near-term upward pull. The combination of institutional bullish options positioning and the $225 max pain magnet creates a constructive set-up for Tuesday.
- Bull scenario: QQQ stabilises and opens higher Tuesday. NVDA follows, reclaims $225 and closes above it. Volume confirmation above $225 opens a run to $230.
- Bear scenario: Tech sells off further as bond yields rise. NVDA breaks below $218 — $216, invalidating the max pain thesis. That is a 2.4% drop from current levels and would require a significant macro catalyst.
- Earnings watch: NVDA is not reporting this week, so the price action will be driven by sector flows and macro rather than company-specific news.
Experience Guidance
New to NVDA trading: Max pain is a short-term mechanical concept tied to options expiry — it tells you where the market wants to settle, not where it must go, so use it as a guide not a guarantee.
Developing trader: NVDA’s call-heavy options book (0.49 put-to-call) tells you institutional traders are positioned for higher prices — in the absence of a major negative catalyst, fighting that positioning is a low-probability trade.
Experienced trader: The $220 — $225 range is a clean defined-risk setup: long at $222, stop $216, target $228. The risk is $6 for a $6 gain at T1 — not exceptional, but the max pain mechanics and institutional positioning tilt the probability in favour of the long side.
This content is for informational and educational purposes only and does not constitute financial advice. Past performance is not indicative of future results. All trading involves risk. Always conduct your own research before making any investment decisions.
Sunday 17 May 2026
NVDA : Friday 16 May 2026
Ticker Review | Semiconductors | Alpha Insights
Week at a Glance
What Happened
The Nasdaq fell 1.54% on Friday. NVDA was bought.
$2.96 billion in dark pool orders hit NVDA on a day when the broad index was down. That is 9.2 million shares. It is 24.9% of the entire session’s dark pool activity concentrated in one name. On a session where the index fell, where silver collapsed, where gold dropped, institutions chose to deploy a quarter of their dark pool capital into a single semiconductor stock.
That is not averaging into a losing position. That is deliberate accumulation during an index selloff. The timing is the tell. Dark pool volume concentrated in the 10:30 to 14:00 ET window : when VIX was spiking toward 19.22 and retail was buying put protection. Institutions used the retail fear as entry liquidity. They paid slightly higher volatility premium but bought 9.2 million shares while the crowd was panicking.
The options tell the same story. 86,534 NVDA options orders in a single session. That is 2.8 times the 30-day average. The concentration is at 880 and 900 call strikes, expiring between 23 and 30 May. That is a pre-earnings structure. NVDA reports in late May. The institutions building this position are positioning for a specific event that is three to four weeks away.
What the Alpha Insights Said
Institutional Flow Read : Dominant and Anomalous
The institutional flow analysis described the NVDA dark pool as “dominant and anomalous.” It was the lead finding. 24.9% of the entire session’s dark pool activity in a single name that counter-trended its own index. The hypothesis is pre-earnings positioning : a multi-leg institutional strategy requiring NVDA beat plus guidance raise. NVDA is 6-7% of the Nasdaq. An 8-12% post-earnings rally equals 0.5-0.8% index contribution. Institutions are not just buying NVDA. They are setting up for an index move through NVDA.
Options Watch : Pre-Earnings Structure Confirmed
The options analysis confirmed the earnings positioning read. 880 and 900 call strikes concentrated in the 23-30 May expiry window. That window brackets the likely earnings date. $38.4M in NVDA 900 calls expiring 30 May. $24.1M in 880 calls expiring 23 May. Near-dated pre-earnings momentum before the longer-dated position matures. This is not retail speculation. The premium sizes are institutional.
Earnings Echo : Applied Materials Beat as Supply Chain Signal
The earnings analysis documented Applied Materials beating by $0.14. That is NVDA’s supply chain. When semiconductor equipment companies beat, it validates AI data centre infrastructure demand. The demand picture that will drive NVDA’s earnings already has a confirming data point from the supply chain. Cisco also beat on AI infrastructure spend. Two independent reads from adjacent companies validating the same underlying demand that NVDA will report on.
Sector Flow : Technology Bifurcation Is the Key Insight
Sector analysis found technology internally split. XLK ETF fell as the broad sector faces rate multiple compression. NVDA accumulated at institutional scale simultaneously. The conclusion: avoid XLK, use NVDA directly. The ETF mixes two opposing signals. NVDA’s AI cycle is partially independent of rate multiple compression because AI infrastructure spend is described as structural, not discretionary, by the companies buying it.
Overwatch Synthesis : NVDA Is the Central Resolution Catalyst
The analysis synthesis identified NVDA late-May earnings as the primary resolution event for the entire rates-versus-equities contradiction. The market is currently making a high-stakes bet that AI earnings growth justifies 21x forward P/E at 4.50%+ rates. NVDA is the single most important data point in that argument. If NVDA delivers 5%+ earnings beat plus guidance raise, the institutional equity thesis is validated. If NVDA disappoints, the $542M in equity calls and $11.88B dark pool positions face rapid reassessment.
Key Levels
| Level | Price | Significance |
|---|---|---|
| Target | $920 | Options concentration ceiling. Pre-earnings target. |
| Call Strike Concentration | $880 / $900 | Institutional call strikes expiring 23-30 May. Where the options money is betting. |
| Monday Gate | $870 | Must hold above here on Monday open. Activation condition for the long. |
| Entry Zone | $850-$870 | Optimal entry on pullback. Better R:R than buying strength. |
| Stop | $840 | Closing basis. Below here the accumulation thesis is challenged. |
Signal + Bias
Activation gate: NVDA must hold above $870 on Monday open. If it fails the gate, do not enter. Cancel the trade and wait for the next setup. This is the single most important rule for this position.
Six separate layers confirmed this position. Dark pool $2.96B. Options orders 2.8x average. Call strikes at 880/900 pre-earnings. Relative strength against a -1.54% index. Applied Materials supply chain validation. AI cycle independent of rate multiple compression.
STANDARD sizing rather than MAX because Monday’s open is a gate. You do not know yet how the institutional positions are marked overnight. If futures gap down and NVDA opens below $870, the near-dated options start deteriorating fast. The $840 stop reflects where the accumulation thesis breaks down, not where you feel comfortable being wrong.
Next Week Setup
Monday open is the first decision point. Watch the first 15 minutes. Does NVDA hold above $870? Does it gap up with volume? Or does it fade below $850 on broad market weakness?
The FOMC minutes on Wednesday 14:00 ET create binary risk for the near-dated options. If the minutes are hawkish and the 10-year pushes toward 4.65%, the 880 call strikes start losing intrinsic value fast with only days until expiry. If hawkish-hold, the earnings thesis stays intact and the calls appreciate.
The late-May earnings date is the primary catalyst. All the dark pool and options activity builds toward that single event. You need: five percent or more EPS beat, forward guidance raise, and AI data centre demand validation in the call commentary. All three. If management guidance is cautious, $62M in near-dated call premium moves toward zero quickly.
Three Scenarios for NVDA Next Week
NVDA opens above $870 with volume. VIX below 18. Calls appreciate. Dark pool positions +3-5%. Entry at $850-$870 on any Monday pullback. Target $920 into earnings window.
Monday gate passes but no momentum. NVDA trades sideways as market waits for FOMC Wednesday. Near-dated calls at risk from theta decay. Longer-dated position intact. Patient hold.
NVDA opens below $870 and stays below. Broad market deterioration. Do not enter. $840 stop triggers if already positioned. Close and reassess after FOMC Wednesday.
Risk Score
Why around 40%: The accumulation signal is as clean as institutional data gets. $2.96B dark pool, 86,534 options orders, relative strength against the index. But the risk is concentrated in one event: NVDA earnings. Any pre-earnings weakness, guidance miss, or hawkish FOMC minutes sends the 880/900 calls toward zero rapidly. The gate at $870 is the risk management tool that keeps you from entering a deteriorating setup. Respect it.
Execution Rules
- Monday open above $870 required. No gate, no trade.
- Entry at $850-$870 on pullback. Not at the open, not chasing strength.
- Stop $840 closing basis. Below there, the thesis is challenged.
- STANDARD sizing only. Not MAX until Monday gate confirms and VIX settles.
- No new entries 12:00-13:45 ET Wednesday before FOMC minutes.
- Late-May earnings is the primary catalyst. Plan your hold accordingly.
Alpha Insights : Friday 16 May 2026. For informational purposes only. Not financial advice. All trading involves risk of loss.
Friday 15 May 2026
NVIDIA (NVDA) — Daily Read | Friday 15 May 2026
Friday close | NVDA $225.32 (-4.42%) | Led the NAS100 rally Thursday, led the sell-off Friday | Not financial advice
WHAT CHANGED FROM YESTERDAY
Yesterday NVDA was the engine of the CPI rally — up 3.9% and leading the tech complex higher. The read shared a 95% long conviction alongside AAPL. NVDA validated it completely on Thursday. Today NVDA closed at $225.32, down 4.42%. The stock that led the rally on Thursday led the sell-off on Friday. This is the pattern of high-beta momentum stocks: they amplify moves in both directions. The Overwatch specifically identified NVDA as the rate-cut proxy — when the market prices fewer rate cuts (which Retail Sales disappointment can paradoxically trigger via growth concern rather than inflation), NVDA, which carries a large premium on future earnings growth, gets repriced quickly. -4.42% in one session after +3.9% the session before is a two-day round trip that leaves NVDA roughly where it was on Wednesday.
HEADLINE STATE: SHORT PRESSURE — NVDA -4.42%, Hardest Single-Name Hit in the Tech Complex
NVDA at $225.32 is the worst performer in the tech names on Friday. QQQ fell 1.51%. NVDA fell 4.42%. The beta to the NAS100 on a down day is nearly 3x. This is characteristic of NVDA at this valuation level — the premium to fair value expands in risk-on and compresses in risk-off faster than any other Mag 7 name. The -4.42% reflects not just the market’s direction but NVDA’s specific role as the highest-conviction long in the institutional book. When conviction names sell, they sell hard.
| Metric | Thu 14 May | Fri 15 May | Note |
|---|---|---|---|
| NVDA | +3.9% (leading tech) | $225.32 (-4.42%) | Full two-day round trip |
| QQQ (benchmark) | +0.85% | -1.51% | NVDA ~3x QQQ move both ways |
| NVDA vs AAPL | NVDA +3.9% vs AAPL -0.15% | NVDA -4.42% vs AAPL -?% | Thursday divergence reverses |
| Overwatch label | Rate-cut proxy | Rate-cut premium compressed | Growth concern = repricing |
KEY LEVELS INTO NEXT WEEK
- $225.32 — Friday close. The two-day round trip leaves NVDA here. Monday’s open direction tells you if this is a floor or a continuation.
- $230 — Thursday’s approximate high. A recovery to this level next week would signal the sell-off is done.
- $220 — next support. A Monday open below here extends the sell-off into a three-day move.
- $215 — deeper structural support. Only in view if QQQ breaks $700 next week and growth fear intensifies.
OVERWATCH CONTEXT
The Overwatch named NVDA as the rate-cut proxy for the week. Thursday confirmed it: when CPI dropped and rate-cut expectations rose, NVDA was the first and biggest beneficiary. Friday reversed it: when Retail Sales disappointed and growth concern replaced inflation optimism, NVDA was the first and biggest casualty. The rate-cut proxy thesis works symmetrically. NVDA is the most rate-sensitive name in the large-cap tech universe because its valuation carries the highest forward growth premium. More rate cuts = higher present value of future earnings = NVDA up. Growth concern = fewer rate cuts needed = NVDA premium compresses = NVDA down. That is Friday in one sentence.
WHAT TO WATCH NEXT WEEK
- NVDA is the leading indicator for NAS100 next week. NVDA recovering on Monday tells you QQQ recovers. NVDA extending lower tells you QQQ extends lower.
- Any NVDA-specific catalyst — AI spending news, hyperscaler capex announcements, supply chain data — overrides the macro direction temporarily.
- The rate-cut probability implied by Fed funds futures next week moves NVDA directly. Watch the market’s rate expectations as closely as the price.
- $220 must hold on Monday. Below it and -4.42% becomes the start of a three-day trend rather than a flush.
Friday 15 May 2026 | Not financial advice. For informational purposes only.
Friday 15 May 2026
NVIDIA Corporation (NVDA) — Daily Read | Friday 15 May 2026
Post-CPI close | $235.74 — rate-cut proxy delivered, repricing just started | Not financial advice
WHAT CHANGED FROM YESTERDAY
Yesterday NVDA delivered exactly what 95% conviction is supposed to deliver: +4.39% on CPI day, the single largest percentage move across all 20 instruments in this read. The session closed at $235.74. The analysis described it as “near-maximum conviction with multi-timeframe alignment” and the CPI catalyst was the confirmation that completed the setup. What the Overwatch added is the framing that makes Friday’s read important: NVDA at $235.74 is the rate-cut proxy. The Overwatch identified NVDA $232 as the level to hold — any pullback toward that level before the discount rate repricing is fully expressed in analyst price targets is a buying opportunity within the confirmed rate-cut regime. The repricing has started. It has not finished. Analyst price target revisions take two to six weeks to roll through the community. Thursday was Day 1.
HEADLINE STATE: RATE-CUT PROXY — Repricing Has Started, Not Finished
NVDA at $235.74 is not where the rate-cut repricing ends. The Overwatch was explicit: Thursday was the data event. The repricing is the institutional acknowledgement over the following two to six weeks that the CPI confirmation was as significant as the price move suggested. Every analyst who had a higher discount rate in their NVDA model as of Wednesday now needs to rebuild that model with a lower rate. NVDA at 35x forward earnings with a long AI infrastructure growth runway gets a larger percentage repricing than a mature business at 15x. That process runs through the analyst community, through institutional portfolio managers, through index-tracking adjustments. The window between now and those first price target revisions is the asymmetry that the Overwatch identified. Friday’s Retail Sales print is the next input: strong data confirms Q2 demand is there to support NVDA’s data centre revenue outlook.
Key Levels
| Level | Price | Significance |
|---|---|---|
| Thursday close | $235.74 | +4.39% — 95% conviction delivered, Day 1 of the repricing |
| Rate-cut proxy floor | $232 | Overwatch: pullback here before analyst revisions = buying opportunity |
| Strong RS continuation | $239–$245 | Retail Sales strong + NVDA holds = repricing accelerates |
| Friday consolidation | $232–$237 | Normal digestion after +4.39% single-session move |
| vs S&P 500 | 5x outperformance | NVDA +4.39% vs SPY +0.79% — institutional conviction move confirmed |
| vs AAPL | NVDA +4.39% | AAPL -0.22% | Overwatch Signal Two: same session, same event, opposite outcomes — duration explains everything |
Structure · Momentum · Flow
Structure
Rising all timeframes confirmed. Thursday’s +4.39% with no intraday reversal is structural confirmation, not a spike. The multi-timeframe alignment the Wednesday read identified is now supported by a fundamental catalyst. Structure is as clean as it gets.
Momentum
Positive and confirmed. A 5x outperformance ratio on an index day is not momentum fading — it is momentum accelerating relative to the market. Pullbacks toward $232 within the next two to three weeks are the normal buy-the-dip mechanics.
Flow
Institutional money made a deliberate choice in NVDA on Thursday: lower inflation = lower discount rate = higher present value of future AI earnings. That logic does not reverse on Friday. Flow is directionally long until the analyst price target revisions are absorbed.
THE NVDA VS AAPL LESSON — IT APPLIES TO EVERY EARNINGS SEASON
The Overwatch called this the most precise macro signal of the year so far: NVDA +4.39% and AAPL -0.22% in the same session, on the same macro event. Neither company reported earnings. The move in both was purely the market repricing the discount rate applied to future earnings. NVDA at 35x forward earnings with a long growth runway repriced 4–6% higher as the rate-cut path was confirmed. AAPL at a lower multiple with mature, current-period earnings saw no repricing. Before any earnings season, apply the same test: is this company’s value in its future earnings stream or its current earnings stream? The answer tells you how much the macro environment’s rate decision matters to that stock. That is worth more than knowing which direction the index went on any given day.
| Bias | LONG — repricing in progress, pullbacks are the opportunity |
| Risk estimate | Around 15% — clearest long in this entire read entering Friday |
| Buy level | $232 — rate-cut proxy floor, confirmed by Overwatch |
| Analyst revision window | 2–6 weeks — the asymmetry the Overwatch identified |
| Week carry | Bullish — the setup that was 95% conviction yesterday is now confirmed |
This content is for educational and informational purposes only and does not constitute financial advice. Past analysis does not guarantee future results. Always conduct your own research before making any trading decisions.
Thursday 14 May 2026
NVIDIA Corporation (NVDA) — Daily Read | Thursday 14 May 2026
Post-CPI mid-session | CPI day monster — leading the entire tech complex | Not financial advice
WHAT CHANGED FROM YESTERDAY
Yesterday NVDA was the cleanest read in the entire universe: 95% long, structure rising all timeframes. The analysis described it as “near-maximum conviction with multi-timeframe alignment” and noted that “a pullback in this setup is a buying opportunity, not a warning sign.” Today CPI was that catalyst. NVDA is at $234.63 (+3.9%) mid-session — the single largest mover in percentage terms across all 20 instruments in this read. The 95% conviction long has delivered exactly what high conviction setups are supposed to deliver.
HEADLINE STATE: MAXIMUM DELIVERY — +3.9%, Leading Tech on CPI Day
NVDA at +3.9% when the S&P is up 0.78% is a 5x outperformance ratio on the index. When the most-watched tech stock makes a move like this on CPI day, it is institutional money making a deliberate choice: lower inflation is better for AI capex spending, better for data centre demand, better for the multiples on a growth stock that spends heavily on infrastructure. That is the institutional logic behind NVDA’s outsized move. The 95% conviction read from yesterday was not wrong — it was early by one day.
Key Levels
| Level | Price | Significance |
|---|---|---|
| Current price | $234.63 | +3.9% — CPI day monster, largest mover in this read |
| Prior conviction read | 95% long | Maximum conviction — delivered as expected |
| vs S&P 500 today | 5x outperformance | NVDA +3.9% vs SPY +0.78% — institutional conviction move |
| Structure state | Rising all timeframes | Multi-timeframe alignment confirmed by today’s action |
| AAPL comparison | -0.15% | NVDA vs AAPL: 4% rotation differential — AI over hardware |
Structure · Momentum · Flow
Structure
Structure rising across all timeframes — confirmed and extended by today’s move. The 95% long read from yesterday was correct. Structure has made a new near-term high on the session. Everything about NVDA’s structure is positive.
Momentum
3.9% intraday momentum on a macro event day is institutional. This is not retail chasing — this is programmatic buying and active fund reallocation. The scale of the move confirms the conviction. Momentum is at its strongest reading of the week.
Flow
NVDA is the clearest expression of the AI trade in public markets. When inflation falls, the AI infrastructure spend debate resolves positively — companies can invest in compute without worrying about rising cost of capital. Flow is directly into NVDA as the AI capex proxy.
TODAY’S BIAS: LONG — 95% Conviction Delivered, Manage the Trade Now
If you were positioned in NVDA from the 95% long read, today is a trade management day, not an entry day. At +3.9%, the logical actions are: take partial profits, move stop to breakeven minimum, and let the remainder run. Chasing NVDA at $234.63 after a 3.9% gap is not the setup — the setup was $226 yesterday. The next clean entry is on any pullback to the pre-CPI level or the first significant intraday dip.
Risk: Around 40%
Direction is clean and confirmed. Risk is purely about entry timing. Buying at the day’s high after a 3.9% gap compresses the risk/reward significantly. If already positioned, risk is well managed. If entering fresh, the risk is high because you are paying for confirmed news, not positioning ahead of it.
By Experience Level
New to this
NVDA at 95% conviction yesterday, +3.9% today. The analysis built the case for the long before the event. CPI was the catalyst but the setup was the reason. You do not need to predict CPI to be in the right position — you need to read where the strongest setup is and be positioned ahead of whatever catalyst comes.
Developing
NVDA +3.9% vs AAPL -0.15% is a 4% intraday rotation. The market is choosing AI semiconductor over consumer hardware on this CPI day. That rotation tells you where institutional conviction lies. NVDA is where the growth story is being priced. AAPL is being treated as a mature business with limited CPI sensitivity.
Experienced
The question now is: does NVDA hold $230 on any intraday pullback? A +3.9% day often sees late-session profit taking, especially from traders who were positioned for exactly this move. Watch whether $230 acts as new support into the close. If it does, the trade continues. If NVDA fades back below $228, the CPI bounce is being sold and the next day resets the setup.
This is a daily analysis read for educational and informational purposes only. Nothing here is financial advice. Past performance is not a guide to future results. Trading carries significant risk of loss. Always apply your own risk management.
Tuesday 5 May 2026
NVIDIA (NVDA) — Daily Framework Read | Tuesday 5 May 2026
NVIDIA Corporation (NVDA) | Daily Framework Read | Tuesday 5 May 2026
Where It Sits
Sunday’s read at 178.40 called continuation toward 185 with risk back to 175. That trade paid into the 188 to 192 zone before the late-day VIX bid pulled the complex back. Structure constructive, momentum neutral, flow stepping back. Three reads, three colours. That is what NEUTRAL means here.
Yesterday Versus Today
| Field | Monday | Tuesday | Change |
|---|---|---|---|
| Read | NEUTRAL | NEUTRAL | No flip |
| Structure | Higher highs intact | Range upper third | Slight softening |
| Momentum | Firm | Flat to soft | Cooler |
| Flow | Continuation buyers | Stepping back | Reduced |
| VIX | 16.99 | 18.29 | Vol bid back |
The headline read has not flipped, which matters. The framework is not telling you to sell. It is telling you the conditions that drove Sunday’s high-conviction long are no longer in place to the same degree. Two consecutive neutral sessions usually resolve in one of two ways: a fresh catalyst flips the headline, or a structural test flushes the weak side and resets the read.
What The Framework Reads
Structure. Trend off the April low intact. Higher highs and higher lows have not been violated. The 185 to 192 zone is the new short-term range, replacing the 175 to 185 zone that drove Sunday’s continuation thesis. The advance off 178 was a clean impulse; action since 192 has been corrective.
Momentum. Rolled from firm to flat. Internals in the upper half of their range without flagging exhaustion, but rate of change has stalled. The configuration that produces consolidation, retest, then either a slow grind or a sharp shake-out.
Volume and flow. Solid into Monday’s morning push, thinning through the afternoon as the VIX bid arrived. Call buying that drove Friday’s close has eased. Slow money has its position — not adding, not selling. Fast money is the marginal mover, and on a day where VIX adds nearly 8 percent, fast money is on the defensive.
Cross-asset. The conflict is across asset classes, not within NVDA itself. Equities bid but breadth thinning. Vol up but not panicked. Dollar firm. Bonds mixed. Crypto sideways. None giving a clean directional signal. When crosscurrents are this mixed, high-beta names range, not trend.
Key Levels
| Level | Type | What It Means |
|---|---|---|
| $215 | Major resistance | Earnings stretch target. Only relevant on a clean break of 200. |
| $200 | Round number | Big psychological level. Untouched on this leg. |
| $192–$198 | Range upper | Recent supply zone. Fade rallies here without confirmation through. |
| $185–$190 | Range floor | Holding above keeps the bull structure alive. |
| $175–$178 | Structural support | Sunday continuation entry zone. Real buy interest sits here. |
| $170 | Major support | Prior consolidation floor. Stop-out below for any swing long. |
Three Scenarios Into Wednesday
Range Hold
NVDA holds 185 to 195. Vol comes back in. Framework upgrades structure read by Wednesday. Slow money still in, fast money cautious. Base case while neutral persists.
Shake-Out
VIX adds another leg, NVDA tags 185 then 180, flushing weak longs. Buyers reload at 175 to 178. The 28 May earnings campaign reasserts late week.
Catalyst Up
Headline lift takes 195 cleanly. Framework flips back constructive. NVDA tags 198 to 200 before consolidating again into the print.
Risk Assessment
Around 60%
Moderate-to-elevated. Pushing higher: VIX added almost 8 percent on the day with VVIX following, the framework has been neutral for two consecutive sessions, breadth has thinned. Keeping it contained: the 28 May earnings campaign is still in place, the 185 floor has held cleanly, the 175 structural zone has not been tested in this leg, no scheduled binary catalyst on Tuesday. Net read: elevated but not extreme. Structure can absorb a vol bid without breaking but cannot absorb a fresh macro shock at the same time as a single-stock disappointment elsewhere in the Mag 7. Tuesday is a manage-risk session, not an add-risk session.
How To Walk It
Hold-and-watch. The neutral read says wait. Existing longs from the Sunday entry are sitting on a 12 to 14 dollar move in your favour — manage, do not add. Trail the stop, take partials at the upper range, reserve fresh risk for either a clean shake-out into 175 or a confirmed break above 195.
| Tier | Action | Levels |
|---|---|---|
| Manage | Existing longs: trail stop to 184, take partial at 195 | Stop 184 / Partial 195 / Runner 200 |
| Range fade | Tactical short into 195–197 with vol bid intact, target range mid | Entry 195–197 / Stop 199 / Target 188 |
| Reload | Wait for tag of 175–178 with structural buyers reappearing | Entry 175–178 / Stop 170 / Target 192 |
| Breakout | Wait for clean close above 195 with framework flipping constructive | Entry on confirm / Stop 192 / Target 200 then 215 |
Beginner. When the analysis reads neutral, do nothing. Sit in cash, watch how the 185 to 195 range resolves, re-engage when the headline read flips back to a one-direction call.
Intermediate. Fade the extremes, stand aside in the middle. Half size on tactical entries, full size only on the structural reload at 175.
Advanced. Vol supports defined-risk options around the range. A short-dated iron condor between 180 and 200 captures the range thesis. Save directional risk for the post-shake-out test where the 28 May campaign reasserts.
Track Record
Sunday called continuation off 178.40 toward 185 with risk back to 175. Trade paid two range-widths into 188 to 192. Calling continuation when the read is long, neutral when conflicting — discipline keeps the campaign intact through full cycles. Long Friday into the close, long Sunday into Monday, neutral Monday and Tuesday. Campaign managed, not churned.
Continue Reading
The macro frame and cross-asset reads behind this NVDA call sit alongside today’s full briefs and ticker reads.
This analysis is for educational and informational purposes only. It does not constitute financial advice. Always manage your risk independently and in accordance with your own financial circumstances.
Continue with Titan Protect
Twenty-plus instruments. One framework.
We read more than twenty instruments daily across four sessions. The framework’s sunrise call landed across the day — the Pre-NY case study shows what the lines drew, what New York did, and where the read stands.
Core
£59/mo
Indicator suite plus daily framework reads.
Edge Popular
£109/mo
Core plus Shield dashboard and member-only briefs.
Elite
£179/mo
Edge plus weekly 1:1 call and early access to new tools.
Save 15% on annual billing
Want to see the framework in action? Free Explorer tier — no card required.
Join the live community: Discord channel · Shield dashboard
Education, not financial advice. Trade your own analysis.
Sunday 3 May 2026
NVIDIA (NVDA) — Daily Framework Read | Sunday 3 May 2026
NVIDIA (NVDA) | Monday Open Framework Read | Data basis: Friday 1 May 2026 close
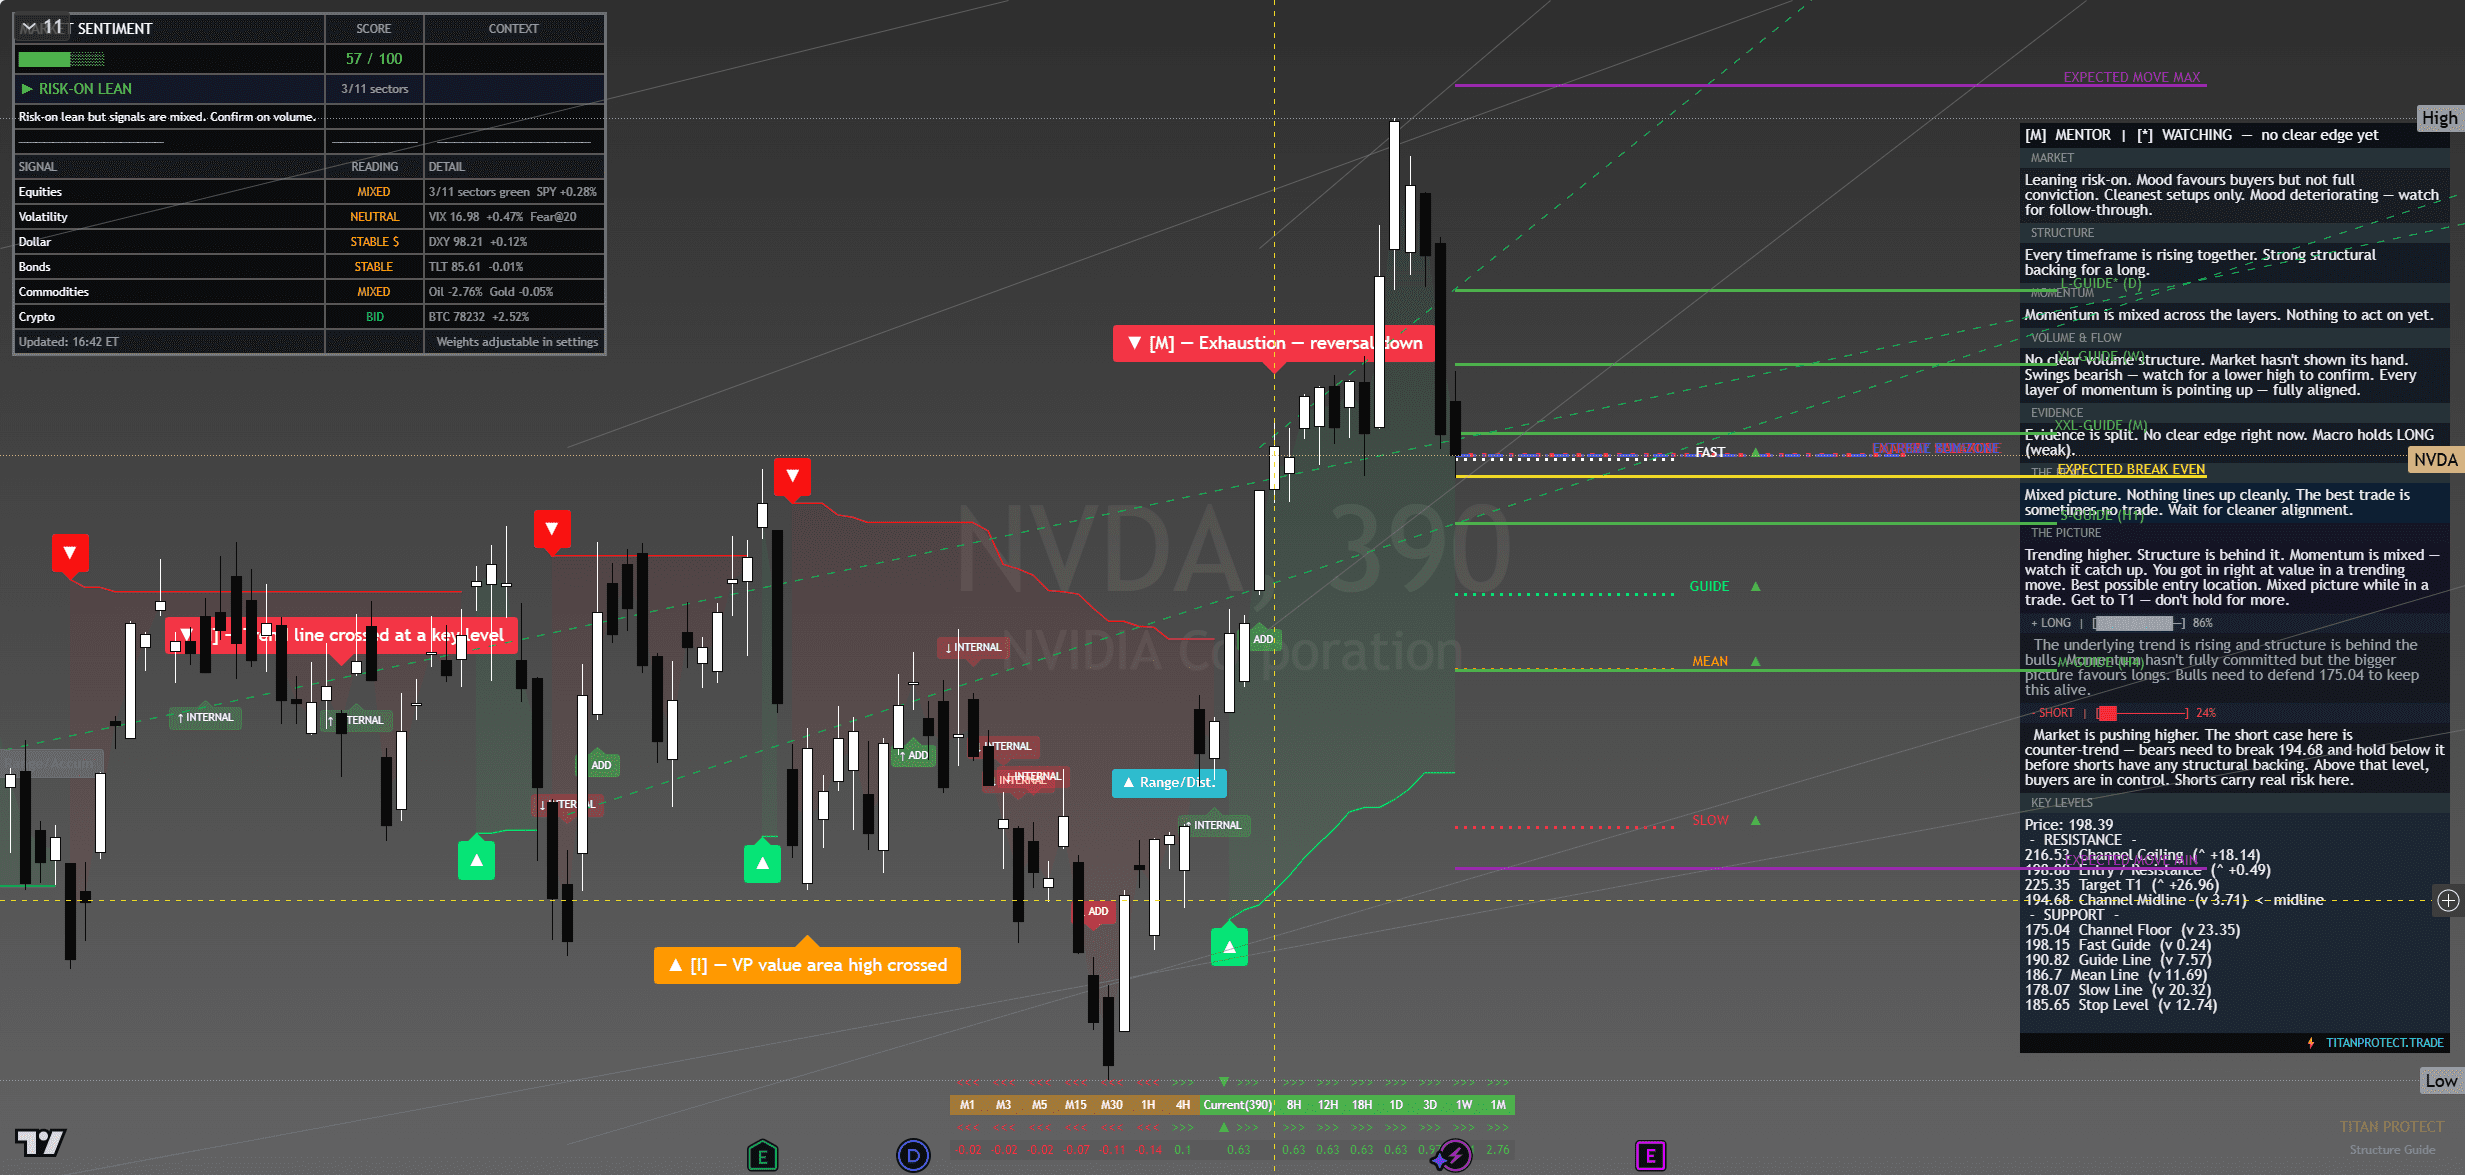
NVIDIA (NVDA) — chart with framework overlay. The Lens annotations show structural breaks, reversal triggers and confluence zones at the levels referenced below.
Where It Sits
Structure
Structurally NVDA is in a clear uptrend with higher highs and higher lows on daily and 4-hour timeframes. Friday’s close sits in the upper third of the recent range, holding above the rising 20-day MA. The structure is healthy but approaching round-number resistance.
Momentum
Momentum is firm and accelerating slightly on the daily timeframe. Internal momentum readings sit in the upper half of their range without flagging exhaustion. The momentum profile supports a controlled push toward 185 rather than a vertical breakout.
Volume & Flow
NVDA volume on Friday’s close was solid, with options flow showing continued call buying in the 180-185 strikes. The pattern is bullish positioning with conviction.
Key Levels
| Level | Type | Significance | Action Zone |
|---|---|---|---|
| 185.00 | Resistance | Round number, recent swing high zone | Take profits if reached |
| 180.00 | Pivot | Round-number breakout trigger | Hold above = bullish bias |
| 178.40 | Friday close | Reference anchor | Bias line for Monday open |
| 175.00 | Support | Round number, recent retest level | Buy zone with defined stop |
| 170.00 | Major support | Prior consolidation floor | Stop-out below for longs |
Three Scenarios Into Monday Open
Continuation
NVDA opens firm, holds 178, takes 180 cleanly on continued tech leadership and AI spend narrative. Runs to 185 zone by close. Constructive participation in tech-led continuation.
Range
NVDA opens flat, churns 175-182 through the session. Magnet to Friday close. Range trade in absence of company-specific catalyst.
Mean Reversion
NVDA fades on AI narrative softening or competitor headline, breaks 175, runs to 170. Mean-reversion within the broader uptrend.
Risk Score
Risk sits at Around 55% heading into Monday open.
Risk is moderate. NVDA is the index leader and the AI-spend narrative anchor — strong continuation on the macro tape but vulnerable to single-name headline shocks. The constraint is that the stock has run hard from the April low and is approaching the 180 round number where prior advances stalled. Standard size with defined stops, no aggressive entries above 180 until the level is taken cleanly.
How to Walk It
Entry / Stop / Target structure:
- Long 175.50-176.50 pullback | Stop 174.20 | Target 182.00 | R:R 3:1
- Long 180.20 breakout | Stop 178.50 | Target 185.00 | R:R 2.5:1
- Short 186.00+ rejection | Stop 188.00 | Target 180.00 | R:R 2.5:1
Experience-level guidance:
Beginner: The Monday open after a Friday record close is exactly the situation where over-confidence costs money. Reduce size to half your standard. Trade only the cleanest setup from the entries above. If the tape opens against your bias, do nothing — wait for the second hour, when the institutional flow has tipped its hand.
Intermediate: Use the levels table to define the trading range. Fade the extremes with defined stops, take profits before the round-number resistance levels. Do not carry directional positions through the day if you cannot watch the tape — Monday opens are prone to fast reversals.
Advanced: The vol regime is supportive of trending moves. Defined-risk options structures around the key pivot levels capture the asymmetry cleanly. Keep notional small relative to your book — Monday after a record-close week is asymmetric speculation, not core positioning.
The Sunday Composite — How This Read Sits Inside The Cross-Asset View
This single-instrument framework read is one slice of the larger Sunday weekend synthesis. The composite takes positioning, macro, sentiment, volatility, sector dispersion and trade structure as separate analytical layers and arrives at a unified composite verdict for Monday open. Each layer below is unpacked in full.
Read the full composite for the cross-asset context driving this instrument:
The institutional positioning split — Asset Managers vs Leveraged Funds in size
PCE clearance and the macro case for Monday’s carry
The three-layer sentiment disagreement — surface greed, retail neutral, professionals hedged
The vol curve term structure and what VVIX is signalling
Sector dispersion and the breadth problem behind the record close
The Monday position-management playbook — sizing tiers and trade plans
Sunday Overwatch — the unified composite verdict
Continue Reading
The macro frame driving this read is unpacked in the weekend briefs:
Sunday Setup — Reading The Tape Into Monday Open
PCE Cleared, VIX Crushed, SPY Closed 720 — Friday Post-Close Recap
This analysis is for educational and informational purposes only. It does not constitute financial advice. Always manage your risk independently and in accordance with your own financial circumstances.
Continue with Titan Protect
Twenty-plus instruments. One framework.
We read more than twenty instruments daily across four sessions. The framework’s sunrise call landed across the day — the Pre-NY case study shows what the lines drew, what New York did, and where the read stands.
Core
£59/mo
Indicator suite plus daily framework reads.
Edge Popular
£109/mo
Core plus Shield dashboard and member-only briefs.
Elite
£179/mo
Edge plus weekly 1:1 call and early access to new tools.
Save 15% on annual billing
Want to see the framework in action? Free Explorer tier — no card required.
Join the live community: Discord channel · Shield dashboard
Education, not financial advice. Trade your own analysis.



