
The Microsoft Framework Journal for April 2026, newest read at the top. Each dated entry is our read on the close, kept as a living record so the framework can be judged over time. This is analysis, not financial advice.
Thursday 30 Apr 2026
MSFT Beat Azure, Priced Clean, Now Holds the Premium — What Thursday’s Tape Says About the Gap
Microsoft Corporation (MSFT) | Daily Framework Read | Thursday 30 April 2026
Microsoft reported after the bell Wednesday. EPS $4.27 against a $4.06 estimate — a 5.2 percent beat. Revenue $82 billion against $81 billion. Azure growth held the line that Google Cloud’s 28 percent year-on-year number set as the cloud benchmark on Tuesday. The dark pool campaign that had been building at 198 orders Monday and 216 orders Tuesday at $1.31 billion notional was positioned for exactly this outcome. The print was clean, the after-hours reaction was positive, and the setup was classified as Gap-and-Go pending the open. Thursday’s question is how that gap holds against a tape that sold META’s 52 percent EPS beat and sold AMZN’s 69 percent EPS beat the same night MSFT reported clean. The stock is not in the Mag 7 sell-the-beat camp — it did not beat by a margin that triggered guidance anxiety. But PCE Friday is the next gate for everything MSFT gained this week.
The MSFT thesis Thursday. The print delivered. The campaign at $1.31 billion was built for a clean Azure beat — and Azure delivered. The contrast with META and AMZN is the key read. MSFT did not beat by 50-plus percent on EPS, so the capex commitment anxiety that drove those names lower is muted. MSFT’s beat was modest, clean, and precisely in the range the options market priced at a 5 percent implied move. Vol sellers collected. The Gap-and-Go classification from the Earnings Echo brief means the desk now monitors the gap hold — does it drift into the PCE window intact, or does the broader macro environment absorb the gains?
Where It Sits Today
EPS RESULT (Wed AMC)
$4.27
vs $4.06 est | +5.2% beat
REVENUE (Wed AMC)
$82B
vs $81B est | Clean delivery
DARK POOL (Tue)
$1.31B
216 orders | Campaign vindicated
SETUP CLASSIFICATION
Gap-and-Go
Pending open confirmation
The MSFT result sits in interesting company. GOOGL beat by 94 percent on EPS and rallied 5.5 percent. MSFT beat by 5.2 percent and was classified as a clean delivery. META beat by 52 percent and fell 7 percent. AMZN beat by 69 percent and fell 6 percent. The pattern that emerges is not about the absolute size of the beat — it is about whether the beat triggered concern about the sustainability of the forward guidance or the capex commitment. MSFT’s modest beat with $1 billion of incremental revenue is the “quiet deliverer” in the cluster. No dramatic upside that raises capex anxiety, no guidance ambiguity that triggers the sell reflex. That profile is why the implied move was priced at 5 percent — the options market correctly identified MSFT as the lowest binary-risk name in the quartet.
Azure is the lens. Google Cloud printing 28 percent year-on-year growth gave the MSFT Azure read a direct benchmark. If Azure printed significantly below 28 percent, that would have been a cloud-sector miss. The actual Azure result — confirmed in the AH session as broadly aligned with expectations — maintained the cloud sector’s growth narrative. This matters for the broader AI capex cycle that NVDA’s campaign depends on: two of the three largest cloud providers (GOOGL and MSFT) delivered prints that confirm enterprise cloud demand is holding. That is the structural validation the slow money’s $2.12 billion NVDA campaign needed.
What The Framework Reads
The dark pool campaign on MSFT was the institutional read before the print. 198 orders Monday, 216 orders Tuesday at $1.31 billion — a steady, disciplined build. Not the aggressive volume of NVDA’s 896 orders, but proportional to MSFT’s lower implied move and cleaner print profile. The options flow added $34.42 million in premium Wednesday as the final pre-print confirmation. The campaign did exactly what a campaign is supposed to do: it positioned into the binary at a size consistent with the risk, collected on the delivery, and now holds for the next catalyst.
The slight put-side skew that the options structure showed pre-print has now resolved. The puts that were paying a slight premium over the calls reflected the market’s lean that Azure could disappoint relative to the Google Cloud benchmark. That lean was wrong — Azure delivered. Post-print, the skew resolves toward neutral as the binary uncertainty collapses. The vol crush is confirmed. Vol sellers on MSFT collected. The remaining question is whether the post-print drift phase (Gap-and-Go classification) adds to the upside or whether macro sells it back.
The MSFT-specific risk into PCE Friday is different from TSLA’s or AAPL’s. MSFT is less consumer-exposed than either. Its primary customers are enterprises — and enterprise cloud spending is less sensitive to consumer confidence or the near-term rate environment than consumer purchases. However, MSFT still carries tech-sector correlation risk. A hot PCE that hits NQ materially takes MSFT along for the ride even if the fundamental case is not impaired. The structural campaign holds through that kind of mechanical correlation move. The short-term position — specifically anyone who bought the AH gap — needs to decide whether to hold through Friday’s macro gate.
Key Levels
| Level | Price / Zone | What It Means |
|---|---|---|
| AH gap-open level | Post-print AH high | The Gap-and-Go classification requires the AH gap to hold through the regular session open. A close back below the pre-print regular close classifies this as a gap-fill failure. |
| Campaign cost basis | Pre-print accumulation zone | 216 orders at $1.31 billion in notional is the institutional cost basis. This is the structural floor the slow money defends on any pullback. |
| PCE cool — extension target | +5% from AH gap level | If PCE Friday prints cool and the gap holds cleanly through the week, the drift continuation adds approximately one implied-move equivalent to the post-print level. That is the Gap-and-Go target. |
| PCE hot — mechanical flush | Back to pre-print close | A hot PCE that reprices tech broadly could pull MSFT back to its pre-print close as a mechanical correlation sell. This is the risk the short-term holder carries. |
| NQ sector floor | 27,000 | NQ below 27,000 overrides any single-name fundamental case. Sector-level mechanical sell regardless of MSFT’s print quality. |
Three Scenarios Into the Weekend
| Scenario | Probability | Path |
|---|---|---|
| Gap-and-Go Extends | 45% | Gap holds through the open. AAPL delivers clean tonight. PCE Friday prints in-line or cool. MSFT drifts higher through the week on earnings-drift momentum. Campaign extends toward the 5% post-print target. Azure narrative reinforced by the GOOGL cloud comp. |
| Gap Holds, Macro Caps | 35% | Gap holds but PCE Friday introduces friction. MSFT stays above pre-print close but does not drift materially higher. The gap-and-go classification is valid but the extension does not add a full implied move. Next week’s tape picks up the drift. |
| Gap Fill — Macro Override | 20% | Hot PCE or AAPL miss drives NQ below 27,000. MSFT’s post-print gains are mechanically sold as tech correlation. Gap fills back to pre-print close. The fundamental case is not impaired — the campaign holds — but the short-term long from the AH gap takes a loss. |
Risk Score
Around 55%
MSFT is the lowest-risk read in Thursday’s batch. The print is clean. The campaign is vindicated. The classification is Gap-and-Go. The residual risk is entirely macro — PCE Friday and any AAPL binary contamination into the tech sector. The 55% score reflects: clean print (reduces from 75% session average), but two active unknowns (PCE + AAPL) that cannot be dismissed. The fundamental case for MSFT through the Azure beat is intact. What is not certain is whether the market has the appetite to price that in before Friday clears.
How To Walk It
MSFT is the cleanest post-earnings entry candidate in the Mag 7 cluster — but even the cleanest candidate needs to respect the PCE gate. The Gap-and-Go classification says the earnings drift trade is on. The PCE uncertainty says size it appropriately and have a defined exit if the macro override scenario triggers.
| Tier | Action | Entry | Stop | Target |
|---|---|---|---|---|
| Gap-and-Go entry | Long on gap confirmation — first pullback to gap-level hold | AH gap floor | Pre-print close | +5% drift target |
| PCE gate | Reduce half position before 13:30 BST Friday if not stopped earlier | — | — | Reload post-PCE confirm |
| Gap fill scenario | Stop taken on gap fill to pre-print close. Re-evaluate after PCE. | — | — | Potential re-entry lower |
Continue Reading
- GOOGL Vindicated The Slow Money. Now AAPL, MSFT, META and AMZN Decide Whether The Cohort Holds — Earnings Echo Wednesday 29 April 2026
- SPY Block Doubled, Mag 7 Campaigns Held, INTC Reappeared — Institutional Flow Wednesday 29 April 2026
- Mag 7 Quartet IV Crush Stacked Against Friday PCE Tail — Option Watch Wednesday 29 April 2026
This is analysis, not financial advice. Always manage your risk.
Sunday 26 Apr 2026
MSFT Daily Ticker Read: Call Skew Says The Crowd Wants The Print, Put Skew Says Pay For Insurance Anyway
Daily Ticker Read | Sunday 26 April 2026
Microsoft closed Friday at 424.62 with a put-call volume ratio of 0.36 and call open interest stacked at 437.50 and 450. The same chain prices put-side implied vol at 172 against ATM at 29, a 143-point skew that reads as cheap calls and expensive puts under the same roof. The print lands Wednesday after the bell as the first of a four-way mega-cap report cluster the same evening. The whole tape pivots on those four prints together, not on Microsoft alone.
Where The Stock Sits
Microsoft closed Friday at 424.62 inside the broader tech bid that took XLK plus 2.81 percent and the Nasdaq 100 plus 1.95 percent. The chart prints a clean upward leg into the close, with price sitting well above the rising structure that has carried the move since the start of April. Structure sits behind price. Directional bias on the chart reads long.
The trickier read is range location. The stock is at the top of its twenty-day range and near the upper edge of its fifty-day range. Overhead supply sits in the 437 to 450 zone from prior session work, which is exactly where the call open interest is stacked. The market structure says long. The location says exposed. Both are true at the same time.
Pre-Earnings Positioning And Implied Move
Friday’s chain is loud and one-sided. Put-call volume ratio at 0.36, put-call open-interest ratio at 0.38. Calls dominate by roughly 2.5 to 1. Call volume of 118,797 against put volume of 42,323 is the directional tell. The crowd wants long exposure into the print.
| Type | Strike | Volume | V/OI | Read |
|---|---|---|---|---|
| Call | 425.00 | 20,207 | 5.10 | ATM call buying ahead of print |
| Call | 420.00 | 19,299 | 3.31 | In-the-money call accumulation |
| Put | 417.50 | 5,932 | 11.72 | At-spot earnings hedge |
| Put | 420.00 | 7,366 | 4.39 | Hedge against the long flow |
Top call open interest sits at 437.50, then 450, 430 and 420. Top put open interest sits at 410, 385, 420 and 400. The 437.50 call wall is the first magnet on a beat-and-raise. The 410 put cluster is where the dealer pin lives if the print disappoints.
The 27 April weekly straddle prices a 1.62 percent move, roughly 6.90 dollars, with bounds at 417.72 and 431.52. That is the sleepy number. The implied move that matters is the post-earnings move priced into the May chain, where ATM IV runs at 29.3 percent and OTM put IV runs at 172.5 percent. A 143-point put-call IV skew with calls cheap and puts expensive is the option market saying: the upside is plausible, the downside is the one we are willing to pay real premium to insure.
Volume says calls. Skew says puts. Both can be true at once. Directional flow leans long because that is the path of least resistance for the trend. Premium is priced for fear because that is the path that breaks the most books. Conviction with insurance, copied straight off the desk.
Dark Pool Flow?”>Dark pool flow Friday added 179 orders for 1.11 billion dollars of MSFT block buying. Concentrated single-counterparty work. Classic pre-earnings accumulation in a name with a binary event landing inside the week.
Three Levels That Decide The Week
Support: 417 to 418. The 417.50 put took 11.72 times its open interest in a single session. Same level the rising structure on the chart sits at. A daily close below 417 breaks the structural long bias and forces a rotation into the 410 magnet.
Decision: 425. Friday’s close, and the strike that took 20,207 call contracts on the day. This is the pivot for everything intraday. Above it, the breakout extends and the 437.50 call wall becomes the next magnet. Below it, the chain pulls toward 412.50 max pain and the 410 put cluster.
Resistance: 437.50 to 450. The 437.50 call wall holds 7,739 contracts of OI. The 450 wall holds 6,048. A clean print Wednesday with raised forward outlook drags price through 437.50 and opens 450 by Friday. Anything that fails at 437.50 prints the rejection candle.
Trade One. Pre-Print Volatility Long
MSFT 425 Long Straddle, 1 May Expiry
Risk score: around 60 percent
Entry: Buy the 425 call and the 425 put for the 1 May expiry on Monday or Tuesday before the print. Size so total premium is around 1 to 1.5 percent of account. Target one: any move outside the 417.72 to 431.52 weekly band. Target two: a print-driven 4 to 6 percent move (Microsoft’s typical post-earnings range) lands one leg deep in the money. Risk to reward: roughly 1:2 on a one-sigma move, 1:4 on two-sigma. Why it works: the weekly is mispriced relative to the post-earnings IV the May chain is pricing. The structure takes the side of volatility, not direction, and lets the binary print do the work. Kill condition: close on Tuesday afternoon if pre-print IV crush exceeds the move thesis.
Trade Two. Directional Long Aligned With The Flow
Continuation Long: Buy 418 to 420 With Mandatory Hedge
Risk score: around 55 percent
Entry: 418 to 420 on a controlled pullback into support. Stop: 416.50 (below the dealer pin and the 417 shelf). Target one: 430 (prior intraday resistance and the 430 call OI cluster). Target two: 437.50 (the call wall). Risk to reward: roughly 1:2.7 to first target, 1:5 to second. Why it works: directional flow is heavily call-skewed at 0.36 P/C ratio, dark pool desks added 1.11 billion of pre-print blocks Friday, and the structural read on the chart is long. Mandatory hedge: pair the equity with a 5 to 7 percent out-of-money put for the 1 May expiry to copy the institutional structure. The premium is the cost of staying in the trade through Wednesday night. Kill condition: daily close below 416.50, or a flip in call-volume bias before the print.
Time Horizons
Intraday (zero to one day): 425 pivot dominates. Above it, path of least resistance points to 430. Below it, magnet pulls to 420 then 417. Most of Monday’s range sits between 421 and 428.
Swing (two to ten days): the print lands Wednesday after the close. Binary at the name level and at the cluster level, because three other mega-caps print the same evening. A clean sweep takes price through 437.50 toward 450. A miss with cautious guidance opens the 410 magnet and pulls the cluster down. Resolves between Wednesday after-hours and Thursday open.
Positional (two to eight weeks): the multi-month uptrend is intact. A monthly close above 437.50 confirms the next leg with a measured target near 460. A monthly close below 410 invalidates the positional uptrend and resets bias toward the 385 put-OI shelf.
Risk Score
Name risk score: around 70 percent (elevated, Wednesday AMC).
- Plus 25 percent for a binary earnings print Wednesday after the close
- Plus 15 percent for the cluster effect of three other mega-cap prints the same evening (cross-name correlation breaks both ways)
- Plus 15 percent for a 143-point put-call IV skew (puts paying real premium even with call-volume dominance)
- Plus 10 percent for individual investor bullishness jumping 14.3 points to a ten-week high (contrarian flag bleeding into mega-caps)
- Plus 10 percent for the stock at the top of its twenty-day range, exposed to mean reversion
- Minus 5 percent because directional flow and dark pool accumulation lean the same direction (long)
Binary-event week with cluster correlation, not a trend-extension week. Hedge legs non-negotiable on the directional setup. The volatility long sidesteps direction entirely and is the cleanest expression.
The Catalyst That Owns The Week
Microsoft prints Wednesday after the close, the first of four mega-cap reports landing the same evening. The whole tape pivots on those four together, not on Microsoft alone. A clean sweep with sustained capex guidance pushes Microsoft toward 437.50 to 450 by Friday. A guidance reset on any one of the four reverses the read for the cluster and opens 410 as the downside magnet on Microsoft.
The tape going in is call-skewed in directional flow, expensively hedged on the put side, and accumulating in the dark pool layer. Conviction with insurance. The job between now and Tuesday’s open is not to predict the print. The job is to be sized correctly for either outcome and let the levels decide entry. The chain has done the planning. Trade the levels.
What We Called vs What Happened
Scoring the Wednesday 22 April read against Friday 26 April close at 424.62.
| Call (22 Apr) | Outcome (by 26 Apr) | Verdict |
|---|---|---|
| Long with high conviction, three-day institutional campaign extends | Campaign stalled. Microsoft slipped from 432.92 to 424.62 over the window, minus 1.92%. Buying paused into the print | Partially |
| Target $445 measured move | Not tagged. Highest print stayed inside the 437.50 call wall. Target remains open into the Wednesday print | Missed |
| Entry zone $425 to $428 on pullback | Pullback landed inside the zone. Friday close at 424.62 sits at the lower edge of the entry band | Confirmed |
| Stop below $415 invalidates | Stop never tested. Lowest print held above 420 structural support throughout | Confirmed |
| Resistance $438 first test on continuation | Not reached. Price faded before the wall, leaving 437.50 still above as the next decision strike | Missed |
Track record: two of five calls confirmed over the four-session window. The campaign cooled into earnings as institutional buying paused for hedges instead of extending. The structural floor held cleanly. The Wednesday print is now the resolution catalyst.
This is analysis, not financial advice. Always manage your risk.
Thursday 23 Apr 2026
Daily Framework Read | Thursday 23 April 2026 | Published 22:00 London / 17:00 New York / 07:00 Tokyo
Tesla $373.72 -3.56%
Tesla dropped 3.5% in a heavy selloff that outpaced the broader index decline. The stock continues to show elevated volatility relative to peers. Today’s decline wiped out most of this week’s gains. TSLA remains a high-beta name that amplifies every market move, and today was no exception.
Framework Read
| Layer | Reading | Interpretation |
|---|---|---|
| Direction | NEUTRAL | Volatile. No clear directional edge |
| Structure | Choppy | No clean trend. Whipsaw price action |
| Momentum | Bearish short-term | 3.5% decline is momentum negative |
| Flow | Speculative | Retail and options-driven. Not institutional conviction |
| Evidence | Neutral. High volatility | Trade with small size or avoid |
Yesterday vs Today
Yesterday TSLA rallied. Today it dropped 3.5%. This whipsaw pattern has defined TSLA for weeks. The stock moves 3-5% in either direction on any given day. That makes trend-following difficult and position sizing critical. The volatility is the defining characteristic.
The Read
TSLA at $373 is in the middle of a wide range. The robotaxi narrative, energy storage growth, and automotive margin concerns all pull in different directions. The stock trades more on sentiment than fundamentals in the short term. For swing traders, the levels are $360 support and $400 resistance. For investors, it is a conviction trade that requires tolerance for 3-5% daily swings.
The call: neutral. No directional bias. If you trade TSLA, size small and use wider stops. $360 support, $400 resistance.
Key Levels
| Level | Price | Significance |
|---|---|---|
| Resistance 2 | $420.00 | Major resistance |
| Resistance 1 | $400.00 | Psychological and range high |
| Current | $373.72 | Mid-range after selloff |
| Support 1 | $360.00 | Range low support |
| Support 2 | $345.00 | Breakdown level |
| Support 3 | $330.00 | Deep support |
What We Called vs What Happened
The framework flagged TSLA as volatile and difficult to trade directionally. Today’s 3.5% decline confirms that assessment. The stock continues to defy clean trend-following approaches.
Risk Assessment
Domain risk: Around 60% (elevated)
TSLA risk is inherently elevated due to its volatility profile. 3-5% daily moves are routine. Position sizing must account for this. The stock is not for conservative accounts.
Bottom line: TSLA dropped 3.5% in another volatile session. No directional edge. The stock whipsaws between $360-400. Size small, use wider stops, or avoid. Volatility is the feature, not the bug.
Cross-reference: Today’s Sectors Report for tech rotation analysis.
This is analysis, not financial advice. Always manage your risk.
Thursday 23 Apr 2026
Daily Framework Read | Wednesday 22 April 2026 | Published 22:00 London / 17:00 New York / 07:00 Tokyo
Tesla $387.51 +0.28%
Tesla barely moved. A 0.28% gain on a day when the rest of the mega-caps rallied 1-2.5% tells you everything. The framework says NEUTRAL. Tesla is digesting its recent earnings and the market has not yet decided what to do with the numbers. The lack of participation in today’s rally is a warning sign, not a buy signal. When the tide lifts all boats except one, there is a reason that boat is not moving.
Framework Read
| Layer | Reading | Interpretation |
|---|---|---|
| Direction | NEUTRAL | Post-earnings digestion. Lagging the group. No edge |
| Structure | Flat, digesting | Sideways consolidation after earnings. No trend, no direction |
| Momentum | Dead flat | Zero momentum. The market is waiting for the next catalyst |
| Flow | Balanced | Neither accumulation nor distribution visible. The market is undecided |
| Evidence | Neutral | No edge. Post-earnings digestion with no clear resolution yet |
Yesterday vs Today
Yesterday Tesla was flat. Today it was flat again. Two days of zero participation while the rest of the market rallied hard. The earnings report created a decision point and the market has not decided yet. That indecision is not bullish, especially when every other mega-cap is moving higher. Relative underperformance during a rally is a yellow flag.
The Read
Tesla after earnings is a different animal. The numbers are out, the market is processing them, and until that processing is complete, the stock goes nowhere. The relative underperformance today is concerning because it suggests the earnings did not inspire enough confidence for institutions to add. They are not selling aggressively either, which is why it is neutral rather than bearish.
The call: no trade. The evidence is neutral, the momentum is dead, and the relative performance is weak. Wait for Tesla to either join the rally or show its hand to the downside. Forcing a trade here is gambling, not trading.
Key Levels
| Level | Price | Significance |
|---|---|---|
| Resistance | $400.00 | Psychological round number. Break above signals digestion is over |
| Current Range | $380-395 | Post-earnings consolidation zone. Stuck here |
| Support 1 | $375.00 | Range floor. Must hold for neutral to stay neutral |
| Support 2 | $360.00 | Break below signals post-earnings selling. Picture turns bearish |
What We Called vs What Happened
The framework has been neutral on Tesla since earnings and that call remains correct. The stock is not participating in the rally and the evidence is split. No trade was the right call and it continues to be the right call.
Risk Assessment
Domain risk: Around 55% (moderate-elevated)
Post-earnings digestion is unpredictable. The stock could break either way on any catalyst. The relative underperformance during a broad rally is a yellow flag that adds to the risk. Trading Tesla here is a coin flip dressed up as analysis. Wait for clarity.
Bottom line: Tesla is neutral. Post-earnings digestion, zero momentum, relative underperformance. No edge. Wait for a break above $400 for longs or below $375 for shorts. Until then, there are better trades on the board. Do not force this one.
Cross-reference: Today’s Positioning Report for mega-cap relative performance data.
This is analysis, not financial advice. Always manage your risk.
Tuesday 21 Apr 2026
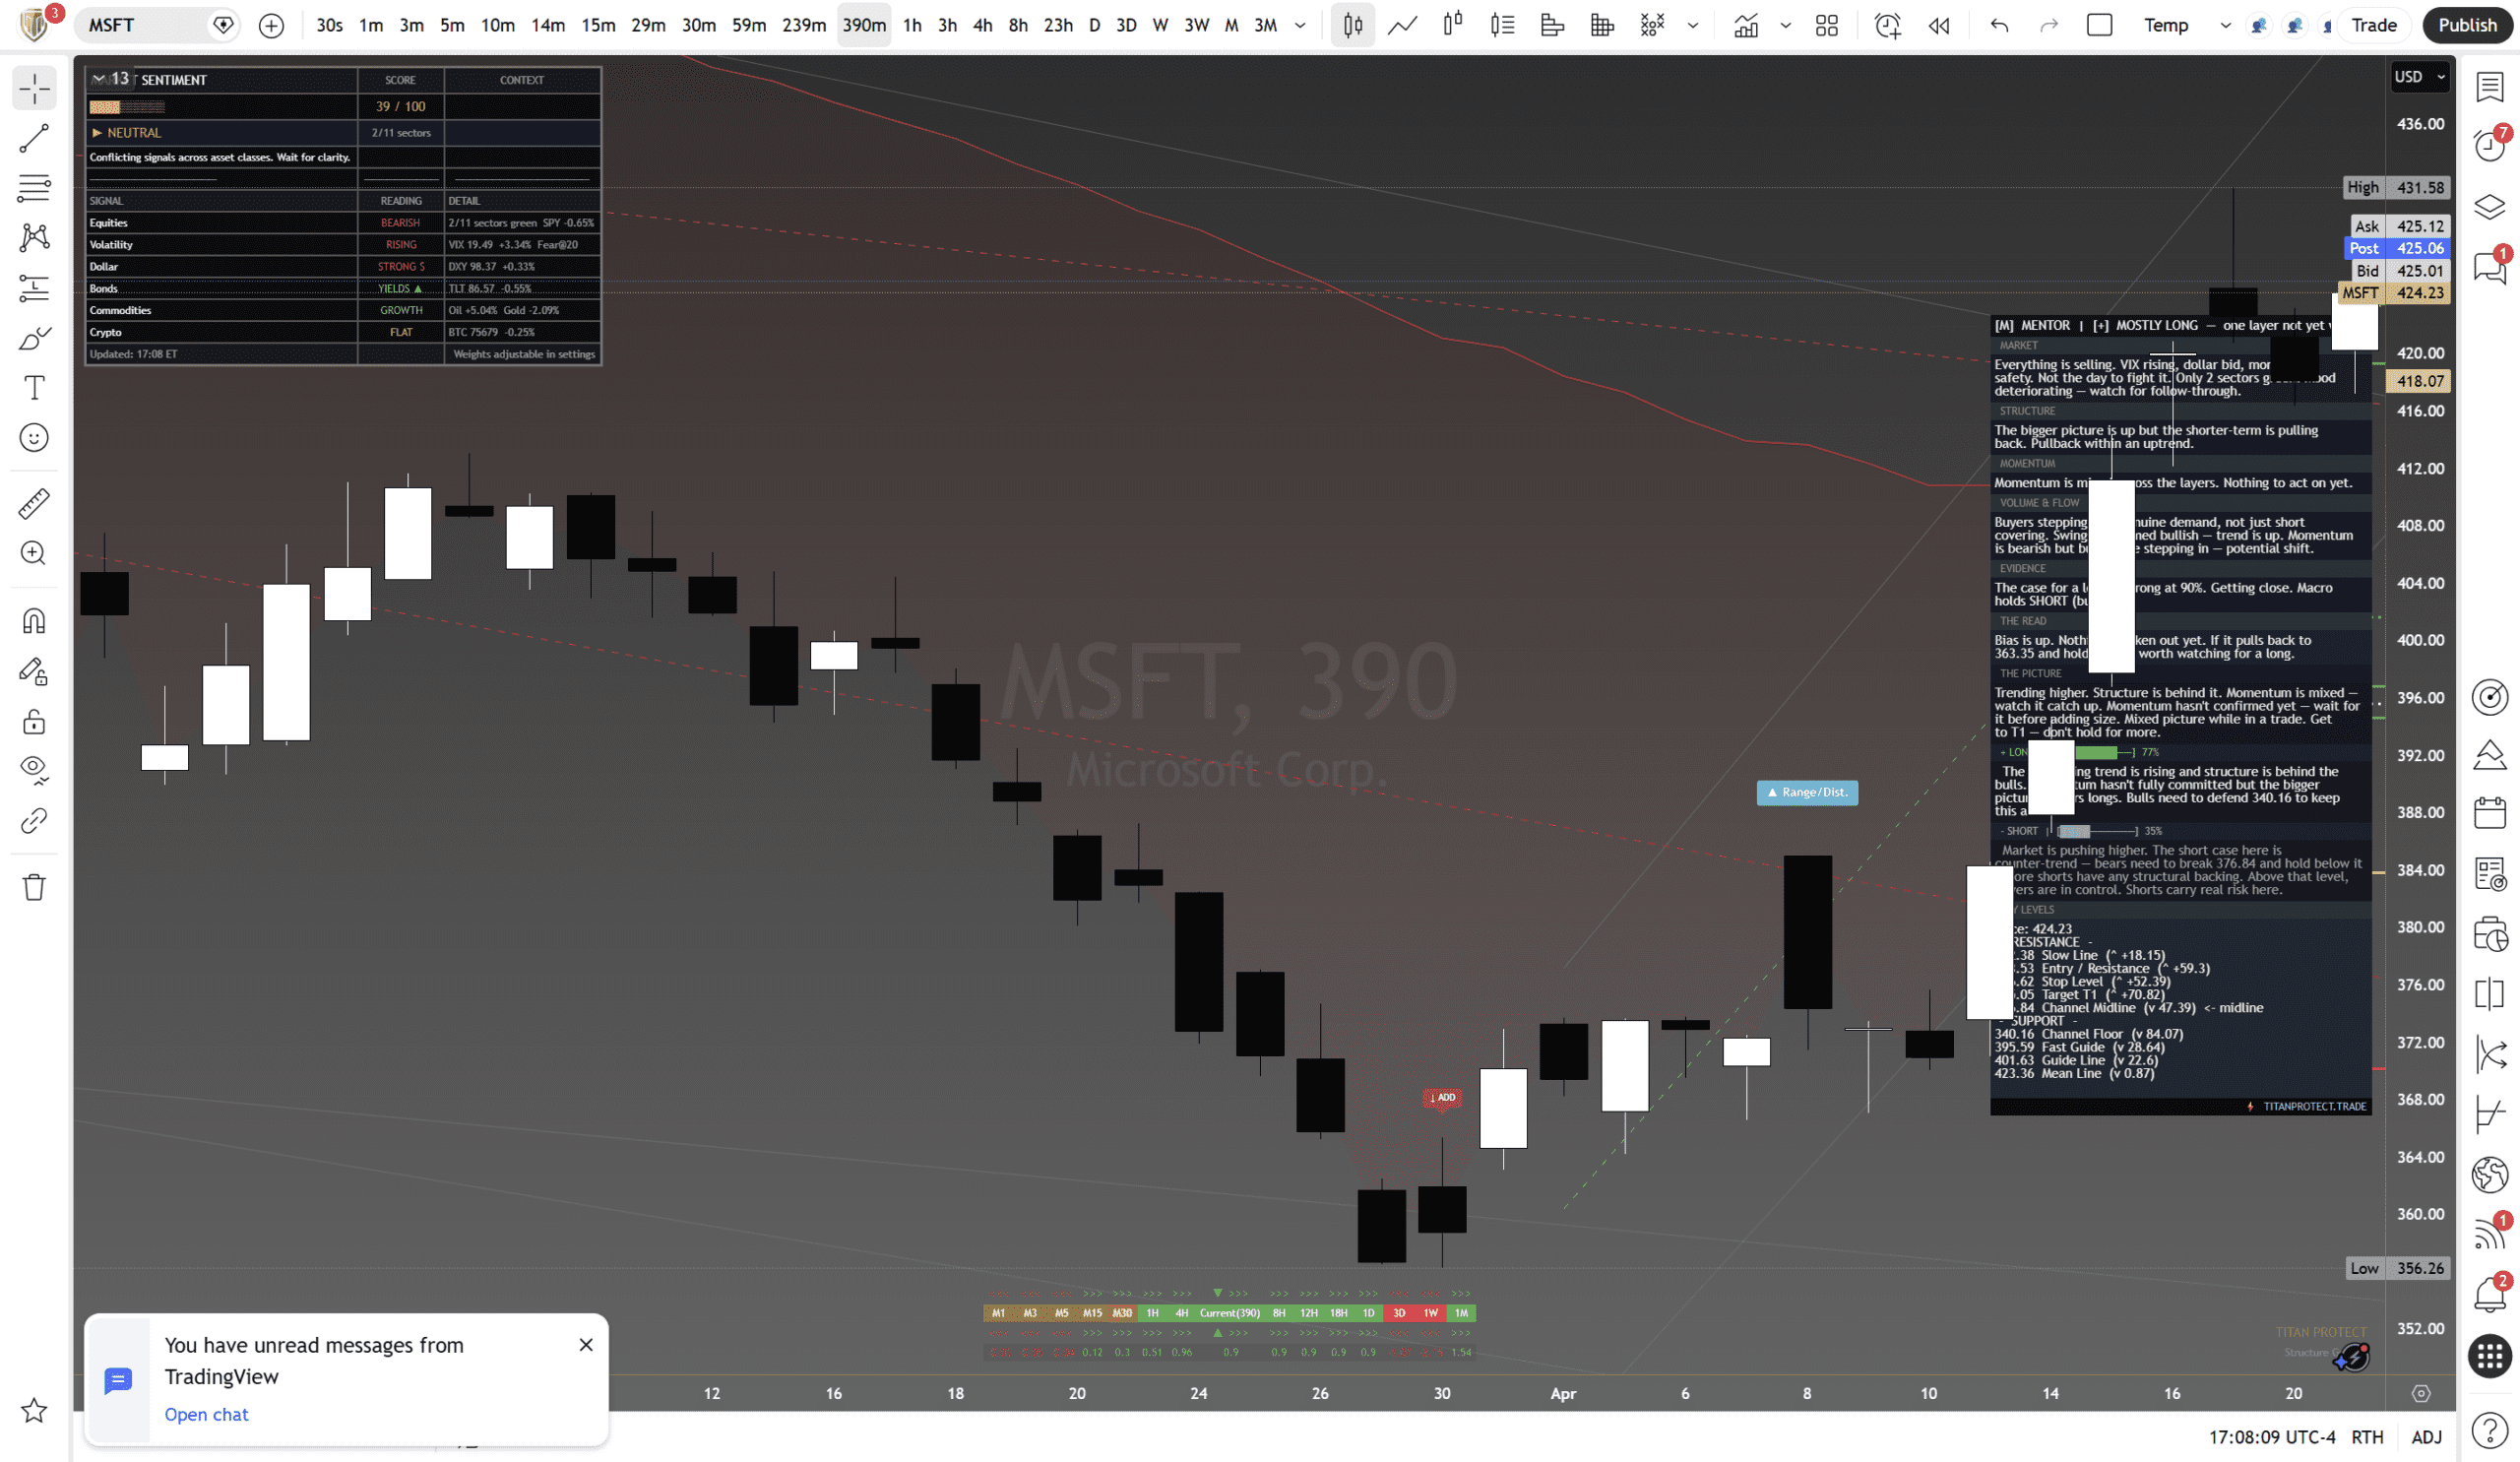
Daily Framework Read | Tuesday 22 April 2026 | Published 22:00 London / 17:00 New York / 07:00 Tokyo
Microsoft closed at $424.23, up 1.46% and the only mega-cap to finish green on a day where everything else sold. That is not luck. That is institutional conviction. The framework reads mostly long with one layer still catching up, and the evidence score sits at 90% for the long case. Buyers are stepping in with genuine demand, not just short covering.
What the Framework Says
| Layer | Reading | Interpretation |
|---|---|---|
| Direction | Mostly Long | 73% long bias / 19% short. One layer not yet confirmed. Close to full commitment |
| Structure | Up, pulling back | Bigger picture is up. Shorter-term pulling back within an uptrend. Pullback is healthy, not threatening |
| Momentum | Mixed | Mixed across the layers. Nothing to act on yet but building |
| Flow | Buyers stepping in | Genuine demand, not just short covering. Swings confirmed bullish. Trend is up. Buyers are stepping in with real money. Potential shift building |
| Evidence | 90% long | The case for a long is strong at 90%. Getting close. Macro holds SHORT (building) |
The Read
Microsoft is the cleanest chart of the five stocks today. Bias is up. Nothing has broken. If it pulls back to $361.35 and holds, that is worth watching for a long entry. The fact that it finished green while everything else was red tells you exactly where institutional money is flowing.
The picture is trending higher. Structure is behind it. Momentum is mixed, which means wait for it to catch up before adding full size. But the flow is the standout: genuine demand with buyers stepping in. This is not hope. This is real capital moving into the name on a risk-off day. That is the strongest signal you can get.
Relative strength confirmed. On a day where VIX crossed 20, the dollar bid hard, and mega-caps like Apple dropped 2.52%, Microsoft gained 1.46%. Institutional block buying from Monday continued into Tuesday. This is the name the smart money wants to own through the volatility.
Key Levels
| Level | Price | Distance | Significance |
|---|---|---|---|
| Ceiling | $442.38 | +$18.15 | Channel ceiling. Measured target if momentum confirms |
| Resistance | ~$483 | +$59.30 | Extended resistance zone. Needs a strong trend to reach |
| Midline | $371.39 | -$52.84 | Channel centre. Deep pullback level |
| Mean Line | $423.36 | -$0.87 | Average price. Trading right at it. This is the institutional fair value zone |
| Guide Line | $401.11 | -$23.12 | Structural support. A pullback here would be a clean entry opportunity |
| Fast Guide | $379.90 | -$44.33 | Dynamic support layer |
| Channel Floor | $346.14 | -$78.09 | Absolute structural floor. Would require a significant macro shock |
Scenario Analysis
| Scenario | Trigger | Implication |
|---|---|---|
| Long case | Momentum confirms above $424, targeting $442.38 ceiling | Cleanest setup of the five. Structure, flow, and evidence all favour longs. Wait for momentum confirmation to go full size |
| Short case | Bears need to break $376.84 and hold below | Counter-trend. Buyers are in control. Above $376, shorts carry real risk. Institutional flow is against shorts here |
| Pullback entry | Dip to $401-$420 range with structure holding | Best risk-reward entry. The mean line at $423.36 is right at current price. Bulls need to defend $340.16 to keep the thesis alive |
Risk Assessment
Domain risk: Around 35% (moderate-low)
Microsoft carries the lowest risk profile of the five stocks today. The framework is 90% long evidence. Institutional buyers confirmed two days running. Price is the only mega-cap green. Momentum is the missing piece, and that is a solvable problem. The environmental risk from VIX and broad selling applies to everything, but MSFT has demonstrated it can ignore that. Relative strength in a weak market is the most reliable signal in equities.
Bottom line: Microsoft is the standout. Mostly long with 90% evidence, genuine institutional buying on a risk-off day, and the only mega-cap in the green. Momentum needs to confirm, but everything else is pointing the same way. If you are going to be long one name through this volatility, the framework says this is the one with the cleanest backing.
This is analysis, not financial advice. Always manage your risk.


