
The Microsoft Framework Journal for May 2026, newest read at the top. Each dated entry is our read on the close, kept as a living record so the framework can be judged over time. This is analysis, not financial advice.
Saturday 30 May 2026
Microsoft (MSFT) — Daily Read | Saturday 30 May 2026
Microsoft (MSFT) | Post Close Setup Daily Read | Data basis: 2026-05-30 close
Where It Sits
Structure
Structurally Microsoft (MSFT) sits above its short-term moving averages with the daily trend firmly higher. The recent advance has been orderly with no signs of distribution or topping behaviour. The reference anchor at 443.43 acts as the bias line.
Momentum
Momentum is firm with the daily timeframe showing clear acceleration. Internal readings sit in the upper portion of the range. The risk is not that momentum fails but that it stalls at round-number resistance and triggers profit-taking.
Volume & Flow
Flow on the session close was measured. Positioning data suggests steady accumulation rather than aggressive directional commitment. The pattern supports continuation rather than reversal.
Key Levels
| Level | Type | Significance | Action Zone |
|---|---|---|---|
| 463.00 | Resistance | Upper range target, prior supply zone | Take profits / fade if rejected |
| 450.00 | Pivot | Mid-range continuation marker | Hold = constructive; lose = consolidation |
| 443.43 | Session close | Reference anchor for next session | Above = continuation; below = mean revert |
| 433.00 | Support | Recent range floor, demand zone | Buy zone with defined stop |
| 420.00 | Major support | Prior breakout retest level | Stop-out below for longs |
Three Scenarios
Continuation
Microsoft (MSFT) holds 443.43 and extends higher on continued sector leadership and institutional rotation. The broader tape supports continuation. Watch for a clean hold above the pivot.
Range
Microsoft (MSFT) opens flat and churns around 443.43. Magnet to the prior close in absence of company-specific catalyst. Range trade.
Mean Reversion
Microsoft (MSFT) fades on sector rotation or company-specific headline, gives back below support. Mean reversion within the broader uptrend.
Risk Score
Risk sits at Around 55%
Risk sits around 55 per cent. Vix at 15.4 supports a measured risk posture. sentiment at 61 is in greed territory. Single-stock positions carry company-specific headline risk. Standard sizing with defined stops — discipline beats conviction.
How to Walk It
Entry / Stop / Target structure:
- Long 433.00 pullback | Stop 420.00 | Target 450.00 | R:R 2:1
- Long 450.00 breakout | Stop 443.43 | Target 463.00 | R:R 1.5:1
- Fade 463.00 rejection | Stop above resistance | Target 443.43 | R:R 2:1
Experience-level guidance:
Beginner: Reduce size to half your standard. Trade only the cleanest setup from the entries above. If the tape opens against your bias, do nothing — wait for the second hour, when the institutional flow has tipped its hand.
Intermediate: Use the levels table to define the trading range. Fade the extremes with defined stops, take profits before the round-number resistance levels.
Advanced: The vol regime supports defined-risk structures around the key pivot levels. Keep notional small relative to your book — asymmetric speculation, not core positioning.
Continue Reading
The macro frame driving this read is unpacked in the session briefs:
Check the latest session briefs on the site.
This analysis is for educational and informational purposes only. It does not constitute financial advice. Always manage your risk independently and in accordance with your own financial circumstances.
Thursday 28 May 2026
Microsoft (MSFT) — Daily Framework Read | Thursday 28 May 2026
Microsoft (MSFT) | Post Close Setup Daily Read | Data basis: 2026-05-28 close
Where It Sits
Structure
Structurally Microsoft (MSFT) sits above its short-term moving averages with the daily trend firmly higher. The recent advance has been orderly with no signs of distribution or topping behaviour. The reference anchor at 426.99 acts as the bias line.
Momentum
Momentum is firm with the daily timeframe showing clear acceleration. Internal readings sit in the upper portion of the range. The risk is not that momentum fails but that it stalls at round-number resistance and triggers profit-taking.
Volume & Flow
Flow on the session close was measured. Positioning data suggests steady accumulation rather than aggressive directional commitment. The pattern supports continuation rather than reversal.
Key Levels
| Level | Type | Significance | Action Zone |
|---|---|---|---|
| 452.00 | Resistance | Upper range target, prior supply zone | Take profits / fade if rejected |
| 435.00 | Pivot | Mid-range continuation marker | Hold = constructive; lose = consolidation |
| 426.99 | Session close | Reference anchor for next session | Above = continuation; below = mean revert |
| 414.00 | Support | Recent range floor, demand zone | Buy zone with defined stop |
| 397.00 | Major support | Prior breakout retest level | Stop-out below for longs |
Three Scenarios
Continuation
Microsoft (MSFT) holds 426.99 and extends higher on continued sector leadership and institutional rotation. The broader tape supports continuation. Watch for a clean hold above the pivot.
Range
Microsoft (MSFT) opens flat and churns around 426.99. Magnet to the prior close in absence of company-specific catalyst. Range trade.
Mean Reversion
Microsoft (MSFT) fades on sector rotation or company-specific headline, gives back below support. Mean reversion within the broader uptrend.
Risk Score
Risk sits at Around 55%
Risk sits around 55 per cent. Vix at 15.7 supports a measured risk posture. sentiment at 60 is in greed territory. Single-stock positions carry company-specific headline risk. Standard sizing with defined stops — discipline beats conviction.
How to Walk It
Entry / Stop / Target structure:
- Long 414.00 pullback | Stop 397.00 | Target 435.00 | R:R 2:1
- Long 435.00 breakout | Stop 426.99 | Target 452.00 | R:R 1.5:1
- Fade 452.00 rejection | Stop above resistance | Target 426.99 | R:R 2:1
Experience-level guidance:
Beginner: Reduce size to half your standard. Trade only the cleanest setup from the entries above. If the tape opens against your bias, do nothing — wait for the second hour, when the institutional flow has tipped its hand.
Intermediate: Use the levels table to define the trading range. Fade the extremes with defined stops, take profits before the round-number resistance levels.
Advanced: The vol regime supports defined-risk structures around the key pivot levels. Keep notional small relative to your book — asymmetric speculation, not core positioning.
Continue Reading
The macro frame driving this read is unpacked in the session briefs:
Check the latest session briefs on the site.
This analysis is for educational and informational purposes only. It does not constitute financial advice. Always manage your risk independently and in accordance with your own financial circumstances.
Thursday 28 May 2026
Microsoft (MSFT) — Daily Framework Read | Thursday 28 May 2026
Microsoft (MSFT) | Pre Asia Setup Daily Read | Data basis: 2026-05-28 close
Where It Sits
Structure
Structurally Microsoft (MSFT) sits above its short-term moving averages with the daily trend firmly higher. The recent advance has been orderly with no signs of distribution or topping behaviour. The reference anchor at 412.67 acts as the bias line.
Momentum
Momentum is neutral with internal readings near the centre of the range. That is the signature of a market digesting the prior move. The tape needs a fresh catalyst to commit to direction.
Volume & Flow
Volume data is limited for this session. The positioning read is neutral — no obvious skew in either direction. Watch for flow confirmation on the next session.
Key Levels
| Level | Type | Significance | Action Zone |
|---|---|---|---|
| 423.00 | Resistance | Upper range target, prior supply zone | Take profits / fade if rejected |
| 416.00 | Pivot | Mid-range continuation marker | Hold = constructive; lose = consolidation |
| 412.67 | Session close | Reference anchor for next session | Above = continuation; below = mean revert |
| 407.00 | Support | Recent range floor, demand zone | Buy zone with defined stop |
| 401.00 | Major support | Prior breakout retest level | Stop-out below for longs |
Three Scenarios
Continuation
Microsoft (MSFT) holds 412.67 and extends higher on continued sector leadership and institutional rotation. The broader tape supports continuation. Watch for a clean hold above the pivot.
Range
Microsoft (MSFT) opens flat and churns around 412.67. Magnet to the prior close in absence of company-specific catalyst. Range trade.
Mean Reversion
Microsoft (MSFT) fades on sector rotation or company-specific headline, gives back below support. Mean reversion within the broader uptrend.
Risk Score
Risk sits at Around 55%
Risk sits around 55 per cent. Vix at 16.3 supports a measured risk posture. sentiment at 61 is in greed territory. Single-stock positions carry company-specific headline risk. Standard sizing with defined stops — discipline beats conviction.
How to Walk It
Entry / Stop / Target structure:
- Long 407.00 pullback | Stop 401.00 | Target 416.00 | R:R 2:1
- Long 416.00 breakout | Stop 412.67 | Target 423.00 | R:R 1.5:1
- Fade 423.00 rejection | Stop above resistance | Target 412.67 | R:R 2:1
Experience-level guidance:
Beginner: Reduce size to half your standard. Trade only the cleanest setup from the entries above. If the tape opens against your bias, do nothing — wait for the second hour, when the institutional flow has tipped its hand.
Intermediate: Use the levels table to define the trading range. Fade the extremes with defined stops, take profits before the round-number resistance levels.
Advanced: The vol regime supports defined-risk structures around the key pivot levels. Keep notional small relative to your book — asymmetric speculation, not core positioning.
Continue Reading
The macro frame driving this read is unpacked in the session briefs:
Check the latest session briefs on the site.
This analysis is for educational and informational purposes only. It does not constitute financial advice. Always manage your risk independently and in accordance with your own financial circumstances.
Tuesday 26 May 2026
Microsoft (MSFT)
FULLY ALIGNED LONG
Friday Close • 25 May 2026
The Read
Microsoft is the standout name in this week’s read. Every layer of analysis is fully lined up to the long side — channels, momentum, structure, and the broader environment are all pointing the same direction simultaneously. That level of confluence is rare. When you see it, you pay attention. The setup is as clean as it gets for a large-cap name, and the analysis is not flagging anything to be cautious about from a structural perspective. This is a good environment, and Microsoft is the clearest expression of it in this group.
The channels are actively set and fully lined up. The analysis notes that sellers are not taking anything, which is meaningful. When sellers step back and refuse to press their advantage, it is because they do not have one. Buyers are in control. The pullback within this setup is approved, meaning the analysis expects short-term softness as healthy price behaviour rather than any sign of reversal. That approved pullback is the entry opportunity, not a warning. Institutions have been positioning into the broader Mag 7 theme all week, and Microsoft’s clean technical picture makes it one of the easier ones to build a case around.
The one watchpoint is valuation at these levels. Microsoft has re-rated significantly over recent months, and at over $450 the name does not have a lot of margin for disappointment if sentiment turns. But the trend is the trend. The market is telling you the buyers are in charge here. The analysis is confirming that every layer of the picture agrees. Until that changes, the bias is firmly long, the pullback is the location, and the objective sits comfortably above current price.
Key Levels
| Level | Price | Notes |
|---|---|---|
| Entry Zone | $448.00 – $451.00 | Approved pullback into channel support |
| Stop | $443.00 | Below structural base, invalidates setup |
| Target 1 | $470.00 | Next resistance, measured move target |
| R:R | ~2.6:1 | Based on midpoint entry |
Risk Assessment
Around 30%
The lowest risk read in this week’s group. Full alignment across all layers is the highest-conviction configuration the analysis produces. No earnings catalyst this week. No structural cracks visible. The primary risk is a broad market shock that drags everything lower regardless of individual merit, which is always a background factor but is not elevated right now.
Experience Guidance
Microsoft is the textbook clean setup this week. If you are looking for one name where the full picture is working in your favour, this is it. Experienced traders know that full alignment does not mean guaranteed outcome — it means the odds are stacked in your favour more than usual, and you should size that way. Newer traders can use this as a learning template: this is what a high-conviction environment looks like. Wait for the approved pullback into support, enter with a defined stop, and let the structure do the work. Do not overthink it. The setup is already doing the heavy lifting.
This content is for informational and educational purposes only. It does not constitute financial advice or a recommendation to buy or sell any security. Trading financial instruments carries significant risk. Past performance is not indicative of future results. Always conduct your own research and consult a qualified financial adviser before making investment decisions.
Saturday 23 May 2026
Microsoft (MSFT) — Weekend Daily Read
Framework Bias
LONG BIAS
Microsoft is arguably the highest-quality business in the world. The combination of Azure cloud (growing at 30%+ annually), the Office 365/Teams enterprise software ecosystem, LinkedIn, and the Copilot AI integration across the entire product suite creates a revenue diversification profile that no other company can match. The framework is long MSFT with high conviction.
The Azure AI services revenue line is the key growth driver that the market is most focused on. Every quarter, the Azure growth rate and specifically the AI contribution to that growth is the number analysts pick apart most carefully. The recent trend has been strong, with AI services representing an increasing proportion of Azure’s total growth. As long as that trend continues, MSFT has a clear path to higher valuations.
Microsoft’s decision to commit $80 billion to AI infrastructure in fiscal 2026 is both a cost and a future revenue stream. The market is willing to value that spend as investment rather than expense because the track record of Azure monetisation of past infrastructure investments is strong. The ROI on cloud infrastructure is visible within 18-24 months, which is a short payback period by enterprise standards.
Key Levels
| Level Type | Price | Note |
|---|---|---|
| Major Resistance | $490 | Prior all-time high zone and key target |
| Near Resistance | $465 | Near-term ceiling and recent high |
| Current Price | ~$455 | Estimated Friday close |
| Near Support | $440 | Prior week consolidation zone |
| Key Support | $420 | Round number and weekly demand |
| Major Support | $400 | Round number and monthly demand |
Trade Framework
| Scenario | Entry Zone | Stop | Target | R:R |
|---|---|---|---|---|
| Long on Tuesday dip | $443 to $448 | $430 | $470 | approx 1.7:1 |
| Long on $465 break | $466 | $450 | $490 | approx 1.5:1 |
| Short on Azure growth disappointment | $440 break | $452 | $415 | approx 2.1:1 |
Confidence level: around 70%. MSFT and NVDA share the highest framework confidence among individual equities. The business quality, AI positioning, and management execution track record justify the elevated conviction. The 70% cap reflects market-level risk (a broad equity selloff would take MSFT down regardless of its own fundamentals) rather than MSFT-specific doubt.
Weekend Context
The OpenAI relationship — which Microsoft has backed with a $13 billion investment and the Azure hosting arrangement — gives MSFT a unique position in the AI ecosystem. Every ChatGPT query runs on Azure. Every enterprise customer using OpenAI’s API through Microsoft is a direct Azure revenue line item. This relationship creates a compounding revenue dynamic as AI usage scales.
The GitHub Copilot product has seen extraordinary adoption among software developers globally. With over 1.5 million paid subscribers and enterprise deals being the primary growth driver, Copilot represents a new recurring revenue stream that did not exist two years ago. The productivity gains for software developers are measurable and real, which is why enterprise purchasing decisions are accelerating rather than slowing.
Microsoft is the safest way to get AI exposure in the large-cap equity space. The business does not depend on AI succeeding in a single specific application; it benefits from AI being useful across many applications because the Azure infrastructure powers them all. That diversification is the defining advantage over more concentrated AI plays.
Friday 22 May 2026
Daily Ticker Read — Friday 22 May 2026
MSFT: Cloud Growth Is Priced, Now What?
Microsoft Corp • $419.09 • -0.47% Thursday close
Current Read
Mild drift lower. Microsoft is not broken, but the cloud and AI growth story that drove the stock higher has been fully absorbed by the market. The next leg up requires a new catalyst, and there is not one on the immediate horizon. Friday is likely a holding session in the $415-422 range unless macro conditions shift sharply.
What Changed
Microsoft’s most recent earnings showed strong Azure growth numbers and continued momentum in its AI integration across the Office 365 suite. The market rewarded that print, and the stock moved accordingly. Since then, there has been a grinding, gradual give-back as the post-earnings premium fades.
This is a common pattern for large-cap technology after a strong quarter. The stock prices in the growth, the next catalyst is a quarter away, and in the interim it drifts without a clear direction. The -0.47% Thursday move is consistent with that picture: not a conviction sell, just gravity pulling back toward fair value.
MSFT is also being used alongside AAPL as a rotation destination for capital coming out of semis. That gives it some support from the buy side. However, the rotation bid is not strong enough to push MSFT to new highs on its own. It is a floor, not a catalyst.
Key Levels
Long Entry
$412-415
Support cluster
Stop
$408
Below structure
Target
$424-428
Prior week range high
Note
The $415 level has served as intraday support on multiple sessions this week. A break of it on volume would be worth paying attention to. Above $424, the next reference is $430 and the prior high zone.
Friday Scenario
Bull Case
Rotation bid continues. MSFT opens steady, finds support at $416-417, and grinds toward $424. Low-drama session that closes near the top of the weekly range. Needs broader tech to cooperate.
Bear Case
The drift accelerates. MSFT breaks below $415, tests $412. If $412 fails, $408 is the next reference. This scenario requires a broader risk-off catalyst, not just MSFT-specific weakness.
Sizing and Approach
MSFT is a lower-volatility name this week. Intraday ranges are tighter than NVDA or TSLA. This means the trade is less exciting but also less punishing if the market moves against you. Position sizing can be slightly larger as a result, assuming you are keeping risk in dollar terms consistent.
The best opportunity on Friday is a dip into $412-415 in the first hour. That is a known support zone with a clear stop below $408. The risk-reward from there to $424 is approximately 2:1 which is workable. Do not chase the current $419 price into a quiet session without a clear directional signal.
Cross-References
AAPL is the companion rotation trade. Both names are absorbing capital from semis. If AAPL holds well on Friday, MSFT should too. If AAPL cracks, that tells you the rotation bid is fading and MSFT will struggle. Watch 10-year Treasury yields as well: rising yields compress the multiple on high-valuation growth stocks and MSFT at these levels is not cheap.
Sunday 17 May 2026
MSFT : Friday 16 May 2026
Ticker Review | Technology | Alpha Insights
Week at a Glance
What Happened
Microsoft held up on Friday. The institutional flow data placed MSFT alongside Apple in the mild accumulation column. Not a priority position like NVDA, but not distribution either. In a session where institutions were actively selling gold, GBP, and silver, mild accumulation in MSFT is a relative positive statement.
Microsoft’s position in the current environment is more resilient than the broad tech picture suggests. The XLK ETF fell as a sector. But Microsoft’s specific revenue mix tells a different story. Azure cloud revenue has lower sensitivity to rate-cycle compression than consumer-facing growth stories. Enterprise software contracts are multi-year. The spending that drives Azure growth is AI infrastructure investment : the same trend that is driving NVDA’s dark pool accumulation.
The rate headwind exists. 4.50%+ yields compress Microsoft’s valuation multiple alongside every tech name. But Microsoft’s earnings quality is different from pure-growth tech. The revenue is recurring, the margins are high, and the cash flow generation supports the valuation more fundamentally than companies relying on future growth promises. The rate headwind is real but more manageable than for high-multiple pure-growth names.
The DXY headwind is the primary external risk. Microsoft generates significant international revenue. Dollar at 99.27 creates the same currency translation compression that hit Deere specifically this week. This is not an acute crisis : it is a manageable quarterly headwind that shows up in reported earnings.
What the Alpha Insights Said
Positioning Read : Mild Accumulation Alongside AAPL
The positioning analysis explicitly listed MSFT in the mild accumulation column alongside AAPL. These are the stable large-cap holdings that institutions maintain during selective accumulation phases. The institutional priority was NVDA for the session at $2.96B. But MSFT and AAPL were held and mildly added to. That is different from distribution. In a session where significant selling occurred in metals and FX, being in the accumulation column even at mild levels signals institutional confidence in the business.
Earnings Echo : Cisco Beat as MSFT AI Read-Through
The earnings analysis documented Cisco beating by $0.06 on AI infrastructure spend. Cisco’s network infrastructure supports cloud growth. When Cisco beats on AI, it validates that hyperscaler demand is real and not slowing. Microsoft’s Azure is a direct beneficiary of the same AI infrastructure spending cycle. The Snowflake earnings next week (Wednesday, cloud data infrastructure) will provide a second read-through for Azure demand specifically.
Sector Flow : Avoid XLK, Use Individual Names
The sector analysis was explicit: avoid XLK ETF, use individual names directly. This applies to MSFT as much as NVDA. XLK blends Microsoft’s recurring revenue stability with distribution-phase growth names and NVDA’s AI premium. The ETF-level signal is AVOID. The individual name signal for MSFT is HOLD. The distinction matters for how you think about tech exposure in your portfolio.
Global Grid : International Revenue Headwind Manageable
The global grid analysis documented that DXY at 99.27 creates currency translation headwinds for companies with significant international revenue. MSFT generates roughly 45-50% internationally. Less exposure than Apple’s 55-60%. The headwind is real but at the lower end of large-cap tech exposure. The Azure international growth story also partially offsets the translation headwind through volume growth in international cloud spend.
Key Factors
| Factor | Reading | Impact |
|---|---|---|
| Azure / AI Cycle | Structural positive | AI infrastructure spend is described as non-discretionary. Partially rate-immune. |
| Rate Sensitivity | Moderate | 4.50%+ compresses multiple. Less acute than TSLA or pure-growth names. |
| Dark Pool Signal | Mild accumulation | Institutional confidence present. Not a priority but not distribution. |
| DXY Impact | Moderate headwind | ~45-50% international. Less exposure than AAPL. Manageable quarterly drag. |
| Earnings Quality | Strong | Recurring revenue, high margins, strong cash flow. Fundamental support for valuation. |
Signal + Bias
Microsoft is a quality hold. The Azure AI tailwind provides a structural positive that is partially independent of rate cycle. Hold existing positions. New capital should prioritise crude (MAX) and NVDA (STANDARD) first.
The distinction between MSFT and TSLA in this environment is clear. MSFT has mild institutional accumulation behind it and recurring revenue with AI infrastructure exposure. TSLA has no dark pool signal, high-beta characteristics, and direct exposure to rate-sensitive auto financing. Same broad sector label (technology/consumer). Very different risk profile.
If you hold MSFT, stay. The macro environment is not pointing at distribution. If you do not hold MSFT, there is no urgency to enter. The stronger signal trades have clearer entry points this week.
Next Week Setup
Snowflake reports on Wednesday 21 May alongside the FOMC minutes. Snowflake’s cloud data infrastructure results will provide a direct read on Azure and AI-driven cloud demand. Strong Snowflake guidance validates the thesis that AI data infrastructure spending is durable. Weak Snowflake guidance creates uncertainty around Azure’s growth trajectory.
FOMC minutes at 14:00 ET Wednesday are the primary macro event. Hawkish minutes extend the rate headwind on MSFT’s valuation multiple. Hawkish-hold (rates stable, growth validated) is the best case for MSFT : validates the enterprise spending environment without adding further compression to the multiple.
The DXY level is the secondary watch. If DXY breaks below 98.80, international revenue headwinds lift across all large-cap tech. MSFT benefits alongside Apple. If DXY accelerates toward 100, currency translation drag accumulates for the next earnings report.
Three Scenarios for MSFT Next Week
Snowflake beats. FOMC hawkish-hold. NVDA gate passes. MSFT benefits as AI infrastructure cycle gets confirmed across multiple data points. Consider adding to position.
MSFT trades flat to slightly lower as broad market waits for FOMC resolution. Hold position. No action required. Snowflake Wednesday provides directional clarity on Azure.
10Y toward 4.65%. FOMC explicitly hawkish. MSFT valuation faces renewed compression. Reduce position to lighten exposure ahead of next earnings cycle. Maintain reduced position for Azure cycle.
Risk Score
Why around 40%: The mild accumulation signal and Azure AI structural tailwind are genuine positives. Recurring revenue and strong cash flow provide fundamental support. The risks are manageable rather than acute: moderate rate compression on the multiple, moderate DXY currency headwind on international revenues. This is not a distressed position. It is a quality hold with macro headwinds that resolve on the Wednesday FOMC read. Lower risk score than TSLA and ETH because the fundamentals have more support.
Alpha Insights : Friday 16 May 2026. For informational purposes only. Not financial advice. All trading involves risk of loss.
Friday 15 May 2026
Microsoft (MSFT) — Daily Read | Friday 15 May 2026
Friday close | MSFT ~$401 est | Steady institutional name pulled down with the tape | Not financial advice
WHAT CHANGED FROM YESTERDAY
Yesterday MSFT was at $407.45 (+0.55%) — a measured, steady participant in the CPI rally. The read identified MSFT as the “institutional quality participation” name: it moves with the market but rarely leads or lags aggressively. Today that steady character holds in the other direction. With QQQ down 1.51% and NVDA down 4.42%, MSFT is estimated down 1.2-1.5% to around $401-402, tracking closely with the broader index rather than amplifying the move. The institutional anchor characteristic observed on Thursday is consistent on Friday. MSFT does not crash — it corrects proportionally. That is its character.
HEADLINE STATE: STEADY LOWER — MSFT ~-1.2% to -1.5% est, In Line with QQQ
$401-402 estimated close. MSFT moved from the “steady participant” in the rally to the “steady participant” in the sell-off. The AI infrastructure thesis that supports MSFT at this valuation — Azure growth, Copilot integration, OpenAI partnership — does not change on a single Retail Sales print. What changes is the market’s willingness to pay the current multiple. In risk-off sessions, the multiple compresses slightly. MSFT’s beta to QQQ on the downside is roughly 0.9-1.0 — slightly less volatile than the index itself. That is defensive in tech context.
| Name | Thursday | Friday est | Character |
|---|---|---|---|
| MSFT | $407.45 (+0.55%) | ~$401 (-1.2% est) | Steady — in line with QQQ |
| NVDA | +3.9% | -4.42% | High beta — amplified both ways |
| AAPL | -0.15% | ~flat (most defensive) | Defensive anchor |
| MSFT position | Between AAPL and NVDA | Between AAPL and NVDA | Consistent institutional character |
KEY LEVELS INTO NEXT WEEK
- $407.45 — Thursday close, immediate resistance for a recovery next week.
- $401 — estimated Friday close, first reference for Monday.
- $395 — support below. A Monday open below here signals the sell-off has legs into next week for MSFT.
- $385-390 — deeper structural support. Only in view if the broader sell-off extends materially.
OVERWATCH CONTEXT
MSFT sits in the middle of the tech complex in terms of growth premium. It is not as aggressively priced as NVDA, but it is not as defensively positioned as AAPL. The AI infrastructure investment story — Azure capex, Copilot B2B adoption — is a multi-year thesis that does not change on one data point. What changes Friday is the risk appetite to hold the multiple. In a week where the macro narrative shifted from CPI-soft to Retail-Sales-soft, MSFT’s valuation held steady because the AI thesis is not macro-dependent in the same way that NVDA’s semiconductor demand thesis is. The sell-off is an opportunity to understand MSFT’s floor, not a fundamental re-rating.
WHAT TO WATCH NEXT WEEK
- $407 reclaim next week on volume confirms the sell-off was a technical correction, not a fundamental re-rate.
- Azure growth commentary from any MSFT speaker next week moves the AI infrastructure thesis directly.
- MSFT vs AAPL relative performance — if MSFT starts outperforming AAPL, the AI bid is returning to the market.
- QQQ recovery or extension determines MSFT’s range next week. At 0.9-1.0 beta to QQQ, MSFT follows the index closely.
Friday 15 May 2026 | Not financial advice. For informational purposes only.
Friday 15 May 2026
Microsoft Corporation (MSFT) — Daily Read | Friday 15 May 2026
Post-CPI close | Rate-cut repricing applies, cloud + AI exposure makes it a NVDA adjacent | Not financial advice
WHAT CHANGED FROM YESTERDAY
Thursday’s read identified MSFT as sitting in the middle of the NVDA vs AAPL spectrum: it has meaningful forward earnings growth (Azure cloud, Copilot AI revenue) but also substantial current period earnings (Office 365, Windows licensing). That positioning meant it would see some rate-cut repricing but not as much as NVDA. Thursday confirmed this: MSFT participated in the QQQ rally alongside the broader tech complex. What the Overwatch added is the insight about the upgrade cycle: when analyst price target revisions start rolling out over the next two to six weeks, MSFT’s cloud and AI segments get repriced alongside NVDA. Microsoft is the second beneficiary of the rate-cut repricing after NVDA because Azure growth rates are the most credible large-cap AI infrastructure story after NVDA itself.
HEADLINE STATE: LONG — NVDA-ADJACENT IN THE UPGRADE CYCLE, AAPL-STABLE IN CURRENT EARNINGS
MSFT at this level has a dual nature that makes it more attractive than either extreme. It is not as rate-sensitive as NVDA (35x multiple with all future earnings) but it is much more rate-sensitive than AAPL (mature, stable business). Azure’s growth trajectory means MSFT has meaningful exposure to the discount rate repricing. At the same time, the Windows and Office 365 subscription base means current-period earnings are robust regardless of the rate environment. You get some of the upside from the rate-cut repricing and a downside cushion from the steady subscription business. That combination is why MSFT is one of the most consistently institutional holdings in any growth-tilted portfolio.
Key Levels
| Level | Price | Significance |
|---|---|---|
| Position post-CPI | Participating in QQQ rally | Rate-cut repricing applies to Azure/AI growth segments |
| Upgrade cycle position | Second in line after NVDA | Azure growth rates get analyst repricing as rate-cut path is processed |
| Downside cushion | Office 365 / Windows base | Subscription revenue is rate-insensitive — provides floor that NVDA lacks |
| Strong RS scenario | Continuation with QQQ | Consumer spending data confirms Q2 demand for enterprise IT spending |
| Rate sensitivity rank | NVDA > MSFT > AAPL | The earnings duration spectrum — MSFT sits in the middle, benefits partially from rate-cut |
| Azure growth watch | Next earnings | Q2 earnings will be the first time the market hears management guidance under the confirmed rate-cut regime |
Structure · Momentum · Flow
Structure
Rising. Confirmed by QQQ participation on Thursday. MSFT is the quality growth hold: it trends rather than spikes, which means its structural moves are more sustained than high-beta names.
Momentum
Positive. MSFT moves steadily rather than violently. The CPI catalyst added momentum without creating an over-extended condition. MSFT is more likely to trend than to spike, which is easier to manage as a position.
Flow
Consistent institutional ownership. MSFT is the most widely held large-cap in institutional portfolios globally. Rate-cut confirmation means portfolios with growth tilts are extending those positions. MSFT benefits in proportion to its weighting.
| Bias | LONG — rate-cut proxy (partial) + subscription floor |
| Risk estimate | Around 20% — one of the lower-risk setups in this read |
| Spectrum position | NVDA (max rate sensitivity) > MSFT (partial) > AAPL (minimal) |
| Next catalyst | Q2 earnings — first guidance under the confirmed rate-cut regime |
| Week carry | Bullish — steady trend higher as upgrade cycle rolls through the analyst community |
This content is for educational and informational purposes only and does not constitute financial advice. Past analysis does not guarantee future results. Always conduct your own research before making any trading decisions.
Thursday 14 May 2026
Microsoft (MSFT) — Daily Read | Thursday 14 May 2026
Post-CPI mid-session | Steady AI infrastructure play in a risk-on session | Not financial advice
NEW TICKER — First Entry in Daily Read Rotation
MSFT is joining the daily read rotation today. No prior ticker to compare against. Context: MSFT is at $407.45 (+0.55%) mid-session. Underperforming QQQ (+0.85%) but solidly in positive territory. Microsoft sits between AAPL (laggard at -0.15%) and NVDA (leader at +3.9%) within the tech complex today. It is a measured, steady participant — consistent with Microsoft’s character as the “institutional quality” tech holding that does not swing as wildly as pure-play AI semiconductor names.
HEADLINE STATE: STEADY LONG — +0.55%, Institutional Quality Participation
Microsoft is not the star today and does not need to be. MSFT at +0.55% on a CPI day is clean participation from one of the largest market-cap companies on the planet. Microsoft’s AI exposure through Azure and Copilot is real — lower inflation supports the cloud spend and AI infrastructure capex thesis. But MSFT moves more carefully than NVDA because it is more mature, more diversified, and more institutionally held. Pension funds and sovereign wealth funds hold MSFT — they do not chase CPI moves. They rebalance quarterly. That is why MSFT +0.55% vs NVDA +3.9% on the same day.
Key Levels
| Level | Price | Significance |
|---|---|---|
| Current price | $407.45 | +0.55% — steady positive participation |
| $400 psychological | $400 | Holding above key level — structural positive |
| vs QQQ | 0.30% underperformance | Slightly lagging the tech ETF — measured participation |
| vs AAPL | +0.70% outperformance | MSFT participating while AAPL does not — clear divergence |
| Tech rank today | Mid-tier | NVDA > TSLA > MSFT > AMD > AAPL within the complex |
Structure · Momentum · Flow
Structure
First read on MSFT structure. Holding above $400 on a risk-on day with positive price action is a constructive base. $400 as support is the key structural level — while it holds, the long bias is intact. $407 sitting above $400 is a healthy structure.
Momentum
Positive and proportionate. MSFT does not make 3-4% intraday moves typically. +0.55% is a solid session for a stock of its size and institutional ownership. Momentum is clean, not exciting — which is appropriate for MSFT.
Flow
Azure cloud and AI Copilot revenue stories are the institutional flow rationale for MSFT. Lower inflation removes cost pressure from enterprise clients, keeping cloud spend intact. Flow is steady and supportive — not explosive, but sustained.
TODAY’S BIAS: LONG — Quality Participant, $400 Is the Floor to Watch
MSFT is the steady institutional trade within the tech complex. Not exciting, not the leader, but participating correctly and holding above key levels. The long bias is intact while $400 holds. If you want tech exposure with less volatility than NVDA or TSLA, MSFT is the quality play. The first clean entry on any pullback to $402-404 would be the disciplined entry zone with $400 as the obvious stop.
Risk: Around 35%
Lowest risk score among the individual tech stocks today. MSFT’s diversification, institutional ownership, and clean $400 structural level make it the most conservative tech long available. The risk is that it underperforms on the upside — but the downside risk is also more contained than NVDA or TSLA.
By Experience Level
New to this
MSFT is what professional investors call a “core holding” — it rarely makes the most exciting move on any given day, but it consistently participates in up moves and holds up better in down moves. Understanding how different stocks have different risk profiles within the same sector is foundational knowledge.
Developing
MSFT outperforming AAPL by 0.70% today despite both being large-cap tech is the MSFT/AI thesis vs AAPL/consumer thesis divergence. This is an ongoing rotation worth tracking. If this gap continues to widen over the next month, it is a meaningful signal about where institutional money sees the better story.
Experienced
MSFT at $407 holding above $400 on a CPI day is a constructive baseline for the position. The key upcoming catalyst for MSFT is the next Azure growth number — that is the single most watched metric for MSFT institutional holders. A strong Azure quarter is worth more to MSFT’s price than any macro event. Keep that in the background when sizing and timing positions.
This is a daily analysis read for educational and informational purposes only. Nothing here is financial advice. Past performance is not a guide to future results. Trading carries significant risk of loss. Always apply your own risk management.
Tuesday 5 May 2026
Microsoft (MSFT) — Daily Framework Read | Tuesday 5 May 2026
Microsoft (MSFT) | Tuesday Open Daily Read | Data basis: Monday 4 May 2026 close
Where It Sits
Yesterday vs Today
| Read | Sunday 3 May | Tuesday 5 May | Direction |
|---|---|---|---|
| Conviction | Constructive continuation | Patient continuation | Slightly softer |
| Structure | Higher highs, higher lows | Higher highs, higher lows | Unchanged |
| Pivot focus | 478 anchor, 490 cap | 412 anchor, 420 cap | Local bracket tighter |
| Volume profile | Patient accumulation | Steady, no urgency | Unchanged |
| Actionable bias | Long pullbacks | Long pullbacks, fade extremes | More two-sided |
The framework’s structural read has not flipped. What has changed is the local bracket. MSFT has tightened into a 14-point range with 412 as the magnet and 420 as the lid. The previous read was happy to lean into continuation at speed. Tuesday’s read prefers patience, defined entries at the bracket edges, and respect for the fact that the easy chase has been priced.
Structure
Structurally MSFT remains in a clear uptrend on daily and weekly timeframes with higher highs and higher lows since the early-April low. The recent action is a controlled consolidation rather than a distribution top. The 412 pivot has been tested twice from above and held, which is the structural tell that the broader trend remains in command.
Momentum
Momentum is positive but cooling. The aggressive thrust phase that ran through April has handed over to an orderly grind. The analysis reads this as healthy. Stocks that pause without giving back the move are doing the constructive thing. The risk is when the pause becomes a sideways drift and bored money rotates out into laggards.
Volume and Flow
Volume on Monday’s session was steady without any institutional fingerprint. Options flow has been balanced, with the put-call profile sitting close to neutral. The pattern is patient holders rather than chasers. That is supportive for continuation if the index tape stays firm, and it removes the sting if the index tape wobbles, since there is less crowded long positioning to unwind.
Key Levels
| Level | Type | Significance | Action Zone |
|---|---|---|---|
| 419.94 | Resistance | Local cap, multiple rejections | Take profits, watch for break |
| 415.50 | Pivot | Intraday rotation level | Hold above tilts continuation |
| 412.05 | Anchor | Monday close, magnet level | Bias line for Tuesday open |
| 405.98 | Support | Recent breakout retest | Long zone with defined stop |
| 398.00 | Major support | Trend support, prior consolidation floor | Stop-out below for longs |
Three Scenarios Into Tuesday Open
Continuation
MSFT opens firm, holds 412, takes 420 cleanly on continued tech leadership. Targets 425 by close. Constructive participation, fits the index trend.
Range
MSFT opens flat, churns 408 to 418 through the session. Magnet to 412. Range trade in absence of company-specific catalyst, fade the extremes.
Mean Reversion
MSFT loses 412 on broad tech weakness, breaks 406, runs to 398. Mean-reversion within the broader trend, not a regime change.
Risk Score
Risk sits at Around 55% heading into Tuesday open.
Risk is moderate, leaning slightly elevated relative to last week’s read. Three factors lift it. First, the local bracket is narrow which means stops and targets are close together and slippage on the open matters more. Second, MSFT depends on the index leadership trade staying intact, and the index has stopped chasing. Third, MSFT is approaching the upper end of a multi-test resistance, and failed breaks at multi-test levels punish chasers harder than first-touch levels do.
How to Walk It
Entry, stop, and target structure:
- Long 406 to 408 pullback | Stop 404 | Target 418 | R:R 3.5:1
- Long 420 break and hold | Stop 416 | Target 425 | R:R 1.3:1
- Short 420 rejection | Stop 422 | Target 412 | R:R 4:1
Experience-level guidance:
Beginner: The Tuesday open inside a tight bracket is exactly the situation where a half-decent setup can lose you money on noise alone. Reduce size to half your standard. Trade only the cleanest of the three setups above. If price opens in the middle of the range, do nothing. Wait for the bracket edge.
Intermediate: Use the bracket edges as your trade triggers and the levels table to define your invalidation. Fade 420 if it rejects on the first touch, buy 406 if it taps and holds. Do not carry directional positions through the close if the day’s setup has not paid you by lunch.
Advanced: The vol regime supports defined-risk options structures around 412 and 420. The asymmetry sits in the short-leaning side at the resistance, and the long-leaning side on a deeper retest. Keep notional small, this is a tactical bracket trade not a position trade.
Continue Reading
The macro frame and index leadership backdrop driving this read sit in the daily briefs:
This analysis is for educational and informational purposes only. It does not constitute financial advice. Always manage your risk independently and in accordance with your own financial circumstances.
Continue with Titan Protect
Twenty-plus instruments. One framework.
We read more than twenty instruments daily across four sessions. The framework’s sunrise call landed across the day — the Pre-NY case study shows what the lines drew, what New York did, and where the read stands.
Core
£59/mo
Indicator suite plus daily framework reads.
Edge Popular
£109/mo
Core plus Shield dashboard and member-only briefs.
Elite
£179/mo
Edge plus weekly 1:1 call and early access to new tools.
Save 15% on annual billing
Want to see the framework in action? Free Explorer tier — no card required.
Join the live community: Discord channel · Shield dashboard
Education, not financial advice. Trade your own analysis.
Sunday 3 May 2026
Microsoft (MSFT) — Daily Framework Read | Sunday 3 May 2026
Microsoft (MSFT) | Monday Open Framework Read | Data basis: Friday 1 May 2026 close
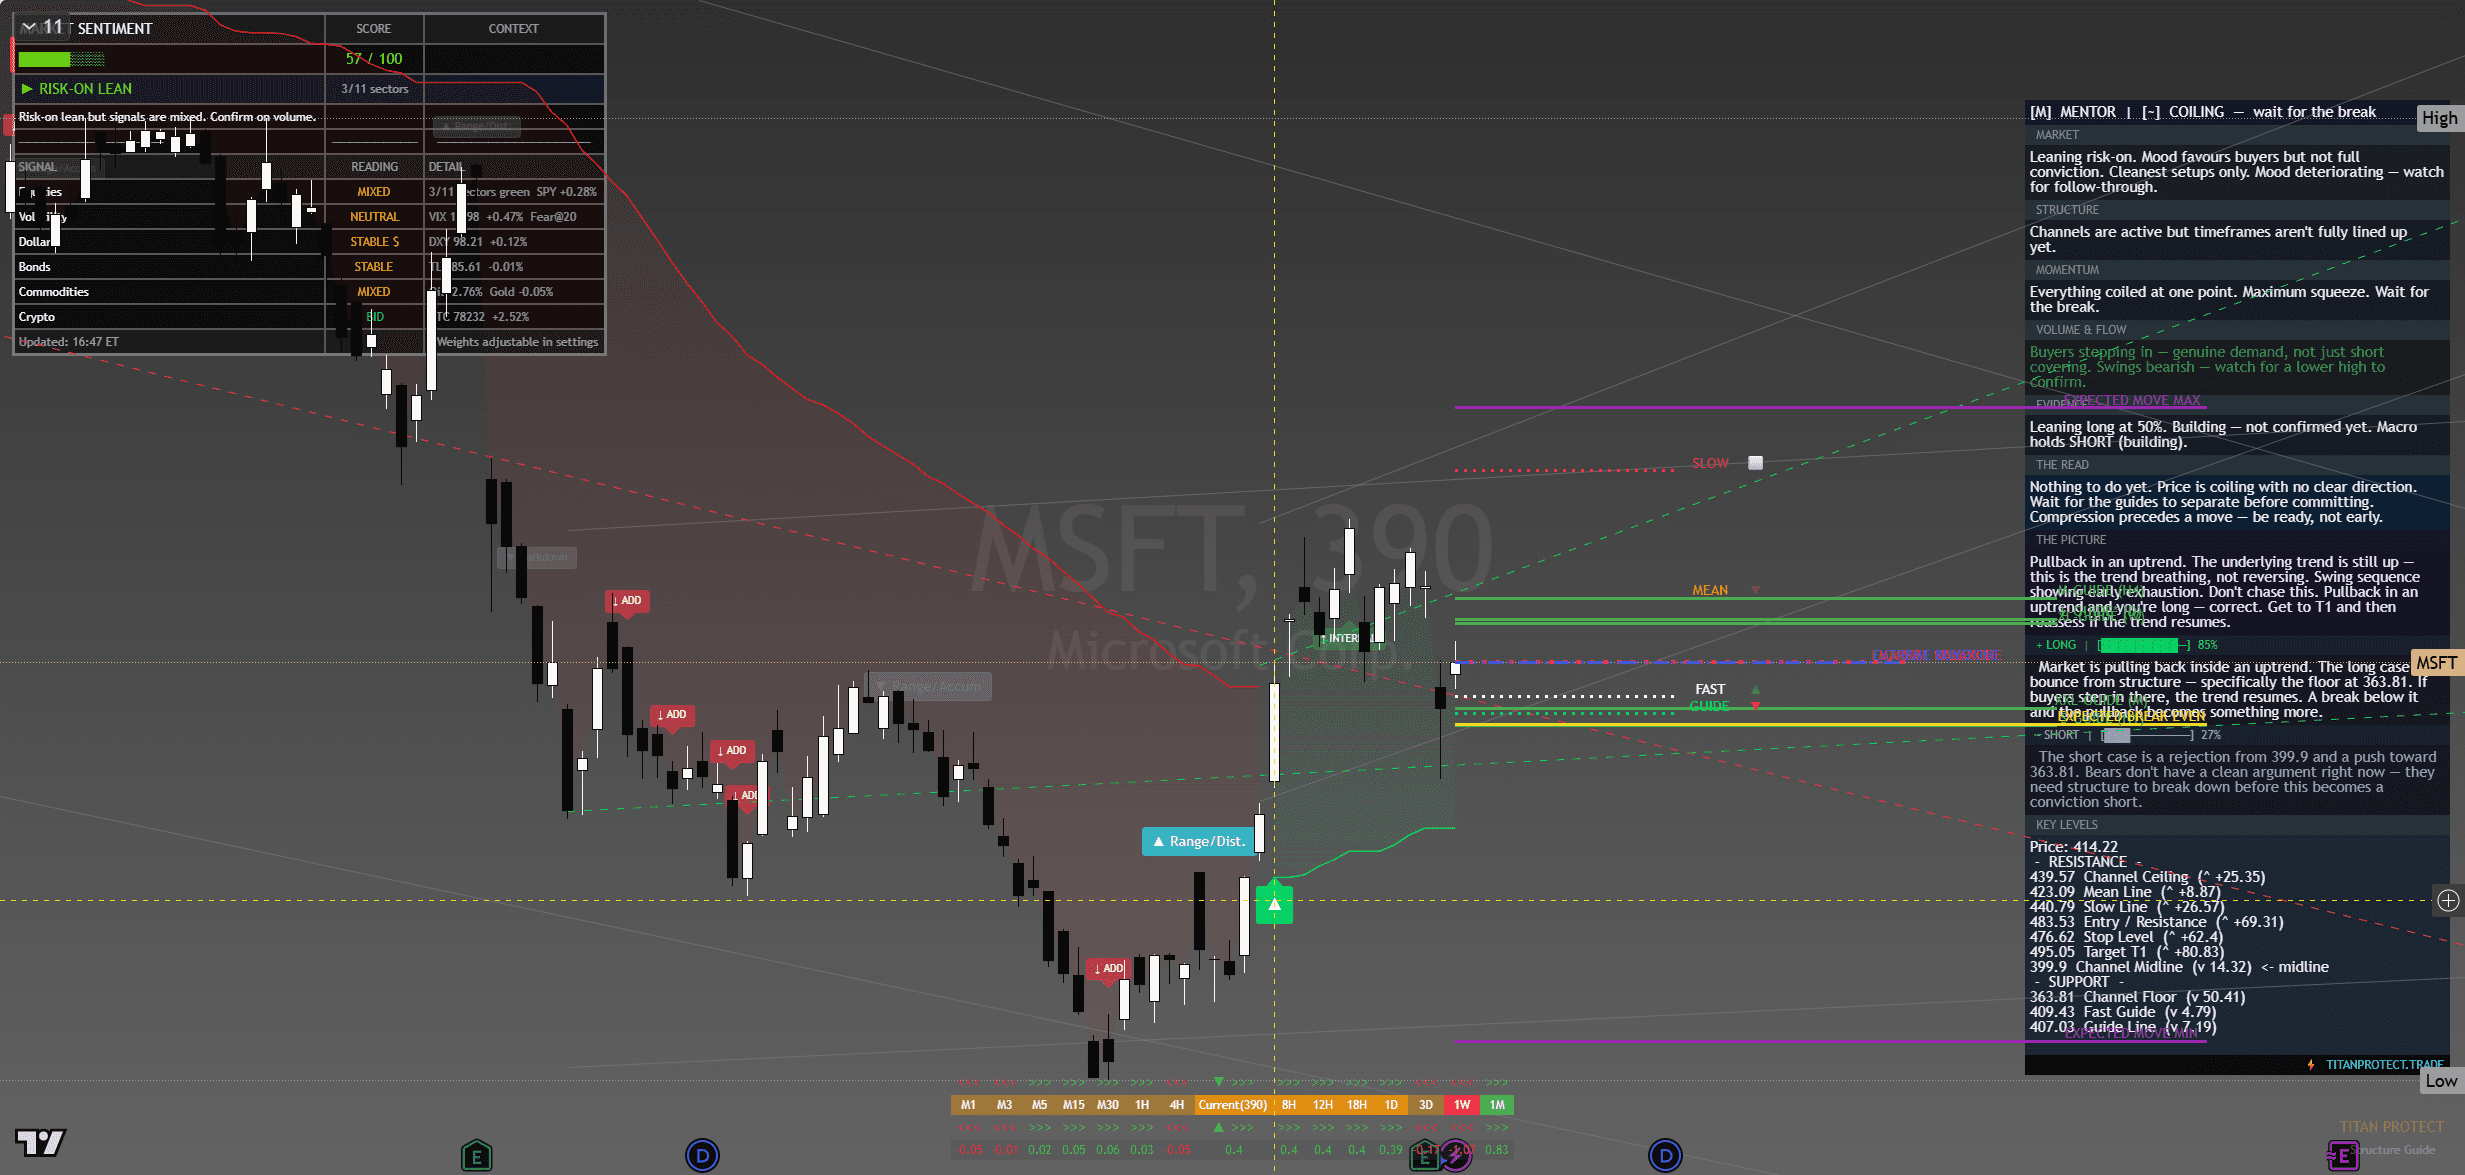
Microsoft (MSFT) — chart with framework overlay. The Lens annotations show structural breaks, reversal triggers and confluence zones at the levels referenced below.
Where It Sits
Structure
Structurally MSFT is in a clear uptrend on daily and 4-hour timeframes with higher highs and higher lows since the early-April low. Friday’s close sits in the upper-middle of the recent range. The structure is healthy.
Momentum
Momentum is positive and steady. MSFT’s recent gains have been orderly without parabolic phases. The momentum profile supports controlled continuation rather than aggressive breakout.
Volume & Flow
MSFT volume on Friday’s close was steady. Options flow has been balanced — neither aggressively bullish nor bearish. The pattern is patient accumulation.
Key Levels
| Level | Type | Significance | Action Zone |
|---|---|---|---|
| 490.00 | Resistance | Round number, recent swing high zone | Take profits if reached |
| 482.00 | Pivot | Recent rejection cluster | Hold above = bullish bias |
| 478.20 | Friday close | Reference anchor | Bias line for Monday open |
| 472.00 | Support | Recent breakout retest level | Buy zone with defined stop |
| 465.00 | Major support | Prior consolidation floor | Stop-out below for longs |
Three Scenarios Into Monday Open
Continuation
MSFT opens firm, holds 478, takes 482 cleanly on continued cloud and AI narrative. Runs to 490 round number by close. Constructive participation in the tech leadership.
Range
MSFT opens flat, churns 474-484 through the session. Magnet to Friday close. Range trade in absence of company-specific catalyst.
Mean Reversion
MSFT fades on cloud-spend narrative softening, breaks 472, runs to 465. Mean-reversion within the broader trend.
Risk Score
Risk sits at Around 50% heading into Monday open.
Risk is moderate. MSFT is the lowest-beta of the mega-cap tech leaders with the steadiest fundamental backdrop. The structure is constructive and the stock tends to participate in tech rallies without leading. The constraint is that the asymmetric trade above 482 has limited room to run before the 490 round-number resistance arrives.
How to Walk It
Entry / Stop / Target structure:
- Long 472.50-474.00 pullback | Stop 470.50 | Target 484.00 | R:R 4:1
- Long 482.50 breakout | Stop 478.00 | Target 490.00 | R:R 1.7:1
- Short 491+ rejection | Stop 494.00 | Target 482.00 | R:R 3:1
Experience-level guidance:
Beginner: The Monday open after a Friday record close is exactly the situation where over-confidence costs money. Reduce size to half your standard. Trade only the cleanest setup from the entries above. If the tape opens against your bias, do nothing — wait for the second hour, when the institutional flow has tipped its hand.
Intermediate: Use the levels table to define the trading range. Fade the extremes with defined stops, take profits before the round-number resistance levels. Do not carry directional positions through the day if you cannot watch the tape — Monday opens are prone to fast reversals.
Advanced: The vol regime is supportive of trending moves. Defined-risk options structures around the key pivot levels capture the asymmetry cleanly. Keep notional small relative to your book — Monday after a record-close week is asymmetric speculation, not core positioning.
The Sunday Composite — How This Read Sits Inside The Cross-Asset View
This single-instrument framework read is one slice of the larger Sunday weekend synthesis. The composite takes positioning, macro, sentiment, volatility, sector dispersion and trade structure as separate analytical layers and arrives at a unified composite verdict for Monday open. Each layer below is unpacked in full.
Read the full composite for the cross-asset context driving this instrument:
The institutional positioning split — Asset Managers vs Leveraged Funds in size
PCE clearance and the macro case for Monday’s carry
The three-layer sentiment disagreement — surface greed, retail neutral, professionals hedged
The vol curve term structure and what VVIX is signalling
Sector dispersion and the breadth problem behind the record close
The Monday position-management playbook — sizing tiers and trade plans
Sunday Overwatch — the unified composite verdict
Continue Reading
The macro frame driving this read is unpacked in the weekend briefs:
Sunday Setup — Reading The Tape Into Monday Open
PCE Cleared, VIX Crushed, SPY Closed 720 — Friday Post-Close Recap
This analysis is for educational and informational purposes only. It does not constitute financial advice. Always manage your risk independently and in accordance with your own financial circumstances.
Continue with Titan Protect
Twenty-plus instruments. One framework.
We read more than twenty instruments daily across four sessions. The framework’s sunrise call landed across the day — the Pre-NY case study shows what the lines drew, what New York did, and where the read stands.
Core
£59/mo
Indicator suite plus daily framework reads.
Edge Popular
£109/mo
Core plus Shield dashboard and member-only briefs.
Elite
£179/mo
Edge plus weekly 1:1 call and early access to new tools.
Save 15% on annual billing
Want to see the framework in action? Free Explorer tier — no card required.
Join the live community: Discord channel · Shield dashboard
Education, not financial advice. Trade your own analysis.


