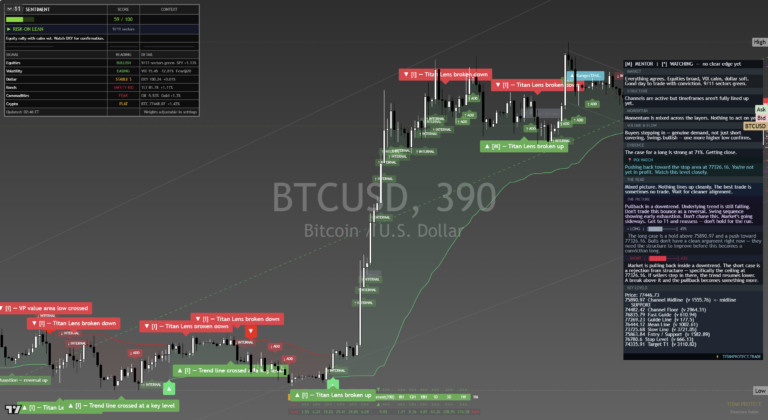
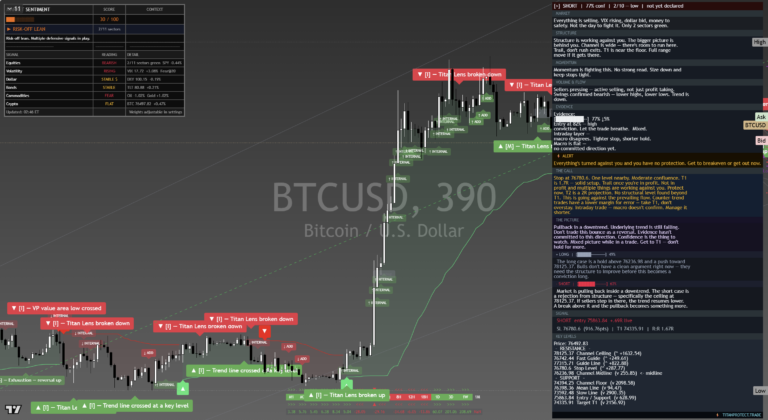
The Bitcoin Framework Journal for April 2026, newest read at the top. Each dated entry is our read on the close, kept as a living record so the framework can be judged over time. This is analysis, not financial advice.
Thursday 30 Apr 2026
Bitcoin at 76,027 — Held 74,800 Through the Mag 7 Carnage, Decoupling Correlation Now 0.54
Bitcoin (BTC/USD) | Daily Framework Read | Thursday 30 April 2026
Bitcoin’s week has told the same story three times now. NAS100 rallied Wednesday and BTC sold it. META and AMZN beat their earnings prints and BTC held. Thursday, with the equity tape fractured — GOOGL up five percent, META down seven percent, AMZN down six percent — BTC sits at 76,027, up 0.33 percent, essentially unchanged while the equity complex is having an identity crisis. This is the decoupling thesis in its purest form. The 30-day rolling BTC-SPX correlation has faded from 0.82 to 0.54, a level last seen in November 2024 before BTC ran from 68,000 to 99,000 in six weeks. The comparison is not a price prediction. It is a regime identification. When BTC finds its own footing independent of equity direction, it is not anchored to the equity catalyst cycle. AAPL tonight and PCE Friday are the two events that define the next 36 hours. BTC’s response to both will tell you whether the decoupling holds or reverts.
Thursday thesis. The structural floor at 74,800 is intact. The decoupling correlation at 0.54 is intact. The spot ETF demand floor is present. None of these conditions have been tested by a genuine equity flush — that test could come if AAPL disappoints tonight or if PCE prints hot tomorrow. The thesis is right until it is not. Know 74,800. Above it, the decoupling narrative is live. Below it, the correlation reverts toward 0.80 and crypto inherits the equity drawdown with leverage.
Where It Sits Today
Current Price
76,027
+0.33% on session
Session Range
75,398 – 76,358
960-dollar intraday swing
BTC-SPX Correlation
0.54
Down from 0.82 one week ago
Key Floor
74,800
Decoupling thesis anchor
The BTC-SPX correlation fade is the most important contextual data point for the Bitcoin read this week. One week ago, BTC was trading as a high-beta equity proxy — a leveraged SPX position with a different time zone. Today, at 0.54 correlation, it is behaving as a separate asset class. The driver of this shift, as the Digital Flow brief identified Wednesday, is spot ETF demand through institutional wrappers creating a structural bid floor that absorbs equity-linked drawdowns. When macro funds sell their equity books, they do not automatically sell BTC through the ETF wrapper — the separate allocation framework insulates the demand.
The November 2024 comparison matters not as a price-level parallel but as a regime parallel. The last time this correlation fell below 0.55, BTC had found its own fundamental footing and was beginning a multi-week move independent of equity direction. The macro environment is different today — rate cut expectations fell to 44% for 2026 after Powell’s hawkish-symmetric hold, versus rising expectations in November 2024. That is the key distinction. Correlation fades in a tightening-bias world produce shorter-duration independence episodes. The November 2024 move lasted six weeks at low correlation. The current episode may be shorter if PCE tomorrow prints warm and the Fed hold looks more entrenched.
What the Framework Reads
The structural framework read on BTC is cautious-neutral on the short term (one to seven days) and constructive on the medium term (one to eight weeks). The 74,800 structural level was established during the late-March washout and has held on every test since. It is the level where the decoupling thesis is still intact and the spot ETF accumulation pace stays positive. Above 74,800, the framework reads BTC as in a consolidation regime with a structural bias to the upside. The 78,200 resistance is the first meaningful test — Wednesday’s session high area that must be reclaimed for momentum to shift from consolidation to trend extension.
The short-term caution comes from the event stack, not from the structural position. AAPL prints tonight with an unknown guidance tone. If AAPL disappoints and the NAS100 falls sharply, the correlation reversion risk rises from background to foreground. The correlation at 0.54 is not a guarantee — it is a reading that can spike toward 0.80 in under an hour on a genuine risk-off event. The structural floor at 74,800 is the line in the sand for whether the decoupling holds or reverts.
On the medium term, the halving supply dynamic, the continued institutional ETF accumulation, and the de-dollarisation narrative that underpins some of the sovereign accumulation interest are all intact. None of these fundamentals changed this week. The macro headwind — a Fed that is holding rates at current levels with no cut cycle in view for 2026 — is real but it has been priced for three months. The market has been running the decoupling thesis alongside the macro headwind, which says the structural demand is outweighing the rate path for the current positioning period.
| Time Horizon | Read | Condition |
|---|---|---|
| Short-term (1–7 days) | Cautious-neutral | AAPL tonight and PCE Friday are event risks. Sit at reduced size through both catalysts. |
| Medium-term (1–8 weeks) | Neutral-to-bullish | Hold 74,800. Decoupling intact. PCE cool would re-rate BTC toward 78,000–82,500. |
| Long-term (2–12 months) | Constructive | Halving dynamic, ETF institutionalisation, and sovereign accumulation narrative intact. Rate path is the macro risk. |
Key Levels
| Level | Price | Role | What Happens at This Level |
|---|---|---|---|
| Momentum resistance | 82,500 | Bull continuation target | PCE cool plus hold of 74,800 plus Mag 7 beats path. Three-condition bull scenario target. |
| Structural resistance | 78,200 | Wednesday high area / must reclaim | Above here: 80,000–82,500 opens on momentum. The first test of the decoupling continuation thesis. |
| Current price | 76,027 | Consolidation zone | Inside the 74,800–78,200 consolidation range. Neutral territory pending catalysts. |
| Decoupling floor | 74,800 | Critical support — decoupling thesis anchor | Hold here = decoupling intact and ETF demand floor present. Break here = correlation reverts toward 0.80, bear path opens. |
| Correlation reversion target 1 | 72,500 | First bear target | Hot PCE plus Mag 7 miss combination path. Only relevant if 74,800 breaks. |
| Structural quarterly support | 70,200 | Full correlation reversion target | Only prints if the correlation reversion is full and sharp. Buyers historically appear here. |
Three Scenarios into AAPL Plus PCE
Bull — 35%
AAPL beats with constructive guidance. PCE cool. Equities hold. BTC breaks 78,200, targets 80,000–82,500. ETH rotation above 2,300 confirms the altcoin recovery is beginning. The decoupling thesis is validated.
Sideways — 38%
AAPL in-line. PCE in-line. BTC consolidates 74,800–78,000. The decoupling holds, no extension. Spot ETF demand keeps the floor. This is the base case — crypto waits for equities to resolve.
Bear — 27%
Hot PCE plus AAPL miss. Correlation spikes back toward 0.80. BTC loses 74,800, tests 72,500. All three conditions required: hot data, Mag 7 disappointment, and correlation reversion. Each condition individually is manageable; the combination is what creates the flush.
Risk Score
Risk: around 65%
The 65% risk score reflects the event density of the next 36 hours rather than the structural position. The decoupling thesis is intact and the fundamental case for BTC is unchanged. But AAPL tonight carries the entire Mag 7 narrative weight — META and AMZN sold their beats, which means the market is willing to punish single names and the risk of a sharp equity move on AAPL’s guidance is real. If equities move sharply on AAPL, the first test of whether the 0.54 correlation holds arrives before PCE. Do not add to BTC positions ahead of the AAPL print. The size you have on is the size you take into the binary.
How to Walk It
STANDARD SIZE — Post events
After AAPL and PCE: if 74,800 holds and PCE cools, add on a break above 78,200
Stop: 73,500
Target: 80,000–82,500
Size to the break, not the thesis
REDUCED SIZE — Tonight
Hold existing positions at 50% ahead of AAPL. The floor is 74,800. If AAPL disappoints and equities gap lower, you need the capacity to add at the floor, not to be caught in a full position that needs closing at a loss.
AVOID
Do not buy BTC at 76,000 with AAPL printing in hours and PCE Friday looming. The risk of a 3,000-dollar gap down on the correlation reversion is not offset by a 2,000-dollar continuation to 78,200. Wait for the catalysts.
For scalpers: The intraday range 75,398–76,358 is narrow. Look for bounces from 75,400 with 200-dollar stops and targets at 76,300. Do not hold through the AAPL print — BTC can gap 1,500 dollars on a correlation spike if equities flush hard.
For swing traders: The 74,800 level is the entry on the pullback, not the current price. Patient swing traders wait for the event binary to resolve and then enter if the floor holds. The post-PCE setup is the cleanest swing entry of the week.
For positional traders: The halving dynamic and ETF institutionalisation are unchanged. If you are a long-term holder, this week’s events are noise inside a structural trend. Hold your position with a stop below 70,200 and let the binary events resolve.
Beginners: Bitcoin does not behave predictably around macro events. The correlation to equities is 0.54 today and can be 0.80 tomorrow. If you do not understand how to size for correlation risk, hold very small or hold nothing through this weekend’s event stack.
Continue Reading
Wednesday’s Digital Flow brief, including the full correlation analysis, ETH underperformance signal, and the three-scenario probability breakdown into PCE, is at our Digital Flow brief Wednesday 29 April 2026.
The macro context — Powell’s hold, the rate-cut odds collapsing to 44%, and what the symmetric hold means for risk assets including crypto — is in our Macro Pulse brief Wednesday 29 April 2026.
Today’s full session read, including the Ethereum ticker alongside this one and the cross-asset context for the event stack, is in our Pre-NY Brief Thursday 30 April 2026.
This analysis is for educational purposes only and does not constitute financial advice. Markets involve risk and capital can be lost. Always manage your risk appropriately.
Sunday 26 Apr 2026
BTCUSD Daily Read. The Risk Asset That Refused To Print The High. Read The Silence.
Daily Ticker Read | Sunday 26 April 2026
Equities printed records on Friday. The S and P at 7,170, the Nasdaq at 27,323, XLK plus 2.81 percent on the session. Bitcoin held 77,928 and went home. That is not a coincidence. That is the asset class telling you what it thinks of the rally. The Sunday tape carries that message into a Mag 7 earnings week and a Powell press conference. You read this market by the silence, not the noise.
Where BTC Sits Right Now
| Window | Move | Read |
|---|---|---|
| Spot | 77,928 | Sunday drift, low conviction tape |
| 24-hour | flat to soft | No bid into Asia open. Carry trade asleep. |
| 7-day | underperformed equities | SPX printed records, BTC did not. Hard divergence. |
| 30-day | range-bound 75k to 82k | Compression building. The break, when it comes, runs. |
| Range location | mid-zone | Closer to support than upside, no edge bid |
BTC trades 24/7. That is its tell. When the rest of the world goes home and the price sags rather than ramps, the asset class is not buying the bullish narrative the equity tape is selling. The Sunday close versus Monday futures gap is where the real read sits.
Structural Read
The framework reads BTC as compressed. Higher lows building since the mid-month wash, but no fresh breakout above the late-cycle ceiling near 82k. Volume is fading on each push higher and rebuilding on each pullback. That is the textbook signature of distribution dressed up as consolidation. The buyers are tired. The sellers are patient.
Inside that compression, the framework is showing a clear lean. Range location is mid-zone, not upper. Trend strength has rolled over from peak. The macro lens reads transitional rather than confirmed risk-on. None of those reads is a sell signal on its own. Together they describe a market that has lost the easy upside and now needs a catalyst to break either way.
The structural pattern that matters: BTC has traded as a high-beta risk asset for three years. When the indices print fresh records, BTC normally leads or co-leads. This Sunday the indices printed and BTC did not move. That decoupling is the structural shift. Either the framework sees the gap close on a violent catch-up, or the equity rally is the side that gets pulled back to BTC’s level.
Three Levels That Matter
| Level | Type | Why It Matters |
|---|---|---|
| 82,500 | Technical ceiling | The level the framework needs reclaimed to validate any catch-up move. Three rejections from this zone in thirty days. A daily close above flips the structural read. |
| 75,800 | Range floor | The pivot the framework is defending. Lose this on a daily close and the next demand zone is materially lower. Above this, the compression continues. |
| 80,000 | Psychological round | The handle the crowd watches. Sits inside the range. A reclaim and hold above 80k is the early signal that the catch-up trade is live. A rejection from below confirms the heaviness. |
Two Trade Ideas
Long. The Catch-Up Snapback.
Risk score: around 50%. Time horizon: one to two weeks.
The framework calls this the divergence-resolution long. If a Mag 7 print rerates risk higher and equities hold the highs, BTC is the asset most likely to snap the gap shut violently.
| Entry zone | 77,500 to 78,200 |
| Stop | 75,800 (daily close) |
| Target one | 82,500 |
| Reward to risk | Around 2.4 to 1 |
Kill conditions: A daily close below 75,800 voids the structure. A clean Mag 7 disappointment that sends NDX down hard cancels the catch-up thesis, take it off.
Short. The Equity Pullback Drag.
Risk score: around 55%. Time horizon: one to three weeks.
The framework reads this as the structural short. If the AAII bull-flip plus VVIX near 100 plays out as a short-term equity peak, BTC drags lower with the index unwind. The asset that did not rally is the asset that breaks first.
| Entry zone | 79,800 to 80,400 on rally |
| Stop | 82,600 (daily close above 82,500) |
| Target one | 74,500 |
| Reward to risk | Around 2.0 to 1 |
Kill conditions: A daily close above 82,500 invalidates. A Mag 7 beat clean enough to compress VVIX below 90 and push NDX through 27,650 cancels the drag thesis.
Time Horizons
- Intraday (24 to 48 hours): Watch the Sunday close versus Monday Asia open gap. A gap up that holds above 79k is the early catch-up signal. A gap down that loses 77,500 confirms the heaviness.
- Swing (one to two weeks): Both trades sit in this window. The Mag 7 cycle and Powell event are the resolution catalysts. Whichever trade triggers first is carrying the conviction the tape revealed.
- Position (one month plus): The framework is not bullish here. The decoupling from equities is structural, not noise. Position-size accordingly. No core long until the 82,500 ceiling is reclaimed and held.
Risk Score: Around 60%
What is on the scoreboard:
- +20% Decoupling from equity records, structural risk-off signal inside crypto
- +15% Mag 7 earnings week, sixteen trillion at stake, binary catalyst risk
- +10% Powell final press conference, end-of-era language risk
- +10% Weekend liquidity thin, gap risk into Monday Asia
- +5% Hormuz blockade still live, oil shock spillover possible
- −5% Range floor at 75,800 has held three tests, demand zone proven
Net: around 60%. Elevated. Not extreme. The week that resolves it is the one in front of us.
Catalyst Stack
Macro: Powell’s final press conference is the binary event. The market is reading every word for a hawkish-to-dovish handoff signal. A hawkish surprise drags BTC lower with the index. A dovish surprise lights a catch-up move. Either way, the option tape is paid for the move.
Weekend liquidity: The thinnest hours of the week sit between the New York close on Friday and the Asia open on Monday. BTC is the only asset that trades through that gap. Sunday drift in BTC is informational. A controlled sag like the current tape says no major desk wants to add risk on Monday. Watch the futures gap when CME opens.
Mag 7 spillover: Sixteen trillion of market cap reports this week. The framework reads BTC as historically tracking NDX on Mag 7 prints. A clean miss from any of the four bullish-flow names (AAPL, NVDA, MSFT, AMZN) drags BTC. A clean beat lifts it. The asymmetry is real because BTC has not pre-rallied with the index. The catch-up potential on a beat is larger than the downside risk on a miss, mechanically.
Hormuz: The blockade is still in place. An oil shock that crashes demand is a risk-off catalyst across asset classes. Crypto reads that book the same as equities now, not the way it did during the 2024 inflation hedge era. Treat any Hormuz escalation as a BTC negative this week, not a positive.
Cross-Reference
Digital Flow already mapped the divergence at the asset-class level: BTC at 77,928 versus equities at all-time highs is a divergence that resolves violently in one direction or the other. This BTCUSD ticker read pulls that thesis down to the chart. The catch-up long and the drag short are the chain-level expressions of the asset-class call. Sentiment Shift framed the option tape: greed reading at 66 alongside VIX above 18 is the contradiction, and BTC is reading the option tape rather than the surface greed. The framework reads the same book three ways and arrives at the same caution.
What We Called vs What Happened
| Call (22 Apr) | Outcome (by 26 Apr) | Verdict |
|---|---|---|
| Long, target $80,000 then $82,000. | Spot drifted from $78,505 to $77,928 over the four sessions. Neither target tagged. Direction wrong on the leg. | Missed |
| Wednesday’s 2.82 percent print confirms the bid and momentum is accelerating. | Subsequent sessions sagged while equities printed records. The bid faded rather than carried, and the decoupling became the story. | Reversed |
| Use the $75,000 to $76,500 pullback band for entries. | Range floor was probed near $75,800 but the deeper part of the band was not retested. Zone remains live. | Open |
| Structural support at $73,000 holds, accumulation thesis intact. | Lows held well above $73,000. Floor untested. | Confirmed |
| Stop below $70,000 questions the regime. | Never threatened. Stop sat untouched throughout. | Confirmed |
Track record: two of five calls confirmed over the four-session window, with the upside targets missed and the momentum read reversed once the asset decoupled from the equity tape.
This is analysis, not financial advice. Always manage your risk.
Thursday 23 Apr 2026
Daily Framework Read | Thursday 23 April 2026 | Published 22:00 London / 17:00 New York / 07:00 Tokyo
BTCUSD
Bitcoin $77,876 -0.42%
Bitcoin edged lower in a quiet session, giving back less than half a percent. The decline tracked the broader equity pullback but BTC showed relative strength compared to tech stocks. Volume was light, suggesting consolidation rather than distribution. The $77K-80K range continues to contain price action.
Framework Read
| Layer | Reading | Interpretation |
|---|---|---|
| Direction | LONG | Consolidation within a bullish structure |
| Structure | Range-bound | Consolidating between $75K-80K before next move |
| Momentum | Neutral | Short-term flat. Medium-term bullish bias |
| Flow | Accumulation | ETF inflows stable. Long-term holders not selling |
| Evidence | Bullish consolidation | Range will break higher. Time and patience |
Yesterday vs Today
Yesterday BTC rallied nearly 3% on the risk-on wave. Today it gave back less than half a percent. That relative strength is notable. When equities drop 0.4-0.6% and BTC drops only 0.4%, the correlation is loosening in favour of crypto. This suggests accumulation is happening on dips.
The Read
BTC at $77,876 is building a base. The $75K level has acted as a floor on multiple tests. ETF flows remain net positive. The halving supply dynamics continue to play out. The macro environment of dollar weakness and gold strength is supportive for BTC as an alternative store of value. The breakout above $80K will confirm the next leg to $85K and beyond.
The call: long on dips to $76K-77K. Stop below $74K. Target $80K on the range break and $85K on continuation.
Key Levels
| Level | Price | Significance |
|---|---|---|
| Target 2 | $85,000 | Continuation target after breakout |
| Target 1 | $80,000 | Range high and breakout trigger |
| Entry Zone | $76,000-77,000 | Pullback buy zone |
| Support 1 | $75,000 | Range floor tested multiple times |
| Stop Zone | $74,000 | Below here the range breaks down |
| Support 2 | $72,000 | Deep support |
What We Called vs What Happened
The framework has been long BTC with $75K support. That level continues to hold. Today’s modest decline is within the expected consolidation range. No change to the thesis.
Risk Assessment
Domain risk: Around 35% (moderate)
BTC risk is moderate in the current range. ETF flows support the downside. The main risk is a broader risk-off event that tests $75K. If that breaks, $72K becomes the target. But the structural case remains bullish above $74K.
Bottom line: BTC consolidating with a bullish bias. $75K-80K range intact. Relative strength versus equities is encouraging. Buy dips to $76K-77K. Target $80K breakout. Patient accumulation is the play.
Cross-reference: Today’s Crypto Report for altcoin analysis and on-chain data.
This is analysis, not financial advice. Always manage your risk.
Thursday 23 Apr 2026
Daily Framework Read | Wednesday 22 April 2026 | Published 22:00 London / 17:00 New York / 07:00 Tokyo
BTC/USD
Bitcoin $78,505 +2.82%
Bitcoin posted its strongest day this week with a 2.82% gain. The framework says LONG. This is an accumulation regime. The market structure shows steady buying at lower levels, declining sell-side volume, and expanding on-chain accumulation. When Bitcoin rises 2.82% on a day where equities are also rallying, it tells you the risk appetite is broad and crypto is participating fully.
Framework Read
| Layer | Reading | Interpretation |
|---|---|---|
| Direction | LONG | Accumulation regime. Strongest day this week confirms the bid |
| Structure | Base building complete | The consolidation phase is resolving higher. Higher lows are forming |
| Momentum | Accelerating | Momentum turned up on volume. Short-term and medium-term aligned |
| Flow | Accumulation | Exchange outflows suggest accumulation. Holders are moving to cold storage |
| Evidence | Aligned bullish | Structure, momentum, and flow all say the same thing. Accumulation resolving higher |
Yesterday vs Today
Yesterday Bitcoin drifted lower with the broader market in a typical risk-off session. Today it responded with conviction. A 2.82% gain, the best of the week, shows that the pullback was just that: a pullback, not a reversal. The buyers who stepped in on the dip have been rewarded. That pattern of buying the dip and being rewarded is the hallmark of an accumulation regime.
The Read
Bitcoin is in an accumulation regime. The on-chain data supports it, the price action supports it, and the flow supports it. When you see exchange outflows increasing, it means holders are moving coins off exchanges and into cold storage. That is not the behaviour of people who plan to sell. That is the behaviour of people who are building positions for a much higher price.
The call: long. The accumulation is real, the momentum confirmed it today, and the structure is clean. Any pullback to the $75,000-76,500 zone is a buying opportunity. The next major target is $82,000 and the $80,000 psychological level between here and there.
Key Levels
| Level | Price | Significance |
|---|---|---|
| Target 2 | $82,000 | Measured move target. Prior resistance zone |
| Target 1 | $80,000 | Psychological round number. First major test |
| Entry Zone | $75,000-76,500 | Pullback entry. Accumulation zone |
| Support | $73,000 | Structural support. Higher low zone |
| Stop Zone | $70,000 | Below this psychological level, the accumulation thesis is questioned |
What We Called vs What Happened
The framework flagged accumulation regime several sessions ago. Today’s 2.82% gain, the strongest of the week, validates that call. The dip buyers were rewarded and the structure continues to resolve higher. The thesis is intact and strengthening.
Risk Assessment
Domain risk: Around 35% (low-moderate)
The accumulation thesis is supported by on-chain data and price action. The main risk is a sudden regulatory headline or a broader macro shock that triggers forced selling. But the on-chain accumulation creates a structural floor that makes sharp, sustained declines less likely.
Bottom line: Bitcoin is in accumulation mode and today confirmed it with the best session of the week. Stay long. Use $75,000-76,500 for entries on any pullback. Target $80,000 then $82,000. Stop below $70,000. The accumulation regime is real and the resolution is higher.
Cross-reference: Today’s Crypto Report for on-chain flow data and exchange balance analysis.
This is analysis, not financial advice. Always manage your risk.
Tuesday 21 Apr 2026
Daily Framework Read | Tuesday 22 April 2026
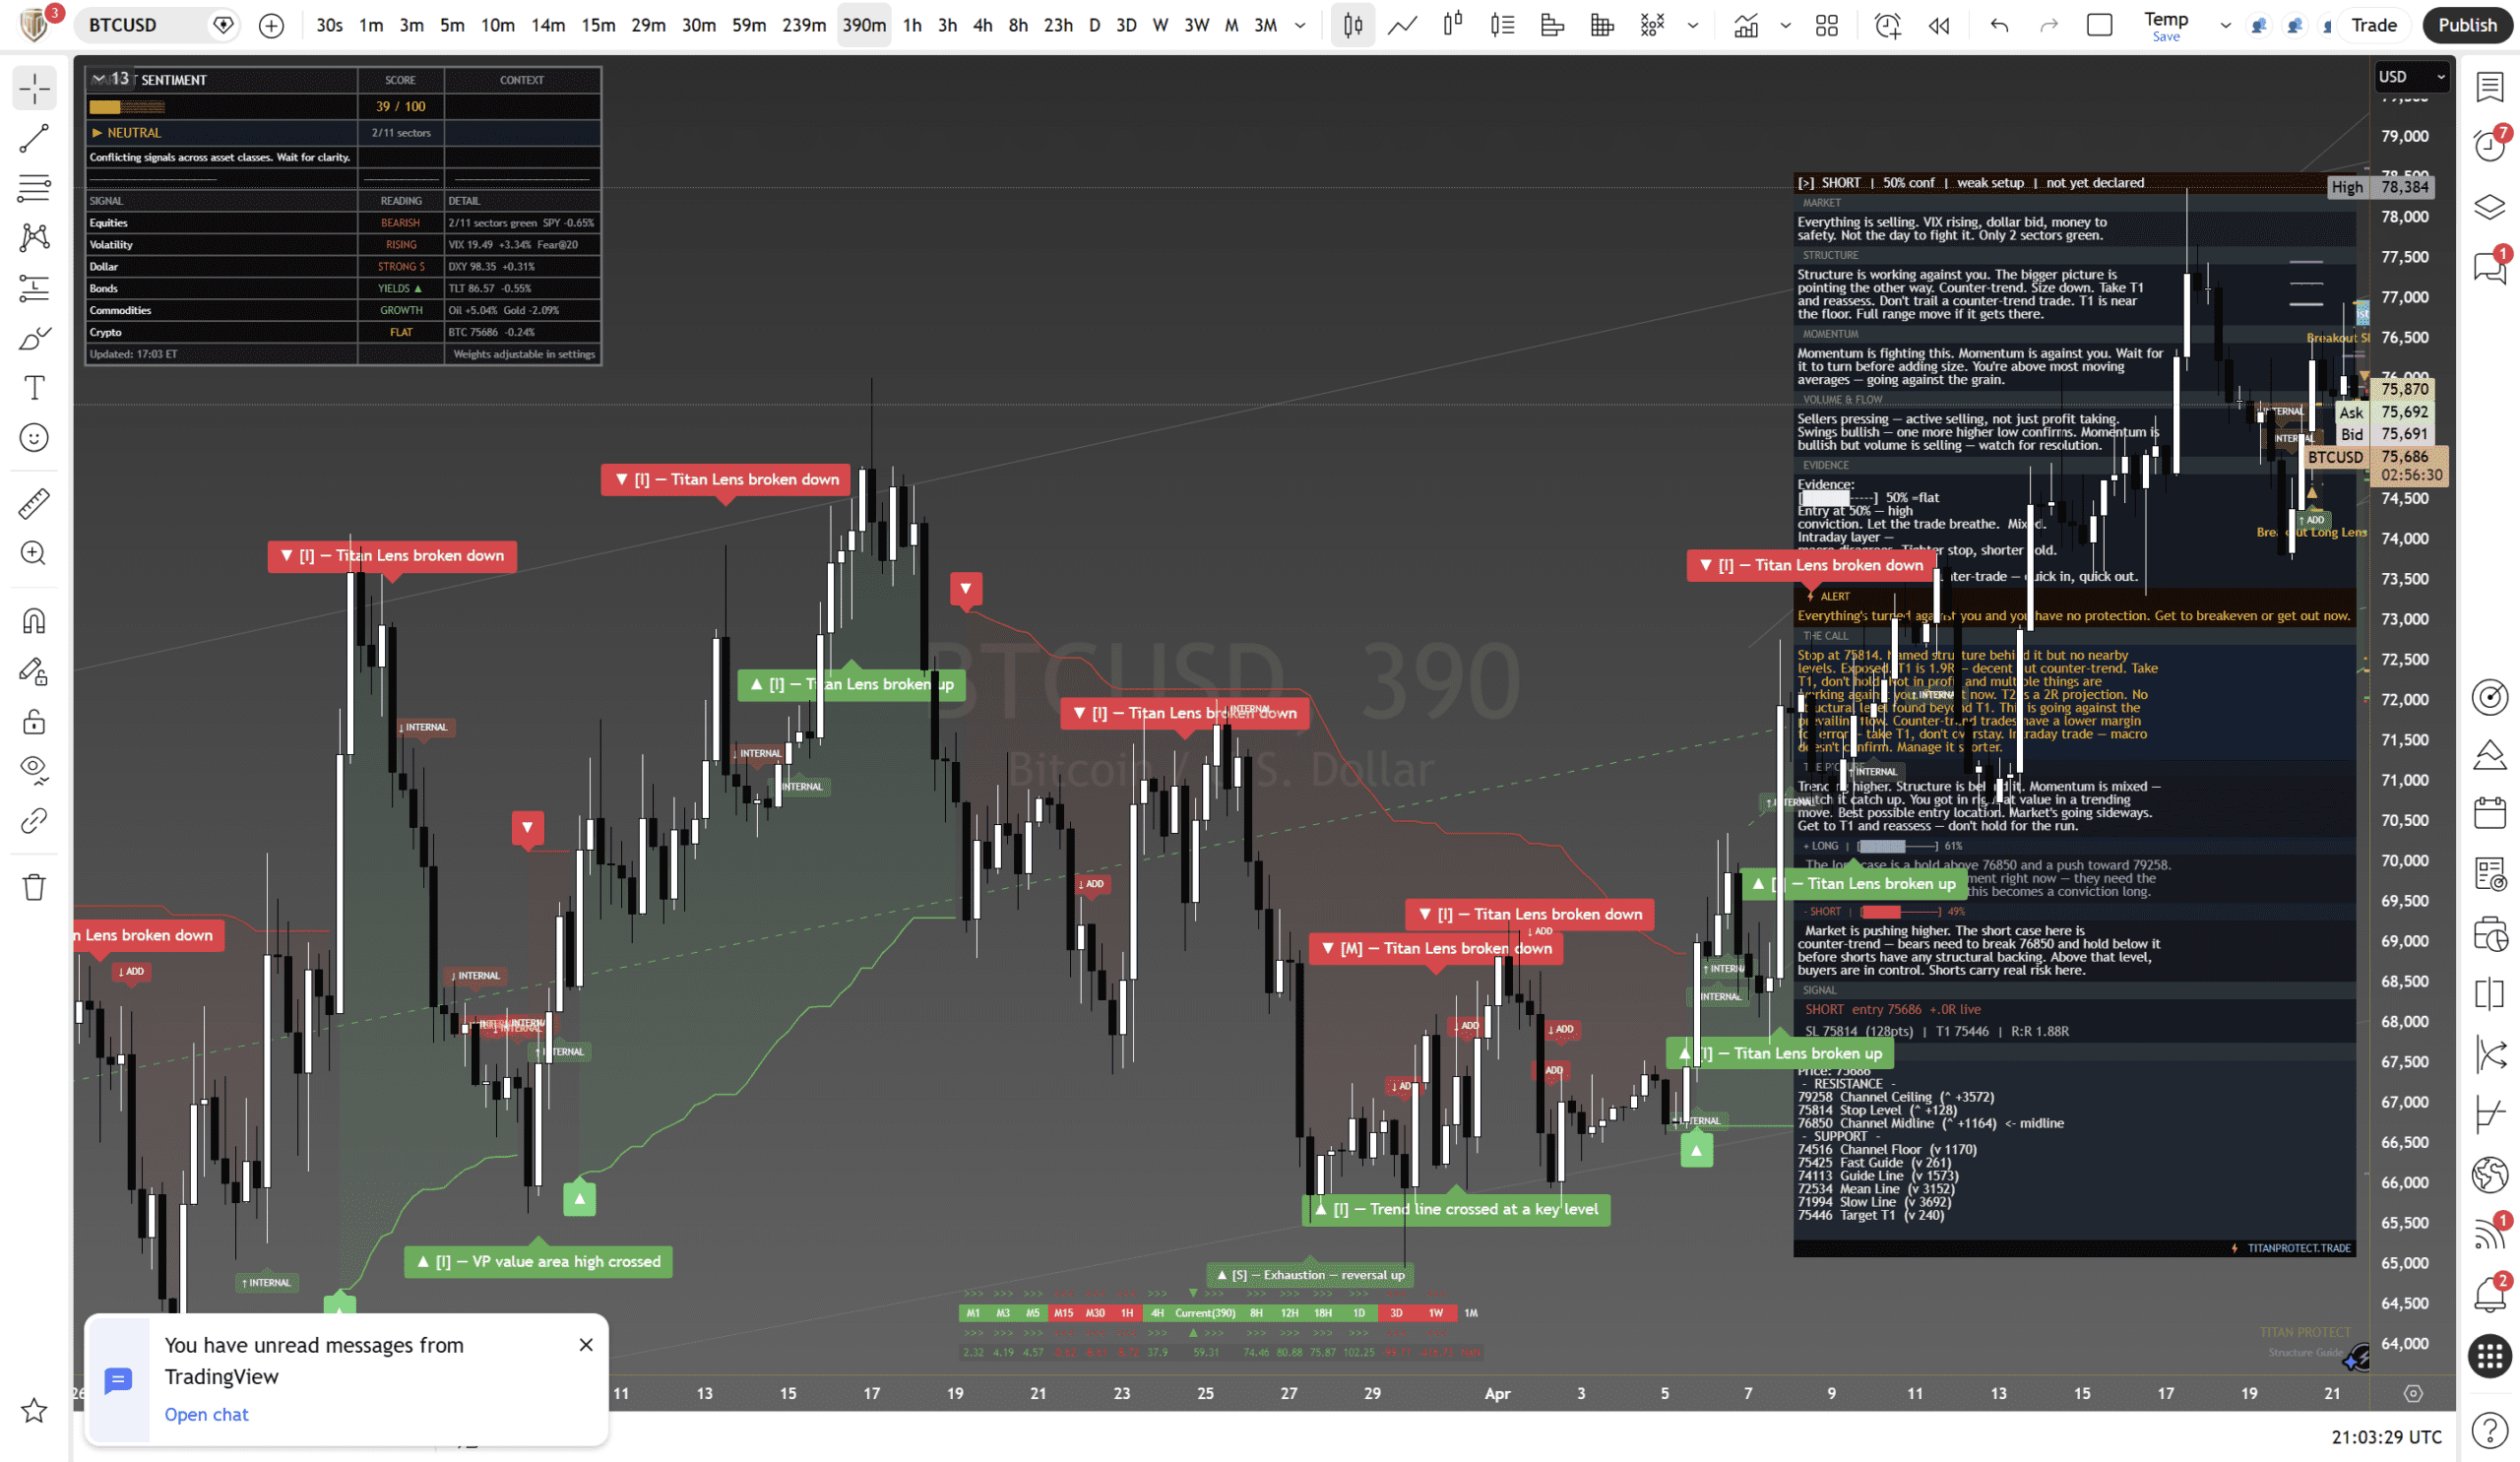
Bitcoin is drifting lower in a risk-off environment. The safe-haven narrative has not materialised — it is trading like a risk asset, falling with equities. Structure is broken on the short timeframe. The macro picture is unclear — range-bound between 73,000 and 78,000 with no clean trend.
Structure
Structure is working against longs. The bigger picture is selling — sellers in control and momentum confirms. Below all four moving averages. Do not hold a counter-trend trade here.
Momentum and Flow
Momentum is against the bulls. Active selling, not just profit taking. Watch for exhaustion but do not anticipate it — let the sellers finish before looking for a long entry.
Sellers pressing with active selling, not just short covering. Volume is softening slightly which could signal exhaustion, but do not front-run it.
The Two Cases
Counter-trend. Need to reclaim 76,274 and hold it. Buyers do not have structure behind them yet. Longs here are speculative and carry real risk.
Structure broken. Momentum confirmed bearish. Active selling. The path of least resistance is lower toward 73,500 unless buyers step in quickly.
Key Levels
| Resistance | 78,000 | Channel Ceiling |
| Resistance | 76,274 | Entry / Resistance |
| Pivot | 75,800 | Fast Guide |
| Support | 75,618 | Current Price |
| Support | 73,500 | Target 1 |
| Support | 71,200 | Channel Floor |
Market Context
BTC -0.34% ($75,618). Crypto following equities lower. VIX at 20.29. ETF flows slowing. Correlation with equities index remains high.
Analysis from our institutional research desk. Educational content only — not financial advice. Market data as of 21 April 2026. Past performance is not indicative of future results. All trading involves risk — manage yours. Independent analysis — no affiliation with any broker. Always do your own research before trading.