Bitcoin (BTC) – Daily Read
17 September 2026 | Crypto | Titan Macro Desk
$76,137.89
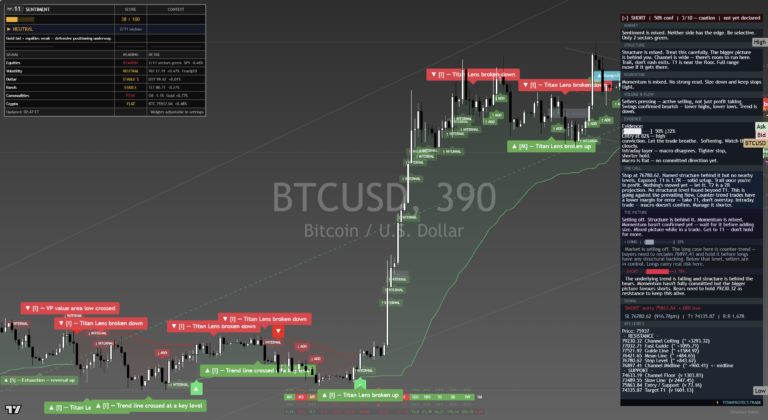
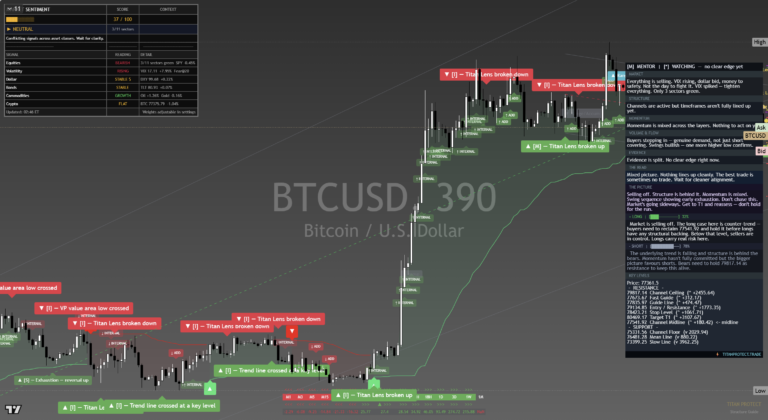
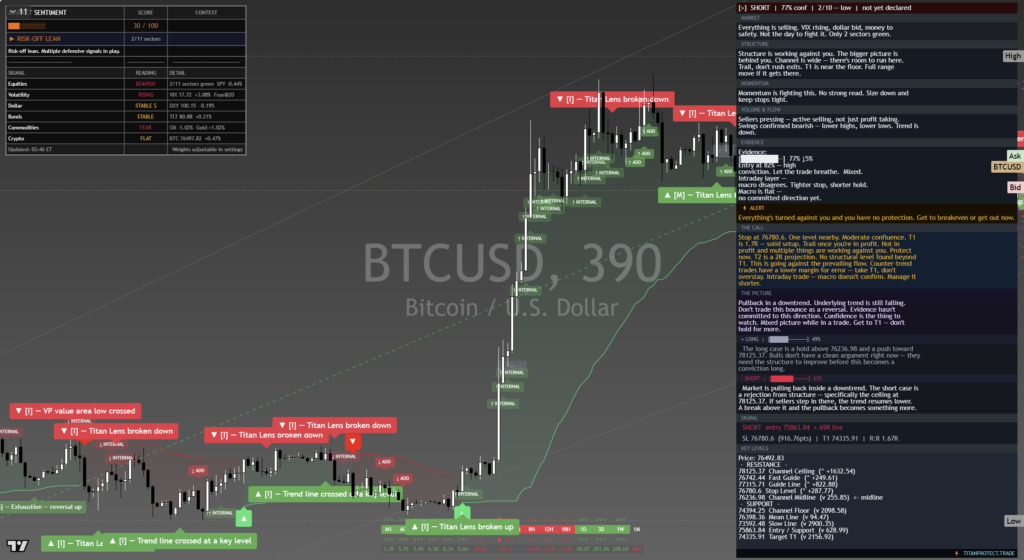
Bitcoin is trying to stabilize rather than restart its advance. Last price is $76,138, 0.1 percent higher on the day, but that modest gain does not repair the recent loss of traction. It is down near the floor of its one-month range, with momentum roughly 3.9 percent down over the last two weeks. The clear view is that this remains a pullback within a broader rising trend, but the market is close enough to support that the next directional move should carry more information than the current bounce.
The macro backdrop matters through liquidity, rates expectations, the dollar, and broader appetite for risk. Crypto tends to amplify changes in those conditions because positioning can adjust quickly and leverage can turn an orderly move into forced buying or selling. Bitcoin also has its own drivers, including spot demand, profit-taking after strength, and whether sidelined capital treats weakness as an entry or waits for confirmation. The one month average is $78,210; price is below it, and the structure reads as a pullback, slipping under the one-month average while the longer trend still points up. That tension explains the hesitant trade: longer-term buyers have not lost control, but shorter-term sellers still have the initiative.
The nearer round number handles at $77,500 and $75,000 frame the immediate contest. Reclaiming $77,500 would show that demand can absorb supply above the current market and would put $78,210 back in play as a test of whether the pullback is ending. Holding $75,000 matters because round levels often concentrate resting demand, stop placement, and leveraged positioning. Just beneath it sits a shelf of support at $74,985, about 1.5 percent below. That shelf is the more important defence because buyers have a clear place to prove conviction. A clean failure there would turn a contained retreat into a structural warning. The three month range is $58,397 to $81,763, showing that the current market remains in the upper part of a much broader advance even as near-term pressure builds. The month swing high is $81,763, about 7.4 percent above the current price, and it is the defining ceiling because supply previously overwhelmed demand there.
The bull path is straightforward: if $75,000 and $74,985 hold, then buyers have defended the range floor and can press for $77,500. If price then regains $78,210 and holds above it, the pullback begins to look complete rather than merely paused. A decisive move above $81,763 opens the path toward $84,263, because clearing the established high would remove the most visible overhead supply and invite momentum buyers back into the market.
The bear path begins if repeated rebounds cannot recover $77,500. That would signal that sellers remain comfortable distributing into strength. If $75,000 gives way and losing $74,985 exposes $58,397, the risk changes materially because the market would have broken its nearby shelf and reopened the full lower boundary of the broader range.
The main risk to the bullish interpretation is a liquidity shock or a sustained deterioration in risk appetite that overwhelms instrument-specific demand. The bearish read is invalidated by acceptance above $81,763. Net, Bitcoin retains a constructive longer trend, but below $78,210 the burden of proof remains with buyers, and $74,985 is the line that separates a manageable pullback from a deeper reset.
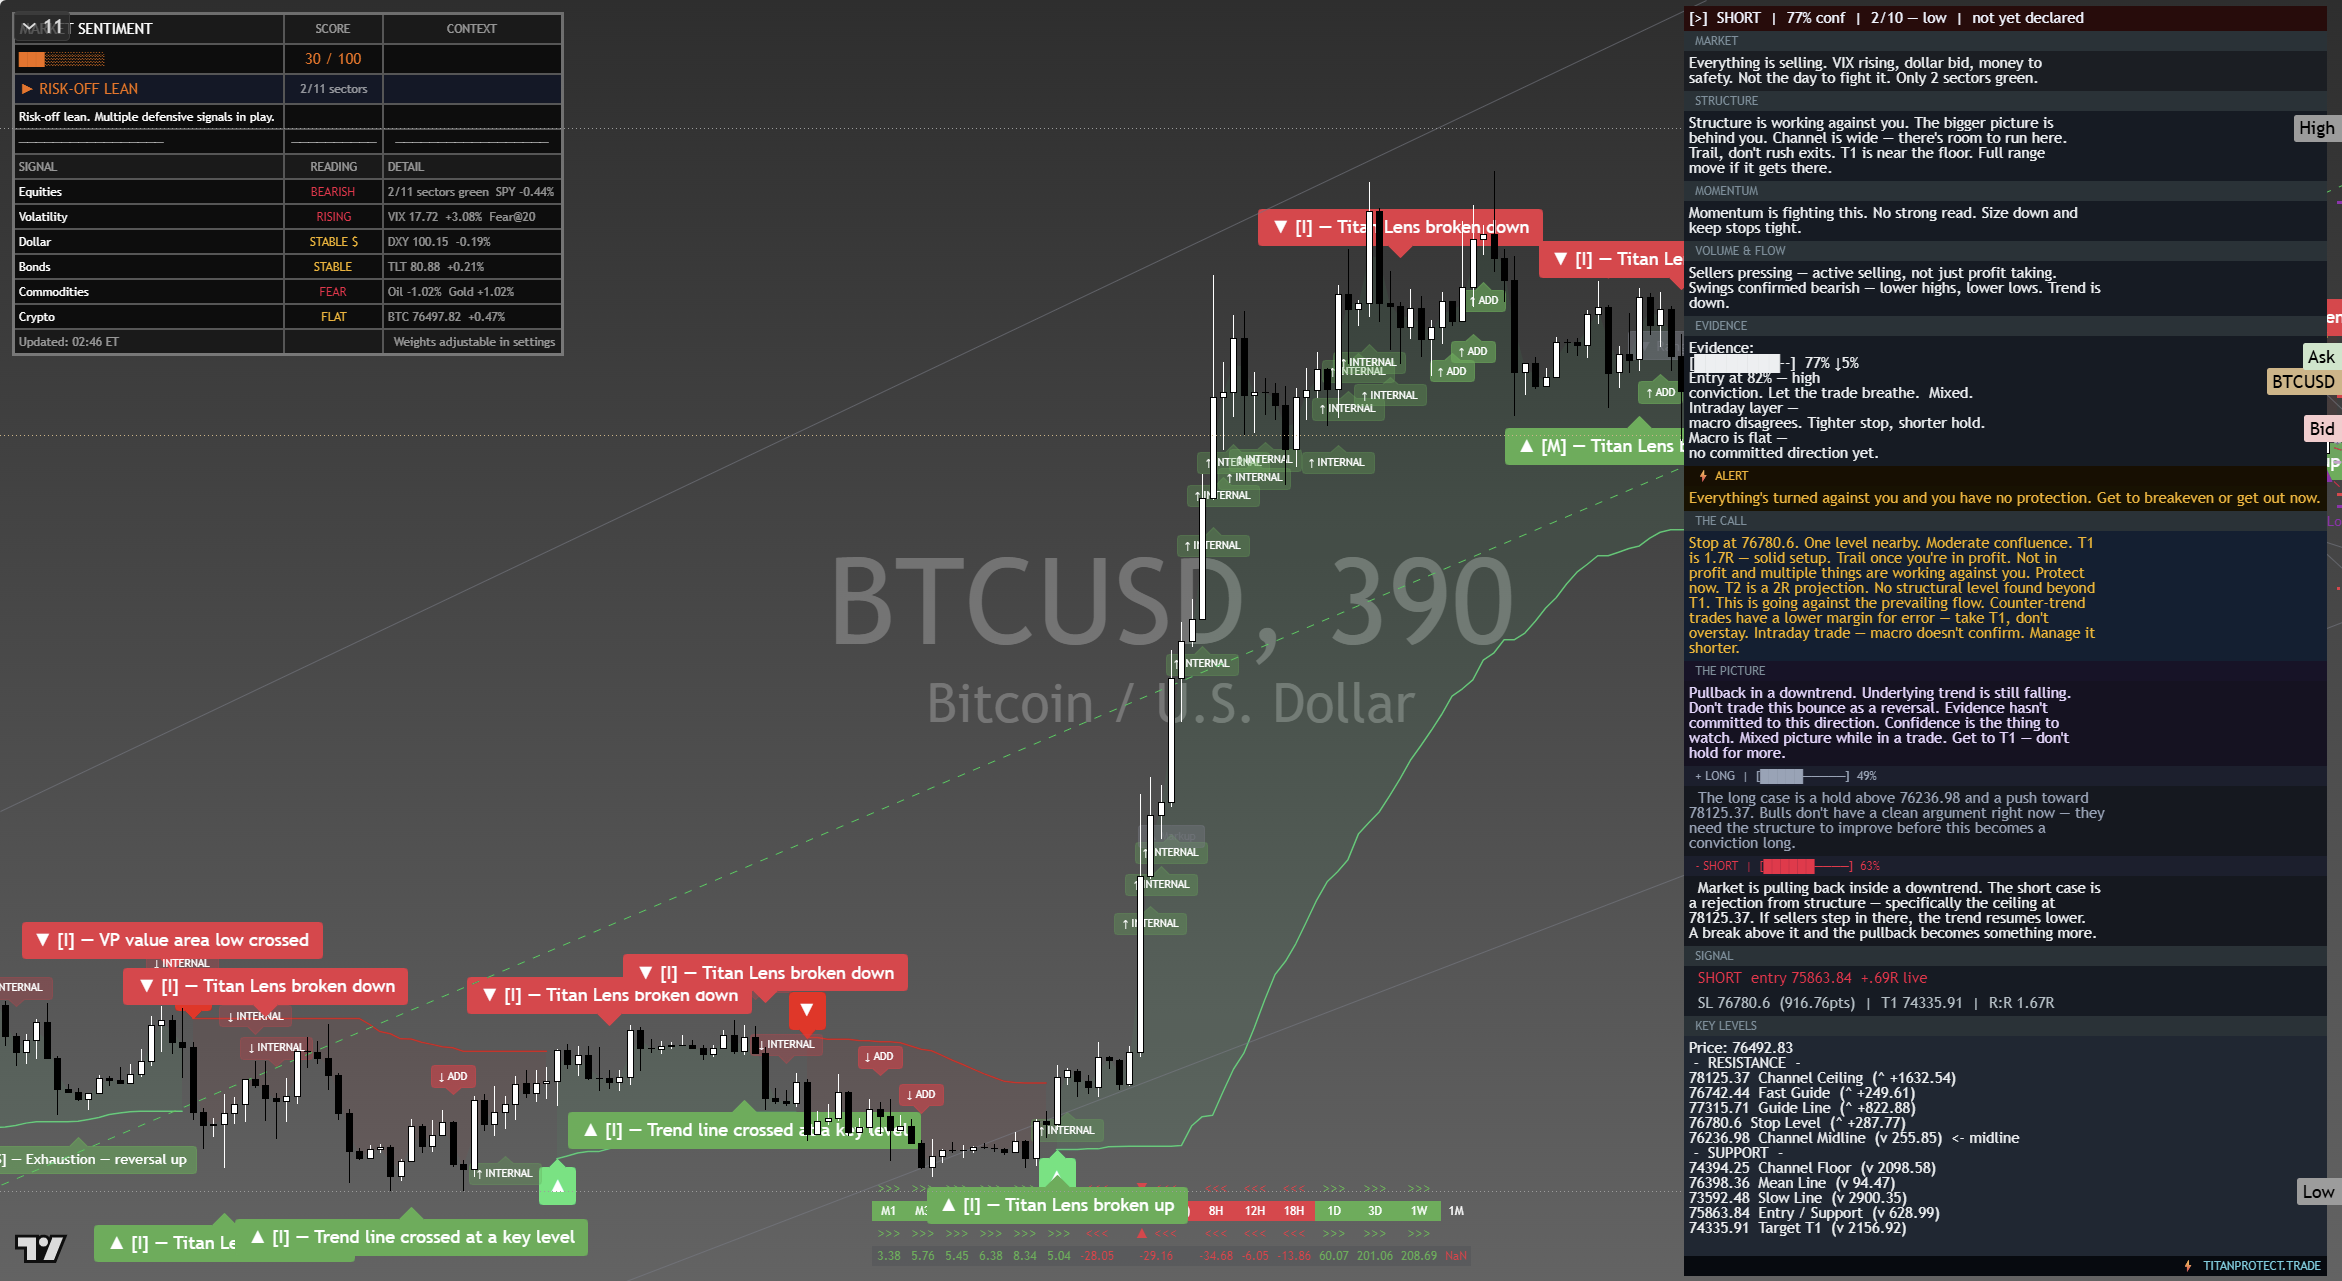
The chart above is the full daily read: structure, momentum, the levels that matter, and where the current price sits against them. Read it top to bottom for the complete picture, and pair it with our session briefs for the wider market context.
This is analysis, not financial advice. It reflects our multi-factor framework and is not a recommendation to buy or sell. Always do your own research and manage your risk.