The Bitcoin Framework Journal for June 2026, newest read at the top. Each dated entry is our read on the close, kept as a living record so the framework can be judged over time. This is analysis, not financial advice.
Tuesday 30 Jun 2026
Bitcoin (BTC/USD)
Daily Framework Read | Tuesday 30 June 2026
Q3 Day 2
CONFIDENCE
Moderate
RISK FACTOR
7.2%
Framework Interpretation
Structure
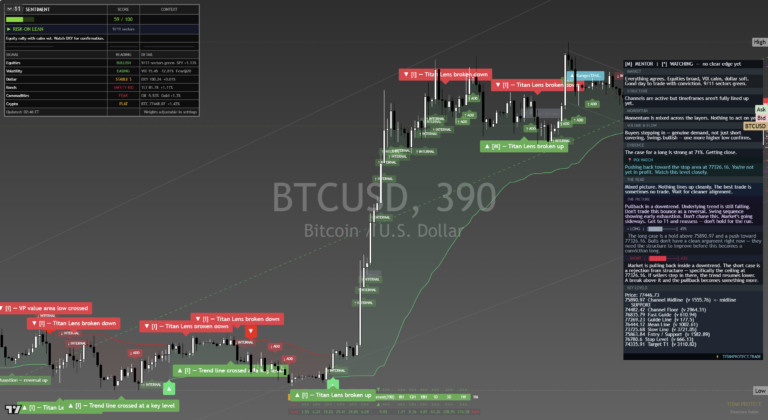
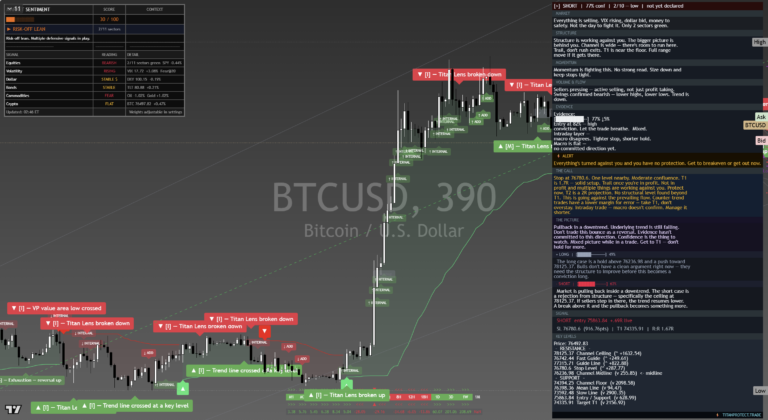
Monday Bitcoin was bearish with moderate confidence and that read continues into Tuesday. The daily chart confirms the trend line has crossed at a key level, a bearish structural signal. Price remains well below the cloud, which sits as a thick band of overhead supply. The lower highs pattern from the prior weeks is intact. The bounce on Monday appears to have stalled, and the framework continues to read this as a corrective rally within a bearish structure rather than a base for reversal.
Momentum
Momentum remains mixed but with a bearish lean. The daily timeframe continues to show the broader trend as down, with shorter-term momentum unable to generate enough force to challenge the cloud above. The bounce from the lows is losing energy. The framework sees this as a market where momentum is building for the next leg lower but has not yet triggered, which keeps this at moderate rather than high conviction.
Volume
Volume on the recent bounce continues to underwhelm compared to the prior selloff. This is the distribution pattern continuing. Sellers are offloading into strength while buyers lack conviction. The daily candles show narrowing ranges near the lows, which typically precedes a directional resolution. The volume profile confirms supply dominates demand at current levels.
The Call
Bearish with moderate confidence, unchanged from Monday. The structural picture has not improved. The cloud remains overhead, the trend line cross confirmed the bearish bias, and the bounce is losing steam. Q3 Day 2 with month-end and quarter-end flows still in play. ETF flow data will be watched closely by institutional players. The framework maintains that this bounce is for lightening exposure, not adding to it. The 55,000 structural floor remains the downside target if the current support fails.
Key Levels
| Level | Price | Significance |
|---|---|---|
| Resistance 2 | 64,000 | Cloud base, narrative-changing level |
| Resistance 1 | 61,500 | Near-term ceiling, bounce rejection zone |
| Current Price | ~59,800 | Below cloud, bounce fading |
| Support 1 | 57,500 | Prior consolidation zone, demand cluster |
| Support 2 | 55,000 | Major structural floor, channel base |
Risk Assessment
HIGH
24/7 market + regime transition + ETF flow uncertainty + quarter-end
Risk remains high for the same reasons as Monday: the 24/7 trading environment, the ongoing regime transition from bull to bear, and quarter-end institutional flow uncertainty. ETF flows continue to be the primary institutional mechanism. Regulatory headlines and exchange risk remain perpetual tail events. The narrowing daily ranges near the lows could resolve violently in either direction.
Scenario Analysis
Bull Case
15%
Reclaim 64K and cloud on ETF inflow surprise
Sideways
30%
Range 57,500-61,500 as market awaits catalyst
Correction
45%
Break below 57,500 targeting 55,000 structural floor
Black Swan
10%
Regulatory shock, exchange event, or ETF liquidation cascade
Position Sizing Guidance
STANDARD
REDUCED
AVOID
Moderate conviction with high risk factor keeps sizing at reduced. The bearish thesis is intact from Monday and unchanged. If already short, the framework supports holding with stops above 64K. New short entries are better timed at a bounce rejection near 61,500 rather than chasing the downside from here. The narrowing ranges suggest the next directional move could be sharp, which makes timing and sizing critical.
Experience-Level Guidance
Beginner
Bitcoin remains bearish for the second consecutive day. The bounce from Monday is fading and the framework has not changed its view. When the framework repeats the same call two days running, pay attention. The cloud above is thick and price has not come close to challenging it. If you hold Bitcoin, the framework is not telling you to panic, but it is telling you to be realistic about the near-term direction. Do not buy this dip hoping for a quick recovery. The structure does not support it.
Intermediate
Two consecutive bearish days with consistent moderate confidence means the framework is tracking, not guessing. The bounce from Monday has stalled and the 61,500 ceiling held. The 57,500 support is the next test. If that breaks with volume, the path to 55,000 opens. For short positioning, the 61,500 level offers a defined-risk entry on a bounce rejection. The narrowing daily ranges are a precursor to a sharp move. Have your plan ready for both scenarios before it happens.
Advanced
Continuation of Monday’s bearish moderate read. The trend line cross at a key level on the daily is a significant structural deterioration signal. The cloud above is thick and unchallenged. The narrowing ranges near the lows resemble a bear flag or descending triangle, either of which typically resolves lower. ETF flow data for Q3 Day 2 will confirm whether institutional selling continues. The 55K structural floor is the target for this cycle. Options implied volatility remains elevated, making defined-risk bearish strategies attractive. For those watching the on-chain data, exchange balances and whale movements provide additional confirmation layers outside the chart framework.
This content is for informational and educational purposes only. It does not constitute financial advice, investment recommendations, or a solicitation to trade. All trading involves risk. Past performance does not guarantee future results. Always conduct your own research and consult a qualified financial adviser before making investment decisions. Titan Protect is not responsible for any losses incurred from acting on this information.
Tuesday 30 Jun 2026
Bitcoin (BTC/USD)
Daily Framework Read | Monday 29 June 2026
Q3 Day 1
CONFIDENCE
Moderate
RISK FACTOR
7.5%
Framework Interpretation
Structure
Bitcoin at $60,432 has rallied 1.7% on the risk rally but the daily chart tells a different story. The analysis reads MOSTLY SHORT with one layer not yet confirmed. Price remains below the cloud, the trend line has crossed at a key level, and the bigger picture is bearish despite the short-term bounce. The +1.7% move is happening within a bearish structure, which the framework interprets as a corrective bounce rather than a trend reversal.
Momentum
Momentum is mixed across the layers. The framework flags this as a market where the directional tools are beginning to agree on a downside lean but have not fully synchronised. The recent bounce is losing steam based on internal readings. Building at 525 suggests early signs of downside confirmation forming, but it is not complete yet.
Volume
The risk rally bounce came on lighter volume than the prior selloff, which is a textbook distribution pattern. Sellers are more active than buyers on a net basis. The volume profile confirms this is a market where supply is being offloaded into strength rather than demand stepping up with conviction. The bounce is being sold into.
The Call
Bearish with moderate confidence. The 1.7% risk rally does not change the bigger picture. Bitcoin remains below the cloud on the daily timeframe, the analysis reads mostly short, and the bounce is corrective. One layer pending confirmation keeps this at moderate rather than high conviction. Q3 Day 1 could bring institutional repositioning that accelerates the move in either direction. The framework says this bounce is for lightening exposure, not adding to it.
Key Levels
| Level | Price | Significance |
|---|---|---|
| Resistance 2 | 64,000 | Cloud base, major overhead supply |
| Resistance 1 | 61,700 | Near-term ceiling, bounce rejection zone |
| Current Price | ~60,432 | Below cloud, risk rally bounce |
| Support 1 | 58,500 | Prior consolidation zone, demand cluster |
| Support 2 | 55,000 | Major structural floor, channel base |
Risk Assessment
HIGH
24/7 market + regime transition + one unconfirmed layer + Q3 institutional flows
Bitcoin’s risk is elevated by the 24/7 trading environment, the regime transition from bull to bear, and the fact that Q3 Day 1 often brings institutional portfolio adjustments. ETF flows could shift direction. Regulatory headlines remain a perpetual tail risk. The 1.7% bounce within a bearish structure adds the risk of being right on direction but wrong on entry timing.
Scenario Analysis
Bull Case
20%
Risk rally extends, reclaim 64K and cloud, ETF inflows resume
Sideways
30%
Range 58,500-64,000 as market digests regime shift
Correction
40%
Bounce fails, break below 58,500 targeting 55,000
Black Swan
10%
Regulatory shock, exchange event, or ETF liquidation cascade
Position Sizing Guidance
STANDARD
REDUCED
AVOID
Moderate conviction with one unconfirmed layer warrants reduced sizing. The 1.7% bounce creates a timing risk for new short entries. If already positioned bearish, the framework supports holding with stops above 64K. If flat, wait for the bounce to exhaust before entering. The framework is not saying chase the short into a bounce.
Experience-Level Guidance
Beginner
Bitcoin bounced 1.7% today and it might feel like the selloff is over. The framework disagrees. The bigger picture remains bearish with price below the cloud. This bounce is the type of move that traps buyers who chase green candles without reading the structure. Do not buy this bounce. If you hold Bitcoin, this is the framework telling you to stay alert, not to add. Watch the 58,500 level as the next line in the sand.
Intermediate
The framework says this bounce is for selling into, not buying. The 61,700 level is the near-term resistance. If Bitcoin stalls there and reverses, that confirms the corrective nature of the bounce. The 58,500 support is the next test. A clean break below 58,500 with volume would shift this from moderate to high conviction bearish. Plan both scenarios before the market moves.
Advanced
Mostly short with one layer pending. The 1.7% risk rally is classic bear-market bounce mechanics. Volume on the rally is lighter than on the prior selloff, confirming distribution into strength. The cloud at 64K is the level that changes the narrative. Below it, the framework stays bearish. Q3 Day 1 ETF flow data will be available by end of session and could confirm whether institutional money is exiting. The 55K structural floor is the ultimate test level for this cycle. Options implied volatility is elevated, making premium selling attractive for those with the skill set.
This content is for informational and educational purposes only. It does not constitute financial advice, investment recommendations, or a solicitation to trade. All trading involves risk. Past performance does not guarantee future results. Always conduct your own research and consult a qualified financial adviser before making investment decisions. Titan Protect is not responsible for any losses incurred from acting on this information.
Sunday 28 Jun 2026
Bitcoin (BTC/USD)
Daily Framework Read | Sunday 28 June 2026
Launch Edition
CONFIDENCE
Moderate
RISK FACTOR
7.8%
Framework Interpretation
Structure
Bitcoin’s daily chart shows a market that has pulled back from its recent highs and is now in RISK OFF mode. The analysis reads multiple timeframe signals as being in play, meaning this is not a simple one-directional call. The broader structure has shifted from the euphoric uptrend of recent weeks to a more cautious positioning. Price is below the cloud on the daily timeframe, which the framework interprets as a defensive environment.
Momentum
The framework flags multiple directional signals as conflicting, which is why the read is RISK OFF rather than outright SHORT. Momentum has faded from the highs but has not fully rolled over into a sustained sell signal. The internal readings suggest a market that is cooling rather than collapsing. This is an important distinction.
Volume
The pullback has seen increased selling volume relative to the prior rally, which the analysis reads as a shift in participation. Buyers at higher levels have stepped aside and sellers are more active. However, the overall volume profile is not yet at capitulation levels, suggesting this is distribution rather than panic.
The Call
RISK OFF with moderate confidence. This is not a “short everything” call. It is a “reduce exposure and wait for clarity” call. The framework sees enough evidence of a regime shift to warrant defensive positioning, but not enough to confirm a sustained bearish trend. Bitcoin trades 24/7 and weekend moves can be sharp. The framework recommends capital preservation until the conflicting signals resolve.
Key Levels
| Level | Price | Significance |
|---|---|---|
| Resistance 2 | 112,000 | Prior swing high, euphoria zone |
| Resistance 1 | 110,000 | Near-term overhead, psychological round number |
| Current Price | ~108,000 | Below cloud, in risk-off zone |
| Support 1 | 104,000 | Prior consolidation zone, demand cluster |
| Support 2 | 98,000 | Major structural support, trend-defining level |
Risk Assessment
HIGH
24/7 trading + regime transition + thin weekend liquidity + regulatory sensitivity
Bitcoin’s risk profile is elevated by the confluence of a potential regime shift and the 24/7 trading environment. Weekend liquidity is typically thinner, which amplifies moves in both directions. The transition from RISK ON to RISK OFF introduces additional uncertainty as positioning adjusts. Regulatory headlines and macro shifts can move Bitcoin 5-10% in hours.
Scenario Analysis
Bull Case
20%
Reclaim 110K, risk-on returns, institutional buying resumes
Sideways
30%
Range 104K-110K, conflicting signals persist through weekend
Correction
40%
Continued distribution, test of 104K and potentially 98K
Black Swan
10%
Regulatory shock, exchange event, or macro contagion
Position Sizing Guidance
STANDARD
REDUCED
AVOID
RISK OFF with moderate confidence warrants reduced sizing. If you hold Bitcoin, this is the framework telling you to tighten risk, not necessarily exit. If you are flat, do not initiate new positions into a regime transition. The framework needs more data before offering a directional conviction call.
Experience-Level Guidance
Beginner
RISK OFF means the framework is seeing warning signs. If you hold Bitcoin, do not panic sell, but also do not add to your position. This is a “step back and observe” moment. Weekend Bitcoin moves are often driven by thin liquidity and can reverse violently. Do not make decisions based on weekend price action. Wait for Monday’s institutional flow to resume before reassessing.
Intermediate
The 104K support is the line in the sand. If it holds, the pullback is healthy and the broader trend may resume. If it breaks, the framework suggests a deeper correction towards 98K is in play. Use this weekend to define your risk levels and plan your response to both scenarios. Reactive trading in a regime transition is more effective than predictive positioning.
Advanced
The RISK OFF read with multiple conflicting timeframe signals is a classic distribution pattern. Watch on-chain flows and exchange balances over the weekend for clues on institutional behaviour. The framework sees this as distribution rather than capitulation, which means the move lower could be orderly rather than violent. If looking to short, a bounce towards 110K rejected on declining volume would be the cleaner setup. If bullish longer-term, 104K on volume could be the re-entry zone.
This content is for informational and educational purposes only. It does not constitute financial advice, investment recommendations, or a solicitation to trade. All trading involves risk. Past performance does not guarantee future results. Always conduct your own research and consult a qualified financial adviser before making investment decisions. Titan Protect is not responsible for any losses incurred from acting on this information.
Thursday 25 Jun 2026
Titan Crypto Desk · Daily Framework Read · Thursday 25 June 2026
Bitcoin (BTC/USD): The Only Bearish Asset at -2.9% as Crypto Diverges From the Broader Recovery
Confidence: Around 58%
-2.9% | Only Bearish Asset
Yesterday vs Today
| Signal | Short (Wednesday) | SHORT (Thursday) |
| Confidence | Around 55% | Around 58% |
| Shift | Short signal strengthened. Bitcoin is the ONLY major asset still making new lows today, down 2.9% while equities, gold, crude, and most FX pairs are bouncing. The analysis reads short with increasing confidence. Multiple trend line breaks to the downside confirmed. Value area high crossed and rejected. Lane breaks cascading downward. Selling pressure is active, not just profit taking. | |
Daily Read
Bitcoin is the outlier today and not in a good way. While every other major asset class bounced, recovered, or at least stabilised on Thursday, BTC fell another 2.9%. This makes it the only bearish asset in the entire 32-instrument universe. When an asset underperforms during a broad recovery, it signals something deeper than correlation, it signals asset-specific selling pressure.
The chart confirms structural deterioration. The framework panel shows short with increasing confidence. Every layer of momentum is pointing down. The case for a short is strong at this level with selling pressure building. Trend line breaks are cascading lower, value area levels are being lost, and lane breaks are confirming the downside direction.
The divergence from traditional risk assets is important. Bitcoin has historically been correlated with NAS100, but today NAS100 at least shows exhaustion signals while BTC is making new short-term lows. This suggests crypto-specific selling, possibly from forced liquidations, ETF outflows, or large holder distribution. The framework does not speculate on the cause, but the structure is unambiguous.
DXY weakness should in theory be supportive for BTC (as an alternative store of value), yet the price is falling. When an asset cannot rally on bullish catalysts, the sell signal strengthens. The analysis reads this as one of the highest-conviction shorts in today’s universe.
Key Levels
| Level | Price | Significance |
|---|---|---|
| Resistance 2 | 65,000 | Value area high, signal invalidation |
| Resistance 1 | 63,500 | Lane break overhead, first ceiling |
| Current Zone | 61,000 – 62,500 | Active short zone, selling accelerating |
| Support 1 | 59,500 | Fibonacci retracement, next target |
| Support 2 | 57,000 | Major demand zone, capitulation level |
Risk Assessment
Around 75%
Elevated risk. BTC is the most bearish asset in the universe today. The selling is accelerating while everything else bounces. Crypto-specific liquidation cascades can amplify moves beyond normal technical levels. 24/7 trading means overnight risk is elevated. High conviction short but high risk environment.
What to Watch Today
- ETF flow data: net outflows confirm institutional selling
- Open interest and funding rates for liquidation cascade risk
- Whether BTC decouples further from NAS100 or re-correlates
- ETH and altcoin relative performance for crypto breadth
- 59,500 Fibonacci level as the next meaningful support test
This daily read is produced by the Titan Crypto Desk for educational and informational purposes only. It does not constitute financial advice or a recommendation to buy or sell any instrument. All levels and scenarios are analytical reference points, not trading instructions. Past performance of any level or scenario is not indicative of future results. Always apply your own risk management. Capital is at risk.
Wednesday 24 Jun 2026
Titan Digital Desk | Daily Framework Read | 24 June 2026
Bitcoin (BTC/USD): Pushing Higher but Sellers Lurking at the Ceiling
Spot: $108,450 | Day Change: -2.37% | Session: Pre-London
Daily Read
MOSTLY SHORT – One Layer Not Yet Confirmed
Price is pushing higher but the bigger picture is cautious. The analysis reads short coverage as the base case. Selling pressure is building. The value area high has crossed and the lens has broken down. Favour holds SHORT.
Yesterday vs Today
Monday 23 June
Bitcoin was holding relatively better than altcoins but the broader risk-off rotation was starting to weigh. The VIX spike and tech selloff were creating headwinds for digital assets.
Tuesday 24 June
Down 2.37%. The chart shows the value area high has been crossed and the lens has broken down. The framework is reading mostly short but one layer is not yet aligned. Selling pressure is building but not yet unanimous across all timeframes.
The Read
Bitcoin is at $108,450 and the framework is in an interesting position. The read is mostly short, but one layer has not yet confirmed. That distinction matters because it tells you the selloff has conviction on most timeframes but there is still a dissenting voice somewhere in the structure. That dissent usually resolves by either the holdout layer capitulating (confirming the move lower) or providing the foundation for a counter-trend bounce.
The chart shows two important developments. First, the value area high has been crossed to the downside. That is a significant structural event because the value area represents where most of the recent volume has traded. Breaking below it means the market is rejecting the recent price consensus. Second, the lens has broken down, which adds directional confirmation.
The right-hand panel on the chart is telling. Risk appetite is fading. Favour cash. The VIX has spiked. The instruction is clear: selling pressure is building and the base case favours holding SHORT coverage. This aligns with the broader risk-off tone across all asset classes.
However, Bitcoin has a history of decoupling from traditional risk assets at key inflection points. The 2.37% decline is notable but it is less severe than Ethereum’s 3.59% or Solana’s 4.20%. That relative strength could be meaningful if the broader selloff stabilises. Bitcoin tends to lead both the decline and the recovery in crypto, and the fact that it is declining less than the altcoin complex suggests there is still a structural bid underneath.
The lower section of the chart shows the underlying trend is falling and structure is behind the move. The long case here is to counter-trend, meaning any reversal attempt needs to overcome significant overhead resistance. For that reason, the framework is not suggesting active longs. Instead, it is flagging the incomplete layer as something to monitor. If it confirms short, the downside could accelerate. If it holds, it becomes the foundation for a bounce.
The next significant level below is around $105,000 to $106,500. That is where the prior consolidation base sits and where institutional interest is likely to emerge. Above, the $110,000 to $111,500 zone is now resistance.
Key Levels
| Level | Price | Significance |
|---|---|---|
| Resistance | $111,500 | Prior value area high, overhead supply zone |
| Resistance | $110,000 | Broken lens level, sell zone on retests |
| Current Price | $108,450 | Below broken structure, mostly short read |
| Support | $106,500 | Prior consolidation base |
| Support | $105,000 | Psychological round number, institutional interest |
Downside Risk
Around 55%
Most layers aligned short, risk-off environment
Bounce Risk
Around 45%
One layer uncommitted, relative strength vs altcoins
Scenario Analysis
Bear Case (Around 45%)
The uncommitted layer confirms short. Bitcoin breaks below $106,500 and extends toward $105,000. Equity selloff deepens, risk-off broadens, and crypto follows. Altcoins lead the decline with BTC following.
Base Case (Around 35%)
Bitcoin consolidates in a $106,500–$110,000 range. The uncommitted layer does not resolve in either direction. Choppy, range-bound trading as the market waits for a catalyst.
Bull Case (Around 20%)
Equity selloff stabilises and Bitcoin decouples as a flight-to-quality within crypto. BTC reclaims $110,000 and the uncommitted layer flips long. Requires a material shift in risk sentiment.
What to Watch Today
- ►Whether the uncommitted layer resolves short or holds as support
- ►BTC dominance relative to altcoins for risk appetite signal
- ►NAS100 direction as the correlation proxy for crypto
- ►Any spot ETF flow data for institutional positioning signals
This daily read is produced by the Titan Digital Desk for informational and analytical purposes only. It does not constitute financial advice or a recommendation to buy or sell any financial instrument. Markets can move against any framework. Always apply your own risk management. Capital is at risk. Titan Protect Limited.
Tuesday 23 Jun 2026
Titan Macro Desk | Daily Framework Read | 23 June 2026
Bitcoin (BTC/USD): Monday’s Divergence Has Closed
Spot: $62,475 | Day Change: -2.3% | Now Moving With Equities
Framework Read
BEARISH – Correlation Reasserting
Bitcoin held relatively well on Monday while equities sold off. That divergence is now gone. Tuesday brings Bitcoin in line with the broader risk-off move. The correlation to equities is back on.
The Read
Bitcoin at $62,475 with a 2.3% decline tells you exactly what happened overnight. Monday saw an interesting dynamic where Bitcoin was holding better than equities, with some analysts reading it as a sign of decoupling or safe haven status. That narrative did not survive the night. Tuesday’s session brought BTC back into alignment with the broader selloff.
This is the pattern to understand with Bitcoin in risk-off environments. The asset occasionally shows short-term divergence from equities, particularly in the first phase of a selloff when some capital rotates out of equities and into Bitcoin as an alternative. But when a selloff extends into a second day and the risk-off tone becomes entrenched, that divergence closes as margin calls, portfolio de-risking, and forced liquidations bring Bitcoin back in line.
The numbers today are consistent with this reading. NAS futures are down 2.5%, SP500 futures down 1.3%, and BTC is down 2.3%. That is not coincidence. Bitcoin is now trading as a risk asset in this environment, which means the VIX trajectory and equity market behaviour will determine the path for BTC.
The $62,475 level is important to watch. If equity markets see further deterioration and VIX pushes above 22, Bitcoin is unlikely to hold this level. The next meaningful support clusters for BTC are around $60,000 (the psychologically important round number) and then $58,000–$59,500 where there is structural demand from longer-term holders.
One nuance worth noting: Bitcoin’s reaction to today’s MU earnings after the close could be informative. If Micron’s results are strong (which the pre-market +6.8% suggests the market expects), that could improve tech sentiment broadly and give Bitcoin some relief heading into Wednesday’s session. A positive earnings surprise in the semiconductor space reduces the peak-growth-fear narrative.
The broader crypto complex is also worth watching. When Bitcoin falls in a risk-off environment, altcoins typically fall more. ETH and SOL will be under greater pressure than BTC. The BTC dominance ratio may actually rise today even as the price falls, which would be a sign that capital within crypto is consolidating into the relatively safer largest-cap asset.
Medium-term context: Bitcoin’s structural story around scarcity, institutional adoption, and ETF flows remains intact. The current move is tactical, driven by a broader risk-off environment rather than any fundamental change in the Bitcoin investment thesis. But that does not prevent further short-term downside if equity markets continue to deteriorate.
Key Levels
| Level | Price | Significance |
|---|---|---|
| Resistance | $64,500–$65,000 | Monday session high area, now overhead supply |
| Current Price | $62,475 | Down 2.3%, now correlating with equity selloff |
| Support | $60,000 | Major psychological level, institutional demand expected |
| Structural Support | $58,000–$59,500 | Longer-term holder demand zone, structural floor |
| Recovery Target | $65,000+ | Needed to re-establish bullish short-term structure |
Downside Risk
Around 65%
Equity correlation back on, VIX elevated
Reversal Catalyst
MU Earnings
Strong Micron results could reverse tech sentiment post-close
Scenario Analysis
Bear Case (Around 55%)
Equity selling extends through the US session. VIX moves toward 22. BTC breaks below $62,000 and tests $60,000 by the close. Altcoins drop harder. MU earnings miss expectations or guidance disappoints, adding to the risk-off pressure. BTC approaches $58,000–$60,000 zone over the following 24 hours.
Base Case (Around 30%)
BTC holds $62,000–$62,500 through the session as equity selling moderates. MU earnings are broadly in-line or slightly positive. Tech sentiment stabilises into the after-hours period. BTC ends the day near current levels without a decisive break lower.
Bull Case (Around 15%)
MU delivers a blowout earnings beat. Tech sentiment reverses sharply. BTC decouples from the equity selloff again and rallies back above $64,000 as risk appetite returns in the after-hours period. ETF inflow data shows institutional buying on the dip.
This framework read is produced by the Titan Macro Desk for informational and analytical purposes only. It does not constitute financial advice or a recommendation to buy or sell any financial instrument. Markets can move against any framework. Always apply your own risk management. Capital is at risk. Titan Protect Limited.
Monday 22 Jun 2026
Bitcoin (BTC/USD) Daily Read — Monday 22 June 2026. The Decoupling Is Not A Glitch. It Is The Signal.
Daily Ticker Read | Monday 22 June 2026
Equities went nowhere last week. Bitcoin came back from sixty-two thousand and change to sixty-four thousand four hundred and sixty-eight today, a gain of nearly three percent while the S&P printed a flat week and the Nasdaq stayed rangebound. That is not a technical quirk. That is crypto telling you it has found a separate bid. Post-OpEx, with Hormuz still live and equity positioning thin, the question is whether this is a one-session bounce or the start of something that matters. The framework thinks it matters.
Where Bitcoin Sits Right Now
| Window | Level / Move | Read |
|---|---|---|
| Spot | $64,468 | Bid. Strength on a day equities did nothing. |
| Day move | +2.97% | Not a gap, a grind. That kind of move holds better. |
| Thursday close | $62,607 | Friday OpEx base. Weekend held the level clean. |
| Week-over-week | +3.0% net | Equities flat. BTC up. That is the decoupling print. |
| Range context | Mid to upper | The range is 58k to 68k. We are sitting at the better half. |
The crypto-equity decoupling is the single most important macro signal right now. When crypto leads equities higher it tends to front-run a risk-on rotation. When it leads them lower it tends to front-run a liquidity squeeze. Right now it is leading higher while equities wait. That is a bullish interpretation until it is not.
Structural Read
The framework is reading Bitcoin as coming out of a corrective phase rather than entering a new one. The Thursday base at sixty-two thousand six hundred held even as equities continued to drift without conviction. The follow-through today, nearly three percent on normal volume, signals that the bid that was absent in the equity complex found a home in crypto instead.
The broader structural picture is constructive for the weeks ahead but not without risk. Bitcoin has spent the past three weeks between roughly fifty-eight thousand and sixty-six thousand. That is a compression range, and the move above sixty-four thousand today is testing the upper third of it. The next test is whether the sixty-five to sixty-six thousand zone, which has capped every rally attempt in June, yields on a clean daily close. If it does, the structural read flips from range-bound to breakout.
Post-OpEx dynamics are worth watching here. Options expiry stripped out a significant amount of gamma exposure on Friday. That means there is less mechanical resistance to large moves in either direction this week. A market with reduced gamma coverage is a market that can trend. Bitcoin, unlike equity indices, benefits from the removal of that dampening force because it already has more natural volatility. Less gamma protection plus a structural bid is a combination the framework takes seriously.
The crypto-equity decoupling context matters enormously here. Equities are sitting flat in part because institutional positioning is cautious. Hormuz uncertainty, post-FOMC hesitation, and an OpEx hangover have left equity desks without a clear directional catalyst. Bitcoin does not need the same catalyst. It runs on a different clock and a different liquidity pool. When those pools diverge, Bitcoin can and does trade independently. That is what today’s session showed. The framework does not read that as temporary.
There is a second structural layer. Bitcoin’s corrective move from its cycle highs established a meaningful demand zone in the fifty-eight to sixty-two thousand corridor. Every test of that corridor over the past month attracted buying. A third hold above sixty-two thousand is a higher-low pattern. Higher lows plus a test of upper range resistance is the textbook setup for a breakout attempt. The framework gives that setup a serious probability of resolution to the upside within the next two to three weeks, assuming no major macro shock.
Key Levels
| Level | Type | Why It Matters |
|---|---|---|
| $66,000 — $66,500 | June cap / resistance | This zone has turned back every intraday rally attempt in June. A daily close above it shifts the structural read to breakout. The framework wants a clean close, not just an intraday poke. |
| $64,000 | Intraday anchor | Where today’s grind settled. Bulls want this held as support on any pullback. A quick reclaim above it after dips confirms the bid is structural, not speculative. |
| $62,000 — $62,600 | OpEx base / demand zone | Thursday’s close and the level the market respected coming into the weekend. Loses this on a daily close and the decoupling narrative loses credibility. The framework stops being constructive below here. |
| $60,000 | Psychological floor | The round number every desk watches. A lose of this level on volume would trigger a re-examination of the entire range thesis. Currently well above it and not a near-term concern. |
| $68,000 — $70,000 | Upper target zone | If the breakout from the June range fires, this is the first measured-move target. The framework uses this as a swing target for the continuation thesis. |
Strategy Tiers
Bullish. Breakout Continuation.
Risk score: around 45%. Time horizon: one to two weeks.
The analysis reads this as the primary thesis. Bitcoin is leading equities, higher lows are in place, and the gamma-strip from OpEx removes mechanical resistance. If the sixty-six thousand cap breaks on volume, the move above is fast and significant.
| Entry zone | $63,500 — $64,200 on any intraday pullback |
| Stop | $61,800 daily close basis |
| Target one | $66,500 |
| Target two | $69,000 — $70,000 |
| Reward to risk | Around 2.2 to 1 to target one |
Kill conditions: Daily close below sixty-two thousand invalidates the higher-low structure. A sudden equity sell-off driven by Hormuz escalation or a credit event would drag Bitcoin with it regardless of the technical setup.
Bearish. Fade the Decoupling.
Risk score: around 55% for the short. Time horizon: three to seven days.
The contrarian read is that the decoupling resolves down rather than up. Equities have stayed flat because institutional risk appetite is genuinely absent, not because equities are about to follow Bitcoin higher. If that is the right read, Bitcoin’s bid is speculative rather than structural and the sixty-four thousand area fails on the retest.
| Entry zone | $65,500 — $66,200 on any failed breakout attempt |
| Stop | $67,000 daily close |
| Target one | $62,000 |
| Reward to risk | Around 2.5 to 1 |
Kill conditions: A daily close above sixty-six thousand five hundred invalidates the fade. An equity rally that sees SPX break through recent resistance alongside Bitcoin would confirm the bullish decoupling thesis and make the short untenable.
Time Horizons
- Intraday (24 hours): Watch the sixty-four thousand handle. A pullback that holds above sixty-three thousand five hundred and rebounds before the New York close is the signal that intraday buyers are defending the gains. A failure below sixty-three thousand on the close reopens the OpEx base retest.
- Swing (one to two weeks): The breakout or rejection from the sixty-five to sixty-six thousand zone resolves the structural question. That resolution is the trade. The framework expects it within the next two weeks given post-OpEx volatility expansion.
- Position (one month plus): The framework stays constructively bullish on Bitcoin at the position level as long as the sixty thousand handle holds on a weekly close basis. The broader trend from the cycle lows remains intact. This is not a setup to be short on a position basis unless the macro environment deteriorates materially.
Risk Score: Around 42%
Risk factors in play:
- +15% Hormuz uncertainty — an oil shock escalation drags all risk assets including crypto
- +12% Post-OpEx gamma strip — moves in either direction are amplified this week
- +8% Crypto-equity decoupling — novel regime, harder to anchor to historical precedent
- +5% Monday gap risk — opening session often sees positioning flush before trend resumes
- -10% Higher-low structure confirmed — demand zone at sixty-two thousand has been proven three times
- -8% Post-OpEx environment historically favours trend resumption in crypto
- -8% Decoupling from equities is bullish-biased historically when Bitcoin leads higher
Net: around 42%. The analysis reads this as a moderate-risk environment with a bullish lean. Not low risk, but the balance of factors favours the continuation thesis over the reversal thesis at this stage.
Catalyst Stack
Crypto-equity decoupling: This is the primary catalyst. Bitcoin at plus two point nine seven percent on a day the S&P moved less than half a percent is not noise. It reflects a separate source of demand. That demand is either institutional re-accumulation ahead of a macro re-rating, retail speculation on a narrative, or both. The framework does not need to know which one to trade the setup. The price action is the signal.
Post-OpEx dynamics: The June OpEx on Friday stripped out a significant portion of hedging activity across both equities and crypto derivatives. That leaves the market more susceptible to trending moves this week. Bitcoin options markets show a net-long gamma position after the expiry, which historically creates a buyer-of-dips dynamic as dealers rebalance their books. This is a technical tailwind for the next five to seven days.
Hormuz uncertainty: The Strait of Hormuz situation remains unresolved. An escalation that drives oil sharply higher would compress risk appetite globally and likely pull Bitcoin lower alongside equities, despite the current decoupling. The framework treats Hormuz as a binary risk event. If it stays at current tensions, Bitcoin’s independent bid holds. If it escalates into supply disruption, all risk assets including Bitcoin come under pressure. Watch this daily.
Institutional positioning post-correction: The corrective move from Bitcoin’s cycle highs created a reset in positioning. Overleveraged longs were flushed through the fifty-eight to sixty thousand zone in May. The bid that returned this week is coming from a cleaner positioning base, which means less forced selling pressure if the market moves against longs. Cleaner positioning is structurally more stable than a market carrying heavy long inventory at stretched levels.
The Broader Context
Bitcoin sits at a genuinely interesting intersection today. It has decoupled from equities on the upside, recovered to the upper half of its June range, and done so on a day when the macro backdrop provides no tailwind. That combination argues for the decoupling to be structural rather than fleeting. The June range between fifty-eight thousand and sixty-six to sixty-seven thousand has contained every move for three weeks. Today’s session pushed toward the top of it.
The session brief read the crypto complex as carrying a separate bid to equities this morning, and the close has validated that framing. The Ethereum and Solana moves today reinforce the same story from different angles. When BTC, ETH, and SOL all outperform equities on the same session, that is not coincidence. It is a rotation, and it is the framework’s job to read which way it resolves from here.
The most likely resolution over the next two weeks is one of two outcomes. Either the June range cap around sixty-six to sixty-seven thousand breaks clean and Bitcoin extends toward the sixty-eight to seventy thousand zone, or the equity market finally reconnects with crypto’s bid and both asset classes push higher together. The scenario that invalidates the constructive read is a macro shock — Hormuz escalation into active supply disruption, or an equity market decline that pulls Bitcoin back into the lower third of the June range and below sixty-two thousand.
Scenarios
| Scenario | Trigger | Probability | Target |
|---|---|---|---|
| Breakout | Daily close above $66,500 | Around 45% | $68,000 — $70,000 |
| Range continuation | Holds $62,000 — $66,000 | Around 35% | $63,000 — $65,500 oscillation |
| Range breakdown | Daily close below $62,000 | Around 20% | $58,000 — $60,000 retest |
This is analysis, not financial advice. Always manage your risk.
Thursday 18 Jun 2026
Bitcoin (BTC/USD) — Daily Framework Read | Thursday 18 June 2026
Daily Ticker Read | Thursday 18 June 2026
Bitcoin closed today at $62,607, down 2.81 percent on a day when equities recovered sharply and the VIX collapsed 9.3 percent. That divergence is the story. Every risk asset rallied except crypto. The daily read is short-biased. Structure is broken. The bounce window is narrow and the levels are clear.
Where It Sits
Bitcoin is trading at $62,607 on the 390-minute timeframe, deep inside a structure that has been breaking down for multiple sessions. The chart tells a clear story: the framework identified a value area high that was crossed and rejected, then a series of lower highs followed. The structural lens points to a broken trend. The directional bias, which synthesises momentum, structure, and the positioning of key averages, reads short. That has not changed across the last two sessions.
The most notable chart feature today is what did not happen. Equities recovered across the board. The VIX dropped 9.3 percent, the clearest single-session signal that institutional fear is being priced out of the equity market. Technology stocks led. Rotation was decisively risk-on. And yet Bitcoin fell 2.81 percent. That is not a coincidence — that is a signal. When everything that should be correlated with crypto rallies hard and crypto still sells off, the internal selling pressure is significant. The bid simply is not there.
Looking at the chart, price is below its main structural resistance zone. Multiple the structural lens annotations flagged a breakdown of a key upside structure. The value area high was crossed but then rejected cleanly, and price has been making a series of lower attempts since. The most recent candle sequence shows a small bounce into resistance that failed to hold. Everything above $64,000 is overhead supply now.
| Metric | Value | Reading |
|---|---|---|
| Price (18 Jun) | $62,607 | Down 2.81% |
| Price (17 Jun) | $64,408 | Down 1.82% |
| Two-day move | -$1,801 | Persistent selling |
| Structural bias | Short | Breakdown confirmed |
| VIX today | -9.3% | BTC failed to track recovery |
| Equity recovery | Risk-on day | BTC diverged negatively |
Yesterday vs Today
Yesterday, 17 June, Bitcoin closed at $64,408, down 1.82 percent. At that point the framework was already showing a short bias. The chart showed the the structural lens broken down annotation sitting squarely on price, and the value area high had been rejected. The read yesterday was cautious: neither side had an edge but the bigger picture was tilting short. That proved correct overnight.
Today, 18 June, the picture is materially worse. The drop from $64,408 to $62,607 is a clean $1,801 decline. More importantly, this happened on a day when every other risk asset was recovering. Yesterday’s read was cautious. Today’s read is decisively short-biased. The chart shows the the structural lens broken down label still present, and price is now testing levels that, if they fail, open the door to the next significant support cluster in the $60,000 to $61,000 zone.
The two-session sequence confirms a pattern: small bounces into resistance, rejection, continuation lower. The bounce attempts are getting weaker. Yesterday’s session saw a brief push toward $65,000 that was sold immediately. Today’s session could not even attempt that level. Sellers are controlling every attempt to recover.
Key Levels
Resistance: $64,000 to $64,500. This is the zone where yesterday’s price lived and where the framework identified overhead supply. Any attempt to recover into this zone is a short setup trigger until there is a confirmed daily close above it. Two consecutive daily closes above $64,500 would be needed to shift the structural read back to neutral.
Decision zone: $62,000 to $62,500. This is where price is sitting right now. It is the lower edge of recent consolidation. A clean break and daily close below $62,000 accelerates the move lower and removes the last meaningful short-term support before $60,500.
Support: $60,500 to $61,000. The next meaningful level below current price. The chart shows a prior consolidation base in this area. This is where a short position would look for a first target and where a potential stabilisation attempt might emerge. Below that, $58,500 comes into view.
Deep support: $58,000 to $58,500. The level that, if reached, would represent a significant breakdown of the medium-term structure and would require a fundamental reassessment of the trend. Not the base case but relevant for scenario planning.
Short Bias Setup
Continuation Short: Sell the Bounce Into $63,500 to $64,000
Risk score: around 60%
Entry: $63,500 to $64,000 on a recovery attempt that fails to produce a daily close above $64,000. Stop: $65,000 (above the overhead supply zone and the prior swing). Target one: $61,000. Target two: $59,000. Risk to reward: roughly 1:2.5 to first target, 1:5 to second target.
Why it works: The structural breakdown is confirmed. The equity recovery today failed to lift BTC, which is the strongest possible bearish divergence signal. Every bounce into the overhead supply zone is being sold. The setup uses the resistance as a trigger rather than chasing price lower. Kill condition: two consecutive daily closes above $64,500.
Long Bias Setup
Counter-Trend Long: Buy the Flush Into $60,500 Support
Risk score: around 75% — low conviction, counter-trend only
Entry: $60,500 to $61,000 only if a capitulation-style wick appears on the 390-minute chart with a sharp rejection close. Stop: $59,500 (below the support structure). Target one: $63,000. Target two: $64,000. Risk to reward: roughly 1:2 to first target.
Why it works: Only valid as a tactical bounce trade against a confirmed structural support with evidence of buyers stepping in (a wick rejection candle). This is not a trend-following trade, it is a bounce into overhead supply with tight risk. Requires active management and early exit if the structure does not recover within two sessions. Kill condition: daily close below $60,000.
Time Horizons
Intraday (zero to one day): The $62,000 pivot is the line that decides whether today becomes a grind lower or a failed breakdown recovery. Above it, price can attempt a bounce toward $63,500. Below it, the next session opens a direct test of $61,000. Most of the intraday range is likely to sit between $61,500 and $63,500 until a catalyst arrives.
Swing (two to ten days): The equity recovery narrative will take two to three more sessions to resolve. If equities continue higher and BTC continues to diverge, the short thesis strengthens materially. The swing read is short with a target cluster at $59,000 to $61,000. A reversal of the equity recovery would add further downside pressure on BTC. Resolves over the next week.
Positional (two to eight weeks): The medium-term structure has been progressively weakening since the prior highs. A monthly close below $60,000 would be a significant structural signal. A monthly close above $67,000 would be needed to revalidate the prior uptrend. The positional read is neutral with a bearish lean until either level is tested and resolved.
Risk Score
Bitcoin risk score: around 72 percent.
- Plus 25 percent for confirmed structural breakdown with the framework bias reading short across multiple sessions
- Plus 20 percent for the equity-crypto divergence today — VIX down 9.3 percent, BTC still down 2.81 percent is a significant bearish signal
- Plus 15 percent for the two-session consecutive decline of $1,801 with no meaningful bounce holding
- Plus 10 percent for overhead supply density between $64,000 and $65,000 that has been confirmed twice
- Minus 8 percent for the proximity to $60,500 to $61,000 support which may generate a tactical bounce
Elevated risk environment. The short thesis is valid but the proximity to support means entries need to be disciplined. Do not chase price lower — wait for the bounce into resistance or a confirmed break below $62,000 before adding exposure.
Scenarios
| Scenario | Trigger | Target | Probability |
|---|---|---|---|
| Continuation lower | Break and close below $62,000 | $59,000 to $60,500 | 50% |
| Range compression | Price holds $62,000 to $63,500 for two sessions | Sideways chop $61,500 to $64,000 | 30% |
| Failed breakdown recovery | Two daily closes above $64,500 | $66,000 to $67,000 | 20% |
Position Sizing
The structural read is short-biased but proximity to the $60,500 to $61,000 support zone means this is not a moment to be aggressive. The setup favours waiting for price to either bounce into the $63,500 to $64,000 resistance zone (short entry) or break cleanly below $62,000 (add to short or initiate). Neither scenario requires chasing current price.
For the short setup: risk no more than one to two percent of account on a single trade. The stop at $65,000 is approximately $2,400 from the upper entry zone, so sizing should reflect that risk quantum. The trade is a bounce-fail entry, not a breakout short, meaning patience is required before initiating.
For the counter-trend long at $60,500 to $61,000: half-size only. This is a low-conviction setup against the trend. The risk is tighter (approximately $1,000 stop), but the position should not exceed half of normal size given the bearish backdrop. Exit at first sign of failure rather than holding for the full target.
The bigger read is this: Bitcoin is the canary in the crypto coal mine right now. When it diverges negatively from equities on a clear risk-on day, that tells you institutional allocation is going to technology and growth, not to digital assets. Until that changes, keep crypto exposure conservative and let the framework decide entries rather than conviction.
The Session Read
Today was a recovery day for almost everything. The market opened with sellers and closed with buyers across equities, credit, and high-yield. The VIX told the story: a 9.3 percent collapse in implied volatility means the institutional community is removing hedges and buying risk. That should have been a tailwind for Bitcoin.
Instead, Bitcoin fell further. That is the signal. When correlation breaks down on a risk-on day and crypto is the one asset that cannot participate, the message is that the selling in crypto is internally driven, not macro-driven. Liquidity is leaving the space, or at minimum, the rotation is bypassing digital assets entirely and going directly into technology equities.
Watch the $62,000 level in Friday’s session. A hold there and a bounce toward $63,500 sets up the short entry described above. A break below $62,000 with a closing candle removes the last short-term support and puts $60,500 directly in play. Both outcomes are useful. The levels do the work.
This is analysis, not financial advice. Always manage your risk.
Thursday 18 Jun 2026
Titan Macro Desk
Bitcoin (BTC/USD) — Daily Framework Read
Thursday 18 June 2026 | Closing price: $63,832 | Correlation break session
Session Snapshot
Framework Read
Bitcoin did not bounce today. That is the headline. Equities had one of their better sessions of the month — SPY recovered, XLK added +2.78%, VIX dropped, the put-call ratio ticked down to 0.889, and fear and greed came off the lows. In every prior cycle this year, Bitcoin moved with risk-on equity days. Today it did not. That correlation break deserves close attention.
There are a few possible explanations. The most constructive reading is that Bitcoin is in a consolidation phase following the pullback from $70,000, and it simply needs more time before the next leg. Consolidation at $63,000 during an equity rally is not the same as distribution. The second, more cautious reading is that the marginal buyer for Bitcoin right now is a different type of participant than the equity buyer — perhaps the retail and speculative layer has not yet re-engaged, while institutional equity buyers are more active.
The Fear and Greed reading of 37.1 — in fear — is important context. Bitcoin’s Fear and Greed tends to be even more extreme than equity equivalents. The market-specific crypto sentiment index is likely in deeper fear territory. When equities are bouncing but crypto sentiment has not followed, it suggests that crypto-native participants are not yet convinced the risk-off period is over.
$63,832 is still above the major support cluster around $60,000. The framework does not read this as a breakdown. It reads it as a non-confirmation. One session of non-participation does not break a trend, but it adds a flag that needs resolution within the next two to three sessions.
Yesterday vs Today
| Factor | Wednesday | Thursday |
|---|---|---|
| Equity correlation | Aligned | Broken — equities up, BTC flat |
| Crypto sentiment | Cautious | Still cautious — no recovery |
| Price level | $63,000–64,000 range | $63,832 — holding range |
| Volume character | Moderate | Below average — low conviction |
Key Levels
Support
$62,000 — Near-term floor
$60,000 — Major psychological support
$57,500 — Structural demand zone
Resistance
$65,500 — Prior support cluster
$68,000 — Recovery target
$70,000 — Prior high / psychological
What to Watch Tomorrow
If equities hold gains into Friday and Bitcoin still cannot muster a meaningful recovery above $65,000, the correlation break becomes a more significant signal. Two sessions of non-participation during an equity rally is a pattern worth noting. It does not predict a crash — but it suggests Bitcoin needs its own catalyst to move, separate from the equity narrative.
Watch on-chain metrics specifically — large wallet accumulation data and exchange net flows. If wallets above 1,000 BTC are absorbing supply at current levels, that changes the picture considerably. Any regulatory headline or ETF flow data that turns positive would also be a catalyst for re-engagement.
Current Bias
Cautious — Correlation break is a framework flag
Bitcoin’s refusal to participate in today’s equity bounce is the dominant signal. $63,832 is not a breakdown level, but the non-confirmation adds caution to the framework. Resolution needed within two to three sessions. A push above $65,500 with volume confirms the bounce delayed. A failure to follow equities again on Friday shifts the read to cautious-bearish above $60,000.
This framework read is produced by the Titan Macro Desk for informational and educational purposes only. It does not constitute financial advice, a recommendation to buy or sell, or a solicitation of any investment decision. All market analysis involves judgement and uncertainty. Capital is at risk. Seek independent financial advice before making any investment decisions. For members only — not for redistribution.
Wednesday 17 Jun 2026
Titan Macro Desk · Post-Close · Wednesday 17 June 2026
Bitcoin — FOMC Day Framework Read
BTC dropped 1.82% to $64,408. The risk-off hit. But the structural story remains.
Close
$64,408
Session Change
−1.82%
Relative Strength
Held Better Than Alt
F&G Crypto
Fear
Context: Bitcoin dropped 1.82% to $64,408 on the FOMC hawkish hold. The sell-off is consistent with BTC’s increasing correlation to risk assets in macro-driven sessions. When the VIX spikes 10% and gold falls 1.68%, Bitcoin tends to follow. The correlation to risk-on/risk-off has tightened significantly since institutional adoption accelerated.
Our Framework Read
Short-Term Bias
Cautious
Structural Bias
Post-Halving Bull
Key Support
$60,000
A 1.82% move in Bitcoin is, by crypto standards, a relatively contained reaction to a significant macro event. The S&P was down 1.17%, BTC was down 1.82% — the ratio is not dramatically different from what you would expect given BTC’s beta to risk assets. This is not a sign of Bitcoin-specific weakness; it is macro correlation at work.
The structural bull case for Bitcoin in 2026 remains rooted in the halving cycle. The April 2024 halving historically precedes 12–18 months of supply compression benefits as new supply is reduced by 50%. We are approximately 14 months into that cycle. Historical halving patterns have seen the strongest price appreciation in months 12–18 post-halving.
The institutional adoption story adds another layer. Bitcoin ETFs have been absorbing consistent inflows. Corporate treasury adoption has continued. These are buyers with longer time horizons who are not going to panic-sell on a hawkish FOMC day. They provide a structural demand floor that was not present in previous cycles.
$60,000 is the critical support level our framework identifies. A close below that on a weekly basis would be a meaningful structural signal. The $64,000–$65,000 level tonight is a consolidation zone — not a signal in either direction. Watch for whether it holds through the BOE and Iran deal catalysts tomorrow.
Key Levels
| Level | Price | Context |
|---|---|---|
| Support S1 | $60,000 | Critical psychological level, significant institutional demand |
| Support S2 | $55,000 | Major structural base, high-volume accumulation zone |
| Resistance R1 | $68,000 | Pre-FOMC high, overhead supply zone |
| Resistance R2 | $73,000 | All-time high zone, requires macro tailwind |
Risk Assessment
Around 50% risk
Balanced. Short-term macro headwind (hawkish Fed, VIX elevated, risk-off) vs. structural bull case (halving cycle, institutional demand, ETF flows). The $60,000 level is the definitive test — hold it, and the bull case remains intact. Break it on a weekly close, and the picture changes materially.
This post is produced by the Titan Macro Desk for informational and educational purposes only. Nothing here constitutes financial advice. Cryptocurrency markets are highly volatile and speculative. Capital is at risk.
Wednesday 17 Jun 2026
Titan Macro Desk · Post-Close · 16 June 2026
Bitcoin (BTC/USD) — Daily Framework Read
Tuesday 16 June 2026 | FOMC Eve
The Key Signal Today
Our Read
Bitcoin held near $106K today while NAS100 reversed 670 points and SPY fell 0.6%. That non-reaction to equity weakness is information — significant information. Bitcoin did not sell off with tech stocks. The correlation that was so tight in 2022-2023 has clearly loosened.
There are two ways to interpret this. The optimistic read: Bitcoin has matured as an asset class. Institutional ownership has stabilised it. ETF flows create a structural bid that doesn’t exit on short-term equity sentiment swings. The $106K level represents genuine institutional support, not retail speculation that evaporates on bad news.
The cautious read: Bitcoin’s non-reaction to today’s equity weakness could be lag. Crypto markets sometimes trail equity moves by 12-24 hours, particularly when the selling in equities is concentrated in a single session and doesn’t represent a sustained trend change. If equities continue lower post-FOMC, Bitcoin might follow with a delay.
Our read leans toward the optimistic interpretation, but with eyes open. The $106K hold in the face of equity selling is genuinely bullish — it tells us that the sellers who would have acted today chose not to. At these institutional ownership levels, that is a meaningful signal.
FOMC tomorrow could be a net positive for Bitcoin regardless of the outcome: dovish = risk-on, which lifts crypto. Hawkish = dollar strength, which has traditionally been a headwind for Bitcoin, but the correlation is weaker now. Watch the post-FOMC BTC reaction for the updated correlation read.
Key Levels
| Level | Price | Significance |
|---|---|---|
| Resistance | $115,000 | Extension target on dovish FOMC |
| Resistance | $110,000 | Near-term breakout level |
| Held / Current | ~$106,000 | Strong hold vs equity weakness — bullish |
| Support | $100,000 | Psychological floor — institutional buy zone |
| Support | $95,000 | Structural support — hawkish scenario test |
Post-FOMC Scenarios
Dovish Fed — BTC Bullish
Risk-on environment. Dollar weakens. BTC breaks above $110K. ETF inflows accelerate. Target $115K+.
Hawkish Fed — BTC Tests Support
Dollar strengthens, risk appetite contracts. BTC tests $100K psychological level. Institutional support likely holds. Not a crash scenario — more a consolidation.
Risk Assessment
Around 45%
- Hold at $106K vs equity weakness is genuinely bullish signal
- ETF institutional bid provides structural support
- Reduced equity correlation changes risk/reward profile
- FOMC hawkish scenario tests $100K — manageable risk
This framework read is produced by the Titan Macro Desk for analytical and educational purposes only. It does not constitute financial advice or a recommendation to buy or sell any instrument. All market analysis involves uncertainty. Past framework accuracy does not guarantee future performance. Conduct your own research and consult a qualified financial adviser before making investment decisions. Capital is at risk.
Tuesday 16 Jun 2026
Titan Macro Desk · Tuesday 16 June 2026
Bitcoin (BTC/USD) — Daily Framework Read
Daily Ticker Read · Crypto Series · Published Pre-Session
Our Read — Framework Snapshot
Spot Price
$106,194
24H Volume
$1.076B
Bias
Cautiously Neutral
Key Watch
$106K Hold
What We’re Seeing
Bitcoin is sat just above $106,000 on Tuesday morning, holding a line that has mattered for the last three sessions. At $1.076 billion in daily volume, participation is not exceptional — this is a market that is thinking rather than acting.
The broader macro backdrop matters enormously here. With the FOMC decision due Wednesday, the dollar has a say in everything priced in USD — and Bitcoin is no exception. When the Fed signals rates stay higher for longer, risk assets get a knock, but crypto tends to absorb the first punch disproportionately. That is the honest risk sitting in this setup right now.
Our read is that Bitcoin is in a holding pattern. It is not breaking down, but it is not yet making a convincing case for new highs either. Equities had a strong session with NAS100 up 3.06% on Monday, and Bitcoin barely moved in sympathy. That divergence is telling — the crypto component is running on its own logic right now, which in practice means it is waiting for a catalyst rather than leading one.
Key Levels
| Level | Price | Significance |
|---|---|---|
| R2 | $112,000 | All-time high zone. Seller density high above here. |
| R1 | $108,500 | Recent session high. First real test on any push higher. |
| Current | $106,194 | Mid-range. Holding above $106K is the near-term job. |
| S1 | $104,000 | First meaningful support. Break here shifts momentum. |
| S2 | $100,000 | Psychological six-figure floor. Heavy defender level. |
| S3 | $96,000 | FOMC downside scenario. Would represent a meaningful pullback. |
The FOMC Question
Wednesday’s Fed decision is the single most important input for Bitcoin this week. The math is straightforward: if the Fed turns hawkish — signalling rates will remain elevated or that cuts are further away than the market expects — the dollar strengthens, liquidity conditions tighten, and high-beta assets including Bitcoin face selling pressure. The relationship is not perfectly linear, but it is reliable enough to treat as the base case.
A dovish surprise — hints at earlier cuts or a softening of the higher-for-longer language — would likely give Bitcoin an immediate lift. The market is not particularly positioned for that outcome right now, which makes it the higher-reward scenario if it materialises.
Our read: treat Tuesday as a waiting day. The range is well-defined. Chasing a breakout in either direction before the Fed speaks is a low-quality trade. The better opportunity comes after the dust settles Wednesday afternoon.
Volume and Participation
At $1.076 billion, volume is running below the thirty-day average for a day of this price level. This is consistent with a market that is cautious ahead of a binary event. Large participants tend to reduce exposure rather than add it before FOMC weeks — they have been through enough of these to know that being wrong is expensive.
The implication is that Tuesday’s range may be tighter than normal. Thin markets can produce sharp but ultimately meaningless moves — a sweep of $104K that immediately recovers, for instance. Do not let intraday noise dictate a bigger picture view that requires Wednesday’s data to be properly assessed.
Risk Assessment
MODERATE — Around 55%
FOMC pre-positioning, thin volume, and the divergence from equities all contribute. The $106K hold keeps this from being outright bearish, but there is no strong bullish conviction either.
Bull Scenario
Fed language is neutral or dovish. Dollar softens. BTC breaks $108,500 and attempts $112K zone. NAS100 strength starts feeding into crypto with a session lag.
Bear Scenario
Hawkish Fed, dollar bid, and BTC fails $104K. $100K becomes the magnet. A break of six figures would attract significant attention and accelerate selling.
Cross-Reference
Bitcoin does not trade in isolation. Here is what the broader picture says:
- NAS100 +3.06% Monday: Normally crypto follows equities higher with a lag. The absence of a BTC rally on Monday’s tech strength is a mild warning sign for bulls.
- VIX at 16.2: Equity volatility is contained. A VIX spike above 20 would be the trigger that hits crypto hardest — not happening yet, but FOMC can change that quickly.
- Ethereum correlation: ETH/BTC ratio is a useful intra-crypto read. If ETH is outperforming BTC, risk appetite within crypto is building. Watch that ratio for early signals before the broader move.
- Dollar Index (DXY): The primary macro input. A rising DXY is a headwind for Bitcoin. FOMC week creates the most significant DXY moves of any given month.
What Matters Next
The sequence for Bitcoin this week: Tuesday is about holding $106K. Wednesday is about reading the Fed correctly and not trading the initial reaction — the first twenty minutes after a Fed statement are often a trap in both directions. Thursday and Friday are where the real opportunity sits once the market has had time to digest.
If BTC is above $108K heading into next weekend, the picture improves materially. Below $104K after the Fed, reassess the thesis for a June push to new highs.
This publication is produced by the Titan Macro Desk for informational purposes only. Nothing in this read constitutes financial advice, a recommendation to buy or sell, or an invitation to invest. Market analysis reflects the desk’s interpretation of available data at the time of writing. All financial instruments carry risk. Past performance is not indicative of future results. Readers should conduct their own research and consult a qualified financial adviser before making any investment decisions. Prices and levels are subject to change without notice. Titan Protect is not authorised to provide investment advice.
Friday 12 Jun 2026
Bitcoin (BTC/USD) — Daily Read | Friday 12 June 2026
Ticker Read | Crypto | Alpha Insights
Session Snapshot
What Happened
Bitcoin held $61,000 through a week that broke gold. That sentence is the entire read. While precious metals suffered their worst margin liquidation event of 2026, Bitcoin absorbed the shock and held structural support. That relative strength is the most important signal on this chart.
The analysis panel reads everything bearish. VP value area high contrast visible. Multiple Titan Lines broken down. The framework is calling a downtrend. But the framework also notes genuine buying interest. That is the critical nuance. Bearish structure with genuine demand underneath means the sellers are in control of direction but the buyers are preventing acceleration.
Thursday’s panel showed the same bearish structure but with more selling pressure. Friday moderated. The transition from aggressive selling to cautious positioning is visible in the Titan Line behaviour. Lines that were breaking down on Thursday are being tested from below on Friday. Not reclaimed, but tested. That is the first step before a potential reclaim.
The broader crypto market followed risk assets lower this week. CPI at 4.2% creates a complicated environment for Bitcoin. Higher inflation supports the “digital gold” narrative but also delays rate cuts, which reduces liquidity. Bitcoin lives in that tension. It needs both the inflation story and the liquidity story to work simultaneously. Right now, it has the former but not the latter.
Day-over-Day Comparison
| Metric | Thursday 11 Jun | Friday 12 Jun | Change |
|---|---|---|---|
| Sentiment | Bearish | Bearish | Unchanged |
| Buying Interest | Present but weak | Genuine interest confirmed | Improved |
| $61K Support | Under pressure | Held | Strengthened |
| Titan Lines | Breaking down | Broken, testing from below | Stabilising |
What the Framework Shows
Relative Strength Through Crisis : The Strongest Signal
Gold lost 3.89%. Bitcoin lost 2.4% and held its key level. During a cross-asset margin liquidation event, the asset that holds up best reveals where conviction sits. Institutional holders of Bitcoin did not panic. Either they were not leveraged at these levels, or they believe in the $61K floor enough to absorb the pressure. Both interpretations are bullish for the medium term.
ETF Flow Dynamics : The Institutional Anchor
Spot Bitcoin ETF flows have created a structural demand floor that did not exist in previous cycles. Daily inflows, even when modest, create persistent buy pressure that absorbs selling. The question is whether ETF flows hold during this pullback. If they do, $61K becomes the cycle floor. If they reverse, the level breaks.
CPI Tension : Inflation Helps the Narrative, Hurts the Liquidity
CPI at 4.2% supports the Bitcoin-as-inflation-hedge argument. But it also keeps the Fed on hold, which restricts the liquidity expansion that drives speculative asset rallies. Bitcoin needs to pick a narrative. If it trades as an inflation hedge, 4.2% CPI is bullish. If it trades as a risk asset, delayed cuts are bearish. The market has not decided, and that indecision keeps price in the range.
Key Levels
| Level | Price | Significance |
|---|---|---|
| Resistance | $64,000 | First broken Titan Line. Reclaim here flips the short-term read. |
| Pivot | $61,200 | Friday close. At the structural floor. Must hold on weekly close basis. |
| Critical Support | $59,500 | Below $61K floor. Break here triggers leveraged liquidations. |
| Extension | $57,000 | Worst case on full risk-off. Would test ETF holder conviction. |
| Recovery Target | $66,500 | Pre-crash level. Full recovery requires macro sentiment shift. |
Scenarios
ETF flows hold. Institutional interest confirmed. Bitcoin grinds toward $64K. Relative strength narrative attracts new capital from gold refugees.
$59.5K-$64K range. Market digests the cross-asset shock. No directional conviction. Weekend flows muted.
Weekend selling pressure breaks $61K. Leveraged positions liquidate. $59.5K then $57K. ETF outflows would confirm capitulation.
Risk Score
Why around 55%: The analysis reads bearish but with genuine buying interest underneath. That combination deserves a moderate risk score rather than an elevated one. Bitcoin outperformed gold during the worst week of the quarter. The $61K level has now been tested and held. Weekend liquidity risk keeps the score above 50 because crypto markets never close, and thin weekend books can produce outsized moves.
Alpha Insights : Friday 12 June 2026. For informational purposes only. Not financial advice. All trading involves risk of loss.
Friday 5 Jun 2026
Bitcoin (BTC/USD) — Daily Read | Friday 5 June 2026
Titan Protect Alpha Insights | Rates Repricing Day | analysis as of pre-market 5 June 2026
Market Context
Bitcoin fell 5.26% on Friday, among the largest single-day declines in the crypto complex, as the hot US NFP print shattered near-term rate-cut expectations and removed a key pillar of the crypto bull thesis. Bitcoin has evolved into a risk-on asset in the modern macro framework — it rallies when liquidity expectations are loose and falls when they tighten. Friday was a textbook tightening signal.
The institutional adoption narrative that has driven Bitcoin’s rally through 2025-26 — ETF inflows, corporate treasury allocation, and sovereign wealth fund interest — has been built on a foundation of expected monetary easing that supports risk appetite broadly. When that foundation is challenged, institutional holders with tighter risk management frameworks reduce exposure, and the leverage inherent in crypto markets amplifies the move.
Bitcoin remains technically above its long-term structural support, and the halving cycle that occurred in April 2024 historically provides a multi-month constructive backdrop. The question is whether the near-term rates shock interrupts this longer cycle or merely creates a temporary corrective phase. The answer depends on how durable Friday’s NFP-driven hawkish repricing turns out to be.
Liquidity expectations tightening = headwind for Bitcoin. However, the medium-term cycle structure remains intact. This selloff may represent a shakeout rather than a trend reversal — context matters enormously.
Key Levels
| Level | Price (USD) | Significance |
|---|---|---|
| Resistance 2 | 108,500 | Pre-selloff high and prior ATH zone |
| Resistance 1 | 105,000 | 20-day average and key overhead level |
| Close / Pivot | 102,400 | Friday close and immediate reference |
| Support 1 | 98,000 | Psychological six-figure support and structural floor |
| Support 2 | 93,500 | Major demand zone — loss changes medium-term structure |
Weekend Setup
Bitcoin trades 24/7, so the weekend is not a pause for this market. Watch the 98,000 level as the critical floor. A hold above six figures heading into Monday’s Wall Street open would be a constructive signal. A break below 98,000 over the weekend would signal accelerating selling pressure and could target 93,500 before any recovery attempt.
Weekend Bitcoin moves often exaggerate the direction of the preceding week’s sentiment because institutional participants reduce their hedging activity over weekends, leaving the market more susceptible to retail-driven momentum. This cuts both ways — sharp weekend recoveries and extensions are both possible.
ETF inflow data for the week will be published Monday morning and will provide an important read on whether institutional demand is absorbing the selling pressure.
Risk Note: Bitcoin is an exceptionally volatile asset. Weekend gap moves can exceed 10% with minimal warning. Do not hold leveraged positions over weekends without clear stop-loss levels. The 24/7 nature of crypto means there is no resting period for your risk.
This content is for informational and educational purposes only. It does not constitute financial advice, a personal recommendation, or a solicitation to buy or sell any financial instrument. Past performance is not a reliable indicator of future results. Trading involves significant risk of loss. Cryptocurrency markets are highly speculative and unregulated in many jurisdictions. Always conduct your own research and consult a qualified financial adviser before making investment decisions. Titan Protect Alpha Insights is not authorised or regulated by the Financial Conduct Authority.
Friday 5 Jun 2026
Bitcoin (BTC) — Daily Read | Thursday 4 June 2026
Published: Thursday 4 June 2026 | Titan Protect Alpha Insights
Bitcoin is sitting at $63,645, down 0.58% on the day. That is a relatively contained decline in context: the broader crypto complex is under more pressure, and Bitcoin’s relative stability at this level suggests the $60,000 floor continues to attract buyers. However, the MicroStrategy-related news of a $10.8 billion unrealised loss adds a near-term narrative overhang that the market is pricing in cautiously.
What the Analysis Shows
Bitcoin’s ability to hold above $63,000 despite Ethereum falling 2%, Solana under pressure, and broader risk uncertainty around NFP is a sign of relative strength within the crypto complex. Institutional holders through spot ETFs provide a structural demand base that did not exist in previous cycles. The ETF inflows represent genuine buy-and-hold demand rather than leveraged speculative positions.
The MSTR $10.8 billion unrealised loss figure sounds alarming but is a paper loss rather than a realised one. MicroStrategy (now known as Strategy) has explicitly committed to its Bitcoin holding strategy and has not been a forced seller. The number matters because it creates sentiment-driven selling pressure from those who fear they might become a forced seller, which is a secondary effect rather than a direct one.
Bias: Cautiously Neutral. $60,000 is the floor that matters. Above it, Bitcoin is stabilising. Below it, the narrative shifts to a correction scenario. NFP tomorrow will test whether macro risk appetite holds or retreats, which directly affects Bitcoin’s near-term direction.
Key Levels
| Level | Price | Significance |
|---|---|---|
| Support 1 | $61,000 | Near-term demand zone |
| Support 2 | $60,000 | Critical psychological floor |
| Resistance 1 | $65,500 | Near-term recovery target |
| Resistance 2 | $68,000 | Breakout level, medium-term target |
Tomorrow’s Setup
NFP is the macro trigger. A soft print that boosts risk appetite could push Bitcoin back toward $65,500. A hot print that tightens financial conditions would test $61,000 support quickly. Watch whether the $60,000 level holds on any morning weakness; a clean hold there would be a structurally positive signal.
Risk Note: Bitcoin trades 24/7 and can move significantly on weekend thin liquidity. NFP-driven macro volatility on Friday can cascade into crypto markets over the weekend. The MSTR unrealised loss situation is a secondary risk that could become primary if Bitcoin approaches levels that change the company’s liquidity calculations.
This analysis is for informational purposes only and does not constitute financial advice. Markets involve risk. Past performance is not indicative of future results. Always conduct your own due diligence before making any investment decisions.
Thursday 4 Jun 2026
Bitcoin (BTC/USD)
Daily Read — Wednesday 3 June 2026
Current Price
$65,681
Daily Change
-1.53%
What Happened Today
Bitcoin fell 1.53% to $65,681 as the broader risk-off environment hit crypto alongside equities. Bitcoin has increasingly traded as a risk asset in short-term moves — when equities sell off sharply on macro data, BTC typically follows. The ISM miss was the trigger and the correlation held today.
The $65,000 level is a significant psychological and technical level. It has attracted both buyers and sellers on multiple tests this year. Today’s close near $65,681 suggests that buyers stepped in near the $65K level, which is an encouraging sign for the near-term support story.
The broader institutional adoption narrative, ETF demand, and the post-halving supply dynamics remain intact as structural supports. The 1.53% daily move is relatively modest by Bitcoin standards — this is not a panic sell. It is a macro-correlated pullback within what remains an elevated price environment.
Key Levels
| Level | Price | Significance |
|---|---|---|
| Resistance | $68,500 | Prior session high / supply zone |
| Pivot | $65,681 | Current close |
| Support 1 | $65,000 | Round number demand |
| Support 2 | $62,000 | Structural base |
Current Bias
Macro correlation is the short-term driver. Structural support is real but a risk-off week is a headwind. $65K hold is the key signal to watch.
What to Watch Tomorrow
- $65,000 round number hold — the near-term bull case depends on this
- Equity market direction as the correlated macro driver
- Bitcoin ETF flow data if available — institutional demand signal
- Friday NFP and its impact on risk appetite broadly
Risk Assessment
Elevated. Around 60% risk environment. High macro correlation in risk-off periods amplifies the downside if the equity selloff deepens. Bitcoin is not the safe haven it was often marketed as during equity stress.
This content is for informational purposes only and does not constitute financial advice. Past performance is not indicative of future results. Trading involves risk of loss. Always conduct your own research before making any investment decisions.
Tuesday 2 Jun 2026
Solana (SOL/USD) — Daily Framework Read | Tuesday 2 June 2026
Solana (SOL/USD) | Post Close Setup Daily Read | Data basis: 2026-06-02 close
Where It Sits
Structure
Structurally Solana (SOL/USD) has pulled back into the session close. The broader trend remains intact on the daily timeframe but the shorter timeframe has softened. The structure is contested near the 74.8400 level.
Momentum
Momentum is firm with the daily timeframe showing clear acceleration. Internal readings sit in the upper portion of the range. The risk is not that momentum fails but that it stalls at round-number resistance and triggers profit-taking.
Volume & Flow
Flow on the session close was measured. Positioning data suggests steady accumulation rather than aggressive directional commitment. The pattern supports continuation rather than reversal.
Key Levels
| Level | Type | Significance | Action Zone |
|---|---|---|---|
| 84.08 | Resistance | Upper range target, prior supply zone | Take profits / fade if rejected |
| 77.92 | Pivot | Mid-range continuation marker | Hold = constructive; lose = consolidation |
| 74.84 | Session close | Reference anchor for next session | Above = continuation; below = mean revert |
| 69.91 | Support | Recent range floor, demand zone | Buy zone with defined stop |
| 63.75 | Major support | Prior breakout retest level | Stop-out below for longs |
Three Scenarios
Continuation
Solana (SOL/USD) holds 74.8400 and pushes higher on continued institutional flow and positive macro mood. The 24/7 tape supports trending moves when traditional markets are risk-on.
Range
Solana (SOL/USD) churns around 74.8400. Range-bound without a fresh catalyst. Weekend liquidity dynamics can create noise.
Mean Reversion
Solana (SOL/USD) fades on a risk-off shift or specific headline, breaks support. Crypto gives back faster than it gains — size discipline essential.
Risk Score
Risk sits at Around 60%
Risk sits around 60 per cent. Vix at 15.7 supports a measured risk posture. sentiment at 57 is neutral. Crypto carries 24/7 liquidity risk and higher-beta positioning. Standard sizing with defined stops — discipline beats conviction.
How to Walk It
Entry / Stop / Target structure:
- Long 69.91 pullback | Stop 63.75 | Target 77.92 | R:R 2:1
- Long 77.92 breakout | Stop 74.84 | Target 84.08 | R:R 1.5:1
- Fade 84.08 rejection | Stop above resistance | Target 74.84 | R:R 2:1
Experience-level guidance:
Beginner: Reduce size to half your standard. Trade only the cleanest setup from the entries above. If the tape opens against your bias, do nothing — wait for the second hour, when the institutional flow has tipped its hand.
Intermediate: Use the levels table to define the trading range. Fade the extremes with defined stops, take profits before the round-number resistance levels.
Advanced: The vol regime supports defined-risk structures around the key pivot levels. Keep notional small relative to your book — asymmetric speculation, not core positioning.
Continue Reading
The macro frame driving this read is unpacked in the session briefs:
Check the latest session briefs on the site.
This analysis is for educational and informational purposes only. It does not constitute financial advice. Always manage your risk independently and in accordance with your own financial circumstances.
Tuesday 2 Jun 2026
Dollar Index (DXY) — Daily Framework Read | Tuesday 2 June 2026
Dollar Index (DXY) | Post Close Setup Daily Read | Data basis: 2026-06-02 close
Where It Sits
Structure
Structurally Dollar Index (DXY) sits above its short-term moving averages with the daily trend firmly higher. The recent advance has been orderly with no signs of distribution or topping behaviour. The reference anchor at 99.1980 acts as the bias line.
Momentum
Momentum is neutral with internal readings near the centre of the range. That is the signature of a market digesting the prior move. The tape needs a fresh catalyst to commit to direction.
Volume & Flow
Volume data is limited for this session. The positioning read is neutral — no obvious skew in either direction. Watch for flow confirmation on the next session.
Key Levels
| Level | Type | Significance | Action Zone |
|---|---|---|---|
| 99.62 | Resistance | Upper range target, prior supply zone | Take profits / fade if rejected |
| 99.34 | Pivot | Mid-range continuation marker | Hold = constructive; lose = consolidation |
| 99.20 | Session close | Reference anchor for next session | Above = continuation; below = mean revert |
| 98.97 | Support | Recent range floor, demand zone | Buy zone with defined stop |
| 98.69 | Major support | Prior breakout retest level | Stop-out below for longs |
Three Scenarios
Continuation
Dollar Index (DXY) holds the session close at 99.1980 and pushes higher on continued positioning flow. The broader trend remains intact. Watch the dollar tape for confirmation.
Range
Dollar Index (DXY) opens flat and ranges around 99.1980. Neither side has conviction without a fresh data catalyst. Range trade dominates.
Mean Reversion
Dollar Index (DXY) breaks below support on a shift in dollar positioning. Mean reversion within the broader trend. Watch for a clean test of support before committing.
Risk Score
Risk sits at Around 45%
Risk sits around 45 per cent. Vix at 15.7 supports a measured risk posture. sentiment at 57 is neutral. Currency pairs carry intervention and data-release headline risk. Standard sizing with defined stops — discipline beats conviction.
How to Walk It
Entry / Stop / Target structure:
- Long 98.97 pullback | Stop 98.69 | Target 99.34 | R:R 2:1
- Long 99.34 breakout | Stop 99.20 | Target 99.62 | R:R 1.5:1
- Fade 99.62 rejection | Stop above resistance | Target 99.20 | R:R 2:1
Experience-level guidance:
Beginner: Reduce size to half your standard. Trade only the cleanest setup from the entries above. If the tape opens against your bias, do nothing — wait for the second hour, when the institutional flow has tipped its hand.
Intermediate: Use the levels table to define the trading range. Fade the extremes with defined stops, take profits before the round-number resistance levels.
Advanced: The vol regime supports defined-risk structures around the key pivot levels. Keep notional small relative to your book — asymmetric speculation, not core positioning.
Continue Reading
The macro frame driving this read is unpacked in the session briefs:
Check the latest session briefs on the site.
This analysis is for educational and informational purposes only. It does not constitute financial advice. Always manage your risk independently and in accordance with your own financial circumstances.