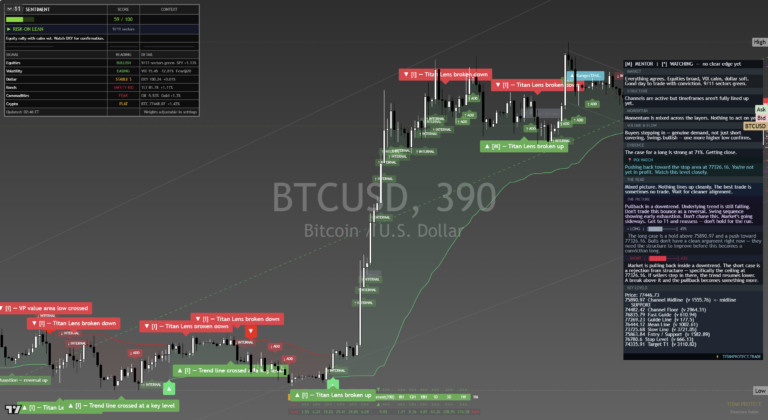
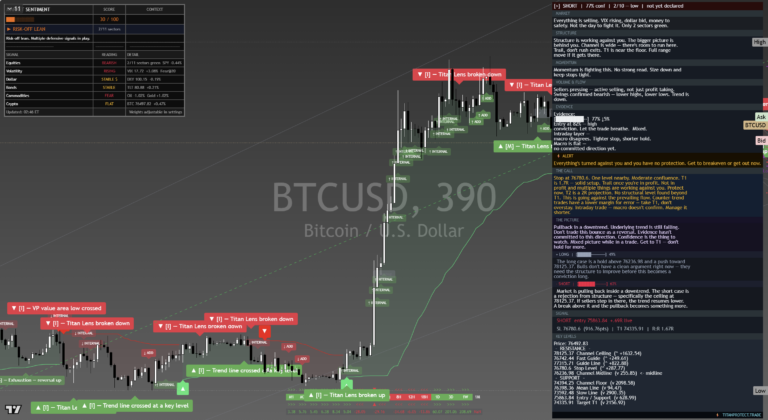
The Bitcoin Framework Journal for May 2026, newest read at the top. Each dated entry is our read on the close, kept as a living record so the framework can be judged over time. This is analysis, not financial advice.
Saturday 30 May 2026
Bitcoin (BTC/USD) — Daily Read | Saturday 30 May 2026
Bitcoin (BTC/USD) | Post Close Setup Daily Read | Data basis: 2026-05-30 close
Where It Sits
Structure
Structurally Bitcoin (BTC/USD) has pulled back into the session close. The broader trend remains intact on the daily timeframe but the shorter timeframe has softened. The structure is contested near the 73,336 level.
Momentum
Momentum is neutral with internal readings near the centre of the range. That is the signature of a market digesting the prior move. The tape needs a fresh catalyst to commit to direction.
Volume & Flow
Flow on the session close was measured. Positioning data suggests steady accumulation rather than aggressive directional commitment. The pattern supports continuation rather than reversal.
Key Levels
| Level | Type | Significance | Action Zone |
|---|---|---|---|
| 75,800 | Resistance | Upper range target, prior supply zone | Take profits / fade if rejected |
| 74,200 | Pivot | Mid-range continuation marker | Hold = constructive; lose = consolidation |
| 73,336 | Session close | Reference anchor for next session | Above = continuation; below = mean revert |
| 72,000 | Support | Recent range floor, demand zone | Buy zone with defined stop |
| 70,300 | Major support | Prior breakout retest level | Stop-out below for longs |
Three Scenarios
Continuation
Bitcoin (BTC/USD) holds 73,336 and pushes higher on continued institutional flow and positive macro mood. The 24/7 tape supports trending moves when traditional markets are risk-on.
Range
Bitcoin (BTC/USD) churns around 73,336. Range-bound without a fresh catalyst. Weekend liquidity dynamics can create noise.
Mean Reversion
Bitcoin (BTC/USD) fades on a risk-off shift or specific headline, breaks support. Crypto gives back faster than it gains — size discipline essential.
Risk Score
Risk sits at Around 65%
Risk sits around 65 per cent. Vix at 15.4 supports a measured risk posture. sentiment at 61 is in greed territory. Crypto carries 24/7 liquidity risk and higher-beta positioning. Standard sizing with defined stops — discipline beats conviction.
How to Walk It
Entry / Stop / Target structure:
- Long 72,000 pullback | Stop 70,300 | Target 74,200 | R:R 2:1
- Long 74,200 breakout | Stop 73,336 | Target 75,800 | R:R 1.5:1
- Fade 75,800 rejection | Stop above resistance | Target 73,336 | R:R 2:1
Experience-level guidance:
Beginner: Reduce size to half your standard. Trade only the cleanest setup from the entries above. If the tape opens against your bias, do nothing — wait for the second hour, when the institutional flow has tipped its hand.
Intermediate: Use the levels table to define the trading range. Fade the extremes with defined stops, take profits before the round-number resistance levels.
Advanced: The vol regime supports defined-risk structures around the key pivot levels. Keep notional small relative to your book — asymmetric speculation, not core positioning.
Continue Reading
The macro frame driving this read is unpacked in the session briefs:
Check the latest session briefs on the site.
This analysis is for educational and informational purposes only. It does not constitute financial advice. Always manage your risk independently and in accordance with your own financial circumstances.
Thursday 28 May 2026
Solana (SOL/USD) — Daily Framework Read | Thursday 28 May 2026
Solana (SOL/USD) | Post Close Setup Daily Read | Data basis: 2026-05-28 close
Where It Sits
Structure
Structurally Solana (SOL/USD) has pulled back into the session close. The broader trend remains intact on the daily timeframe but the shorter timeframe has softened. The structure is contested near the 82.0000 level.
Momentum
Momentum is neutral with internal readings near the centre of the range. That is the signature of a market digesting the prior move. The tape needs a fresh catalyst to commit to direction.
Volume & Flow
Flow on the session close was measured. Positioning data suggests steady accumulation rather than aggressive directional commitment. The pattern supports continuation rather than reversal.
Key Levels
| Level | Type | Significance | Action Zone |
|---|---|---|---|
| 86.11 | Resistance | Upper range target, prior supply zone | Take profits / fade if rejected |
| 83.37 | Pivot | Mid-range continuation marker | Hold = constructive; lose = consolidation |
| 82.00 | Session close | Reference anchor for next session | Above = continuation; below = mean revert |
| 79.81 | Support | Recent range floor, demand zone | Buy zone with defined stop |
| 77.07 | Major support | Prior breakout retest level | Stop-out below for longs |
Three Scenarios
Continuation
Solana (SOL/USD) holds 82.0000 and pushes higher on continued institutional flow and positive macro mood. The 24/7 tape supports trending moves when traditional markets are risk-on.
Range
Solana (SOL/USD) churns around 82.0000. Range-bound without a fresh catalyst. Weekend liquidity dynamics can create noise.
Mean Reversion
Solana (SOL/USD) fades on a risk-off shift or specific headline, breaks support. Crypto gives back faster than it gains — size discipline essential.
Risk Score
Risk sits at Around 65%
Risk sits around 65 per cent. Vix at 15.7 supports a measured risk posture. sentiment at 60 is in greed territory. Crypto carries 24/7 liquidity risk and higher-beta positioning. Standard sizing with defined stops — discipline beats conviction.
How to Walk It
Entry / Stop / Target structure:
- Long 79.81 pullback | Stop 77.07 | Target 83.37 | R:R 2:1
- Long 83.37 breakout | Stop 82.00 | Target 86.11 | R:R 1.5:1
- Fade 86.11 rejection | Stop above resistance | Target 82.00 | R:R 2:1
Experience-level guidance:
Beginner: Reduce size to half your standard. Trade only the cleanest setup from the entries above. If the tape opens against your bias, do nothing — wait for the second hour, when the institutional flow has tipped its hand.
Intermediate: Use the levels table to define the trading range. Fade the extremes with defined stops, take profits before the round-number resistance levels.
Advanced: The vol regime supports defined-risk structures around the key pivot levels. Keep notional small relative to your book — asymmetric speculation, not core positioning.
Continue Reading
The macro frame driving this read is unpacked in the session briefs:
Check the latest session briefs on the site.
This analysis is for educational and informational purposes only. It does not constitute financial advice. Always manage your risk independently and in accordance with your own financial circumstances.
Thursday 28 May 2026
Dollar Index (DXY) — Daily Framework Read | Thursday 28 May 2026
Dollar Index (DXY) | Post Close Setup Daily Read | Data basis: 2026-05-28 close
Where It Sits
Structure
Structurally Dollar Index (DXY) has pulled back into the session close. The broader trend remains intact on the daily timeframe but the shorter timeframe has softened. The structure is contested near the 99.0020 level.
Momentum
Momentum is neutral with internal readings near the centre of the range. That is the signature of a market digesting the prior move. The tape needs a fresh catalyst to commit to direction.
Volume & Flow
Volume data is limited for this session. The positioning read is neutral — no obvious skew in either direction. Watch for flow confirmation on the next session.
Key Levels
| Level | Type | Significance | Action Zone |
|---|---|---|---|
| 99.90 | Resistance | Upper range target, prior supply zone | Take profits / fade if rejected |
| 99.30 | Pivot | Mid-range continuation marker | Hold = constructive; lose = consolidation |
| 99.00 | Session close | Reference anchor for next session | Above = continuation; below = mean revert |
| 98.52 | Support | Recent range floor, demand zone | Buy zone with defined stop |
| 97.92 | Major support | Prior breakout retest level | Stop-out below for longs |
Three Scenarios
Continuation
Dollar Index (DXY) holds the session close at 99.0020 and pushes lower on continued positioning flow. The broader trend remains intact. Watch the dollar tape for confirmation.
Range
Dollar Index (DXY) opens flat and ranges around 99.0020. Neither side has conviction without a fresh data catalyst. Range trade dominates.
Mean Reversion
Dollar Index (DXY) breaks below support on a shift in dollar positioning. Mean reversion within the broader trend. Watch for a clean test of support before committing.
Risk Score
Risk sits at Around 50%
Risk sits around 50 per cent. Vix at 15.7 supports a measured risk posture. sentiment at 60 is in greed territory. Currency pairs carry intervention and data-release headline risk. Standard sizing with defined stops — discipline beats conviction.
How to Walk It
Entry / Stop / Target structure:
- Long 98.52 pullback | Stop 97.92 | Target 99.30 | R:R 2:1
- Long 99.30 breakout | Stop 99.00 | Target 99.90 | R:R 1.5:1
- Fade 99.90 rejection | Stop above resistance | Target 99.00 | R:R 2:1
Experience-level guidance:
Beginner: Reduce size to half your standard. Trade only the cleanest setup from the entries above. If the tape opens against your bias, do nothing — wait for the second hour, when the institutional flow has tipped its hand.
Intermediate: Use the levels table to define the trading range. Fade the extremes with defined stops, take profits before the round-number resistance levels.
Advanced: The vol regime supports defined-risk structures around the key pivot levels. Keep notional small relative to your book — asymmetric speculation, not core positioning.
Continue Reading
The macro frame driving this read is unpacked in the session briefs:
Check the latest session briefs on the site.
This analysis is for educational and informational purposes only. It does not constitute financial advice. Always manage your risk independently and in accordance with your own financial circumstances.
Thursday 28 May 2026
Solana (SOL/USD) — Daily Framework Read | Thursday 28 May 2026
Solana (SOL/USD) | Pre Asia Setup Daily Read | Data basis: 2026-05-28 close
Where It Sits
Structure
Structurally Solana (SOL/USD) has pulled back into the session close. The broader trend remains intact on the daily timeframe but the shorter timeframe has softened. The structure is contested near the 82.4300 level.
Momentum
Momentum is positive but measured. The advance has been orderly without stretching the range. Internal readings are constructive without flagging exhaustion — supportive of continuation.
Volume & Flow
Flow on the session close was measured. Positioning data suggests steady accumulation rather than aggressive directional commitment. The pattern supports continuation rather than reversal.
Key Levels
| Level | Type | Significance | Action Zone |
|---|---|---|---|
| 86.08 | Resistance | Upper range target, prior supply zone | Take profits / fade if rejected |
| 83.65 | Pivot | Mid-range continuation marker | Hold = constructive; lose = consolidation |
| 82.43 | Session close | Reference anchor for next session | Above = continuation; below = mean revert |
| 80.48 | Support | Recent range floor, demand zone | Buy zone with defined stop |
| 78.05 | Major support | Prior breakout retest level | Stop-out below for longs |
Three Scenarios
Continuation
Solana (SOL/USD) holds 82.4300 and pushes higher on continued institutional flow and positive macro mood. The 24/7 tape supports trending moves when traditional markets are risk-on.
Range
Solana (SOL/USD) churns around 82.4300. Range-bound without a fresh catalyst. Weekend liquidity dynamics can create noise.
Mean Reversion
Solana (SOL/USD) fades on a risk-off shift or specific headline, breaks support. Crypto gives back faster than it gains — size discipline essential.
Risk Score
Risk sits at Around 65%
Risk sits around 65 per cent. Vix at 16.3 supports a measured risk posture. sentiment at 61 is in greed territory. Crypto carries 24/7 liquidity risk and higher-beta positioning. Standard sizing with defined stops — discipline beats conviction.
How to Walk It
Entry / Stop / Target structure:
- Long 80.48 pullback | Stop 78.05 | Target 83.65 | R:R 2:1
- Long 83.65 breakout | Stop 82.43 | Target 86.08 | R:R 1.5:1
- Fade 86.08 rejection | Stop above resistance | Target 82.43 | R:R 2:1
Experience-level guidance:
Beginner: Reduce size to half your standard. Trade only the cleanest setup from the entries above. If the tape opens against your bias, do nothing — wait for the second hour, when the institutional flow has tipped its hand.
Intermediate: Use the levels table to define the trading range. Fade the extremes with defined stops, take profits before the round-number resistance levels.
Advanced: The vol regime supports defined-risk structures around the key pivot levels. Keep notional small relative to your book — asymmetric speculation, not core positioning.
Continue Reading
The macro frame driving this read is unpacked in the session briefs:
Check the latest session briefs on the site.
This analysis is for educational and informational purposes only. It does not constitute financial advice. Always manage your risk independently and in accordance with your own financial circumstances.
Thursday 28 May 2026
Dollar Index (DXY) — Daily Framework Read | Thursday 28 May 2026
Dollar Index (DXY) | Pre Asia Setup Daily Read | Data basis: 2026-05-28 close
Where It Sits
Structure
Structurally Dollar Index (DXY) sits above its short-term moving averages with the daily trend firmly higher. The recent advance has been orderly with no signs of distribution or topping behaviour. The reference anchor at 99.1700 acts as the bias line.
Momentum
Momentum is neutral with internal readings near the centre of the range. That is the signature of a market digesting the prior move. The tape needs a fresh catalyst to commit to direction.
Volume & Flow
Volume data is limited for this session. The positioning read is neutral — no obvious skew in either direction. Watch for flow confirmation on the next session.
Key Levels
| Level | Type | Significance | Action Zone |
|---|---|---|---|
| 99.56 | Resistance | Upper range target, prior supply zone | Take profits / fade if rejected |
| 99.30 | Pivot | Mid-range continuation marker | Hold = constructive; lose = consolidation |
| 99.17 | Session close | Reference anchor for next session | Above = continuation; below = mean revert |
| 98.96 | Support | Recent range floor, demand zone | Buy zone with defined stop |
| 98.70 | Major support | Prior breakout retest level | Stop-out below for longs |
Three Scenarios
Continuation
Dollar Index (DXY) holds the session close at 99.1700 and pushes higher on continued positioning flow. The broader trend remains intact. Watch the dollar tape for confirmation.
Range
Dollar Index (DXY) opens flat and ranges around 99.1700. Neither side has conviction without a fresh data catalyst. Range trade dominates.
Mean Reversion
Dollar Index (DXY) breaks below support on a shift in dollar positioning. Mean reversion within the broader trend. Watch for a clean test of support before committing.
Risk Score
Risk sits at Around 50%
Risk sits around 50 per cent. Vix at 16.3 supports a measured risk posture. sentiment at 61 is in greed territory. Currency pairs carry intervention and data-release headline risk. Standard sizing with defined stops — discipline beats conviction.
How to Walk It
Entry / Stop / Target structure:
- Long 98.96 pullback | Stop 98.70 | Target 99.30 | R:R 2:1
- Long 99.30 breakout | Stop 99.17 | Target 99.56 | R:R 1.5:1
- Fade 99.56 rejection | Stop above resistance | Target 99.17 | R:R 2:1
Experience-level guidance:
Beginner: Reduce size to half your standard. Trade only the cleanest setup from the entries above. If the tape opens against your bias, do nothing — wait for the second hour, when the institutional flow has tipped its hand.
Intermediate: Use the levels table to define the trading range. Fade the extremes with defined stops, take profits before the round-number resistance levels.
Advanced: The vol regime supports defined-risk structures around the key pivot levels. Keep notional small relative to your book — asymmetric speculation, not core positioning.
Continue Reading
The macro frame driving this read is unpacked in the session briefs:
Check the latest session briefs on the site.
This analysis is for educational and informational purposes only. It does not constitute financial advice. Always manage your risk independently and in accordance with your own financial circumstances.
Tuesday 26 May 2026
Bitcoin (BTC/USD)
CORRECTION UNDERWAY
Friday Close · 25 May 2026 · 390-min
The Read
Bitcoin crossed a key trend line at the highs and the move lower since then has been consistent and structured. Multiple levels of support have given way with limited resistance from buyers. The selling is not panic — it is orderly, which is actually more concerning from a bull’s perspective. Panic selling exhausts itself quickly. Orderly distribution takes time and tends to result in deeper corrections before buyers regain control. The framework has flagged broken structure at each level on the way down, confirming the shift in momentum.
The bigger picture context matters enormously here. Bitcoin at these levels is trading in territory it has never seen before this cycle. There is no historical blueprint for what “normal” support and resistance looks like above $100,000. What the framework can tell you is where the prior swing lows are, where value areas formed during the initial push up, and where institutional positioning shifts. Right now, the value area low from the earlier consolidation is the next meaningful reference point. That is where the more significant buying decision needs to be made.
The “HP value as high crossed” signal near the lows of the current session is worth noting. That indicates price has entered a zone where the short-term chart is stretched to the downside. It does not mean buy immediately — it means the risk-reward of shorting here has deteriorated, and a bounce back to test broken structure from below is the more likely near-term path. Patient traders wait for that bounce and then reassess whether to fade it or ride a continuation of the larger downtrend.
Key Levels
| Level | Price | Notes |
|---|---|---|
| Short Entry | $109,800 | Bounce into broken structure zone |
| Stop | $111,500 | Above trend line break level |
| Target 1 | $105,500 | Value area low from prior base |
| R:R | 2.5:1 | Based on defined entry zone |
Risk
Around 60% — Bitcoin corrections in bull markets can be sharp and fast in both directions. The downside structure is real, but a single macro headline — ETF flow data, a sovereign buying announcement, or a regulatory development — can reverse a 5% drop in minutes. The lack of historical precedent at these price levels also means support zones are less tested than they would be at lower prices.
Experience Guidance
Bitcoin at all-time high territory is a masterclass in patience versus impulsiveness. Every sharp dip feels like the start of a crash; every bounce feels like the resumption of the bull run. Neither extreme is usually correct. The traders who do well in this environment are the ones who defined their levels before the move, not during it. If you do not have a clear plan for where you enter, where you stop out, and where you take profit — written down before you open the trade — then Bitcoin in a correction is not where you want to be discovering your plan on the fly.
Saturday 23 May 2026
Bitcoin (BTC/USD) — Weekend Daily Read
Framework Bias
LONG BIAS
Bitcoin at $75,188 is holding just below the $76,000 level that has been acting as short-term resistance. The 0.40% Friday dip is entirely within normal daily volatility for BTC and does not alter the structural picture. The asset has held above $75,000 after the recent rally, which is constructive. Each day it holds above a level, that level becomes more entrenched as support.
The macro backdrop is Bitcoin-positive right now. Dollar weakness is the primary driver. Gold at $4,521 and BTC at $75,188 are telling the same story: large pools of capital are moving away from US dollar-denominated assets as a primary store of value. These are two different expressions of the same institutional repositioning theme.
The US Bitcoin ETF ecosystem has fundamentally changed the dynamics of the asset. Institutional inflows into spot BTC ETFs have created a new class of patient, long-term buyers who buy the dips rather than panic-selling them. That changes the shape of BTC corrections. Corrections are shorter and shallower than they were in the 2020-2021 cycle. The framework reflects that structural change by maintaining a long bias until the trend is clearly broken.
Key Levels
| Level Type | Price | Note |
|---|---|---|
| Major Resistance | $80,000 | Round number and prior all-time high zone |
| Near Resistance | $76,000 | Near-term ceiling and short-term high cluster |
| Near Resistance | $75,570 | Friday session high |
| Current Price | $75,188 | Friday close |
| Near Support | $74,500 | Round number and intraday demand cluster |
| Key Support | $72,000 | Prior consolidation and weekly demand |
| Major Support | $68,000 | Monthly structural demand and prior breakout |
Trade Framework
| Scenario | Entry Zone | Stop | Target | R:R |
|---|---|---|---|---|
| Long on weekend dip | $73,500 to $74,500 | $71,500 | $79,000 | approx 2.8:1 |
| Long on $76,000 break and hold | $76,200 | $74,500 | $80,500 | approx 2.5:1 |
| Short on major rejection | $79,500 to $80,000 | $81,500 | $74,000 | approx 4.0:1 |
Confidence level: around 65%. The macro alignment (weak dollar, risk-on equities, institutional ETF flows) supports the long bias. The 65% reflects BTC’s inherent volatility and the risk that weekend thin trading produces exaggerated moves that briefly breach support levels before recovering. The structural bias is clear; the short-term path can be noisy.
Weekend Context
The weekend is when BTC and crypto markets can move the most, precisely because institutional participation drops and retail and algorithmic flows dominate. This creates opportunities but also risks. The most common weekend pattern for BTC in a bull trend is a brief dip into support on Saturday or Sunday followed by recovery into Monday. That sets up clean long entries for those watching the levels.
The BTC halving event, which occurred in April 2024, has historically been followed by a 12-18 month bull run. If that historical pattern holds, the current cycle has runway into late 2025 or early 2026. At $75,188, BTC is already above its pre-halving peak but the post-halving cycles have consistently seen the asset go significantly higher from the halving level before the cycle peaks. That pattern is the bull case’s strongest argument.
Watch on-chain metrics over the weekend. Whale wallet movements (addresses holding over 1,000 BTC) are publicly visible and can indicate whether large holders are accumulating or distributing. Any significant exchange inflow from large wallets would be a warning sign; continued exchange outflows indicate holders are choosing to keep BTC in self-custody, which is historically bullish.
Friday 22 May 2026
CRYPTO | Friday 22 May 2026
Bitcoin: Range-Bound at $77,700 with No Clear Catalyst to Break It
Thursday close: $77,714 | Daily change: +0.31% | Bias: Neutral, Compression Watch
Current Read
Bitcoin is going nowhere and doing it very consistently. The 0.31% Thursday gain barely moves the needle on a chart that has been consolidating in a range for the better part of two weeks. The compression is real, and compression in markets does not last indefinitely. When Bitcoin has spent this long in a tight range before, the eventual break has tended to be decisive and in the direction of the prevailing trend before the consolidation began.
The prevailing trend coming into this consolidation was up. Bitcoin moved from the high fifties to the high seventies over the preceding months before stalling here. The bulls have work to do to resume that move, but the consolidation does not indicate that the move is over. It indicates that buyers and sellers have reached temporary equilibrium at a level where both sides have conviction.
What is interesting about $77,700 is what it represents in the broader context: it is above the all-time highs of the previous cycle and is therefore in price discovery territory. In price discovery, there are no historical resistance levels to reference in the traditional sense. The market is deciding what value looks like here for the first time, which explains why the ranges can be wide and the moves once they occur can be larger than historical patterns would suggest.
Key Levels
What Changed Thursday
Very little. The 0.31% gain is noise in the context of Bitcoin’s typical daily volatility. ETH’s slightly stronger 0.46% performance on the same day suggests the broader crypto market is in a similar state: constructive but without conviction. There were no major regulatory announcements, no significant exchange movements, and no meaningful changes in on-chain activity that would signal a breakout is imminent.
The macro backdrop remains broadly supportive for Bitcoin. A dollar sitting below 100, gold holding at elevated levels, and global liquidity conditions that have not materially tightened all point toward a constructive environment for risk assets including crypto. The issue is that none of these factors are new, which means they are already priced. A fresh catalyst is what would break the range.
Friday Scenarios
Bull Case
Bitcoin pushes above $79,000 and forces a test of $80,000. A close above $80,000 would be a significant development that resets the narrative from “consolidation” to “continuation.” Requires positive macro conditions, perhaps dollar weakness or equity strength, to provide the fuel. Thin Friday volume could amplify any move above $79,000 as stops are triggered.
Base Case
Another day of range trading between $76,500 and $79,000. The range continues. Weekend approaches and crypto traders, who unlike FX and equity traders face no market close, may reduce positioning going into Saturday. Volume tends to drop on Friday afternoons in crypto, which keeps moves contained. Most likely outcome.
Bear Case
A break below $76,000 would represent a false range breakout to the downside and would attract short sellers. Target in this scenario is $73,500. The trigger would need to be either a significant risk-off macro event or a crypto-specific shock. The probability is lower than the base case, but the move would be sharper than the base case non-event.
Sizing and Approach
Bitcoin in a compression range is not the time for large directional bets. The right approach depends entirely on your time horizon. If you are a day trader, the range edges at $76,000 and $79,000 are the obvious reactive trade locations. If you are a longer-term holder, nothing about this week changes the medium-term picture and there is no urgency to act.
For new entries, the range is $3,000 wide. That is enough to stop out a tight stop twice before any directional move materialises. Position sizing needs to account for Bitcoin’s noise relative to your stop placement. Chasing the midpoint of a range in either direction is the most common way to get hurt in this environment.
Cross-References
- ETH: Ethereum tracking slightly stronger. If ETH breaks higher first, it often precedes Bitcoin moves in the current cycle. Watch the ETH breakout as a leading signal.
- DXY: Dollar weakness below 100 is part of what has kept Bitcoin supported. If DXY breaks above 100, broad risk assets including Bitcoin would face selling pressure.
- Gold: Both gold and Bitcoin have been bid in an environment of dollar uncertainty. They are correlated in the current regime, which is unusual historically but has been persistent in 2025-26.
- SOL and XRP: Altcoin performance provides a read on risk appetite within crypto. Altcoins rallying more than Bitcoin signals a risk-on crypto environment.
Wednesday 20 May 2026
TITAN PROTECT — DIGITAL FLOW · 20 MAY 2026
BTC Holds $76K While the Smart Money Sits on the Fence
Bitcoin has not broken down. It has also not broken out. The institutional positioning tells you exactly why — and what needs to change for either move to stick.
Digital Asset Snapshot — 20 May 2026
| Asset | Price | 24h | Key Level | Bias |
|---|---|---|---|---|
| Bitcoin (BTC) | $76,680 | -0.21% | $75,000 support | Neutral — watching |
| Ethereum (ETH) | $2,107 | Flat | $2,000 key floor | Neutral |
| Solana (SOL) | $83.94 | Flat | $80 support | Watch $90 breakout |
| XRP | ~$2.39 | +0.10% | $2.20 support | Relative strength |
| Avalanche (AVAX) | $9.10 | Flat | $9.00 floor | Weak relative to BTC |
| BNB | ~$690 | -0.15% | $670 support | Neutral |
Bitcoin: The COT Picture Is Complicated
CME Bitcoin futures tell you more about institutional intent than price action alone. As of the latest data, dealers are net long 3,946 contracts — that is the commercial tier of the market sitting on the long side of crypto. Asset managers hold a net long of 5,800 contracts. Both of those are constructive readings.
But the leveraged fund book — the hedge funds and CTAs — are net short 11,169 contracts. That is a significant short position from the most active speculative players. This split is the reason BTC has not gone anywhere: the structural longs from institutions are being offset by speculative shorts. The resolution of that tension is what drives the next meaningful move.
Historically when you see this configuration — institutional longs, leveraged shorts — the most likely outcome is a squeeze higher rather than a breakdown. The institutions tend to be right at major inflection points. The leveraged community tends to be late. But the timing of that squeeze is unknown, and it will not happen quietly.
BTC COT Positioning Breakdown
| Participant Type | Net Position | Signal |
|---|---|---|
| Dealers (commercial) | +3,946 long | Constructive — smart money long |
| Asset managers | +5,800 long | Institutional conviction holds |
| Leveraged funds (hedge funds) | -11,169 short | Speculative short — squeeze risk if BTC breaks higher |
Ethereum, Solana, XRP: Three Very Different Stories
Ethereum at $2,107 is in no-man’s land. The $2,000 level has held as a floor for weeks, which is constructive. But ETH has underperformed BTC significantly in this cycle, and the lack of a catalyst for outperformance remains the key problem. If BTC squeezes higher, ETH will follow with a lag. If BTC stalls, ETH will drift.
Solana at $83.94 is the one to watch for a breakout. The $80 support has been tested twice in the past week and held both times. A move above $90 would bring significant short covering from leveraged books and could accelerate quickly. Solana tends to move in 15–25% impulses when it breaks structure.
XRP showing relative strength at +0.10% when BTC is flat and the broader market is under pressure is notable. XRP’s legal clarity has brought in a different class of buyer — one less sensitive to macro risk-off. The $2.20 support has been well-defended. Near-term range is $2.20–$2.60 with a bias to the upside if volume picks up.
The Macro Link You Cannot Ignore
US household equity holdings are now up $4 trillion year-to-date. Since 2023, they have added $31 trillion. Households now own roughly 40% of the equity market. This matters for crypto because retail crypto buyers and retail equity holders are the same population. When equity portfolios feel good, retail allocates to crypto. When they do not, crypto is the first thing sold.
The 0.67% equity sell-off yesterday was not catastrophic — but it came with a sentiment backdrop of Fear and Greed at 60.6 (greed territory) against a VIX that suggested more caution. That divergence has not resolved. Until it does, the risk-on bid into crypto has a ceiling.
Trade Setups by Experience
New Traders
BTC spot hold: $76,680 is above the $75,000 floor. Hold existing longs with a hard stop below $74,500. Do not add size at current levels — wait for a clean break above $78,000 to confirm momentum.
Risk: Around 40%. Macro headwinds from bond yields could trigger a broader de-risking.
Intermediate
SOL breakout play: Entry $90.50 on break and close above $90. Stop $87.00. Target $104. R:R 3.8:1. Leveraged shorts get squeezed on this level.
XRP long: Entry $2.39, stop $2.18, target $2.65. R:R 1.2:1. Conservative. Risk: Around 35% — relative strength is the edge here.
Advanced
BTC squeeze trade: Long BTC at current levels, targeting a leveraged fund short squeeze above $79,000. Entry $76,700, stop $74,400, target $82,000. R:R 2.3:1.
Hedge: Small AVAX/ETH short as relative-weakness pairs against BTC long. Risk on combined position: Around 45%.
Scenario Analysis
Bull case (35%): Equity markets stabilise, sentiment gap (VIX vs F&G) resolves upward, leveraged BTC shorts squeezed above $78,000. SOL breaks $90. ETH follows BTC with a lag. Full risk-on rotation into digital assets.
Base case (45%): BTC oscillates $74,000–$78,500 range for the next 5–7 sessions. Leverage shorts hold, institutional longs hold, no resolution. Alts underperform BTC. Patient traders wait.
Bear case (20%): Bond yield escalation triggers cross-asset de-risking. BTC drops through $75,000, tests $70,000–$71,000 zone. Leveraged longs (not shorts) get flushed first. Alts lose 20–30% quickly. The macro tail wags the crypto dog.
Position Sizing Guide
| Account | Max Risk/Trade | BTC CFD | SOL / XRP |
|---|---|---|---|
| £2,000 | £40 (2%) | 0.0005 BTC equiv | £40 max across alts |
| £10,000 | £200 (2%) | 0.003 BTC equiv | £100 per alt max |
| £50,000+ | £1,000 (2%) | 0.013 BTC equiv | £400 per alt max |
Cross-References
- → Sentiment layer: F&G 60.6 vs VIX 18.06 gap — sentiment is not supportive of aggressive crypto longs until this resolves
- → Global grid: S&P breadth divergence (29 days of breadth vs price disconnect) — retail equity sentiment is fragile, same pool as crypto buyers
- → Institutional layer: SpaceX IPO selection — Goldman-led. Risk appetite event that could pull capital from crypto into IPO allocation
- → Basis (Post 10): BTC COT dealer long mirrors gold dealer positioning — both suggesting institutional accumulation at these levels
Session Reference Times
| Asia Open (BTC most active) | 01:00 BST / 02:00 CEST / 20:00 ET (prior eve) |
| London Open | 08:00 BST / 09:00 CEST / 03:00 ET |
| New York Open (volume peak) | 14:30 BST / 15:30 CEST / 09:30 ET |
For educational purposes only. Not financial advice. Crypto assets are highly volatile and unregulated. Capital is at significant risk.
Tuesday 19 May 2026
Bitcoin Struggles at $77,000 After $500M Sunday Liquidation Leaves No Recovery
Monday 18 May 2026 | Crypto | BTC/USD
Session Summary
Bitcoin closed Monday at $77,091, down 0.44% on the day. The session opened at $77,415 and reached a high of $77,674 before sellers stepped in and pushed price to an intraday low of $76,052 — a range of over $1,600. The close near the session midpoint offers no clear directional conviction. What makes this reading harder is the context: Sunday saw an estimated $500 million in leveraged liquidations across the crypto market, and Monday’s action showed no meaningful recovery from that event. Volume of $43.5 billion across the 24-hour window was substantial, confirming the liquidation was real and not a data artefact.
Daily Read
A $500 million liquidation event typically resets the market’s leverage profile. The expectation after such an event is that the path of least resistance clears somewhat — the forced sellers are out, the weak hands are washed, and price can begin to recover. The fact that Bitcoin did not recover on Monday is therefore a bearish signal. It suggests either that selling pressure from non-leveraged holders continued through Monday, or that the liquidity on the bid side is insufficient to absorb ongoing distribution from larger participants.
The broader macro context is mixed for Bitcoin. Fear and greed sits at 61.8 (greed territory), which historically has been associated with mid-cycle risk-on behaviour. However, gold’s advance today — a safe haven asset — running alongside Bitcoin’s flat-to-negative performance represents a textbook risk-off signal from institutional allocators who are choosing hard assets over crypto. When gold and Bitcoin diverge in favour of gold, the crypto market tends to follow the risk asset playbook rather than the store-of-value narrative.
Key Levels
| Level | Price | Context |
|---|---|---|
| Resistance | $78,000 — $78,500 | Above Monday’s high; reclaiming this zone signals recovery mode |
| Support / Entry | $76,000 — $76,500 | Monday’s intraday low zone; where buyers showed up earlier today |
| Stop (long from support) | $74,500 | A daily close below $76,000 opens a potential flush to the $74,000 — $75,000 region |
| Target 1 | $78,000 | Retest of Monday’s open area; R:R approximately 1.3:1 |
| Target 2 | $80,000 | Round-number target; R:R approximately 2.7:1 — only valid if $78,500 breaks cleanly |
Tomorrow’s Setup
Bias: Cautiously bearish in the absence of recovery signals. The failure to bounce after a major liquidation event shifts the burden of proof back to bulls — they need to show up convincingly above $77,500 to reassert control.
- Bull scenario: Asian session opens above $77,500 and drives toward $78,500. A clean break of $78,500 with volume would signal the liquidation lows are in and a run toward $80,000 is underway.
- Bear scenario: Overnight trade drifts below $76,000, the Monday low. A break and hold below $76,000 targets the $74,000 — $75,000 support cluster quickly. That is a 2 — 3% downside from current levels.
- Context: Bitcoin’s correlation with equity risk is elevated right now. Watch equity index futures in the Asian session as an early read on BTC’s direction.
Experience Guidance
New to crypto trading: After a $500 million liquidation event, the instinct is to buy the dip — but the absence of a Monday bounce means the dip may not be done yet. Wait for Tuesday to show its hand first.
Developing trader: The gold vs Bitcoin divergence today is a clean signal to read — when gold goes up and Bitcoin goes nowhere, the market is choosing institutional safety over speculative risk.
Experienced trader: The failure to recover after a liquidation flush is the highest-quality short signal in crypto. If $76,000 breaks on Tuesday with volume, that is a structured short with $74,500 as the target and $77,500 as the stop.
This content is for informational and educational purposes only and does not constitute financial advice. Past performance is not indicative of future results. All trading involves risk. Crypto markets are highly volatile. Always conduct your own research before making any investment decisions.
Monday 18 May 2026
Bitcoin Struggles at $77,000 After $500M Sunday Liquidation Leaves No Recovery
Monday 18 May 2026 | Crypto | BTC/USD
Session Summary
Bitcoin closed Monday at $77,091, down 0.44% on the day. The session opened at $77,415 and reached a high of $77,674 before sellers stepped in and pushed price to an intraday low of $76,052 — a range of over $1,600. The close near the session midpoint offers no clear directional conviction. What makes this reading harder is the context: Sunday saw an estimated $500 million in leveraged liquidations across the crypto market, and Monday’s action showed no meaningful recovery from that event. Volume of $43.5 billion across the 24-hour window was substantial, confirming the liquidation was real and not a data artefact.
Daily Read
A $500 million liquidation event typically resets the market’s leverage profile. The expectation after such an event is that the path of least resistance clears somewhat — the forced sellers are out, the weak hands are washed, and price can begin to recover. The fact that Bitcoin did not recover on Monday is therefore a bearish signal. It suggests either that selling pressure from non-leveraged holders continued through Monday, or that the liquidity on the bid side is insufficient to absorb ongoing distribution from larger participants.
The broader macro context is mixed for Bitcoin. Fear and greed sits at 61.8 (greed territory), which historically has been associated with mid-cycle risk-on behaviour. However, gold’s advance today — a safe haven asset — running alongside Bitcoin’s flat-to-negative performance represents a textbook risk-off signal from institutional allocators who are choosing hard assets over crypto. When gold and Bitcoin diverge in favour of gold, the crypto market tends to follow the risk asset playbook rather than the store-of-value narrative.
Key Levels
| Level | Price | Context |
|---|---|---|
| Resistance | $78,000 — $78,500 | Above Monday’s high; reclaiming this zone signals recovery mode |
| Support / Entry | $76,000 — $76,500 | Monday’s intraday low zone; where buyers showed up earlier today |
| Stop (long from support) | $74,500 | A daily close below $76,000 opens a potential flush to the $74,000 — $75,000 region |
| Target 1 | $78,000 | Retest of Monday’s open area; R:R approximately 1.3:1 |
| Target 2 | $80,000 | Round-number target; R:R approximately 2.7:1 — only valid if $78,500 breaks cleanly |
Tomorrow’s Setup
Bias: Cautiously bearish in the absence of recovery signals. The failure to bounce after a major liquidation event shifts the burden of proof back to bulls — they need to show up convincingly above $77,500 to reassert control.
- Bull scenario: Asian session opens above $77,500 and drives toward $78,500. A clean break of $78,500 with volume would signal the liquidation lows are in and a run toward $80,000 is underway.
- Bear scenario: Overnight trade drifts below $76,000, the Monday low. A break and hold below $76,000 targets the $74,000 — $75,000 support cluster quickly. That is a 2 — 3% downside from current levels.
- Context: Bitcoin’s correlation with equity risk is elevated right now. Watch equity index futures in the Asian session as an early read on BTC’s direction.
Experience Guidance
New to crypto trading: After a $500 million liquidation event, the instinct is to buy the dip — but the absence of a Monday bounce means the dip may not be done yet. Wait for Tuesday to show its hand first.
Developing trader: The gold vs Bitcoin divergence today is a clean signal to read — when gold goes up and Bitcoin goes nowhere, the market is choosing institutional safety over speculative risk.
Experienced trader: The failure to recover after a liquidation flush is the highest-quality short signal in crypto. If $76,000 breaks on Tuesday with volume, that is a structured short with $74,500 as the target and $77,500 as the stop.
This content is for informational and educational purposes only and does not constitute financial advice. Past performance is not indicative of future results. All trading involves risk. Crypto markets are highly volatile. Always conduct your own research before making any investment decisions.
Sunday 17 May 2026
BITCOIN : Friday 16 May 2026
Ticker Review | Crypto | Alpha Insights
Week at a Glance
What Happened
Bitcoin fell 1.32% on Friday. On a day when silver collapsed 9.13% and gold lost 2.61%, a 1.32% decline looks orderly. It is.
But do not confuse outperforming gold and silver with being in a strong position. The comparison is misleading. Gold fell because of institutional distribution. Silver fell because of leveraged liquidation cascade. Bitcoin fell because it is a risk asset and the macro environment pushed risk assets lower. Three different mechanisms. Different recovery timelines.
The funding rate is the signal that matters most here. It turned negative this week at -0.012% per eight hours. That annualises to approximately -13.1%. The prior 30-day average was +0.018% per eight hours. The swing from positive to negative means leveraged longs are being flushed. The market is pricing a discount on perpetual futures relative to spot. That discount is being paid to anyone willing to hold spot and short the perpetual : approximately 13.1% annualised.
The October 2023 analogue is instructive. Similar macro configuration: DXY strengthening, rates elevated. BTC funding bottomed near -0.025% before a four-to-five day normalisation that led to a sharp recovery. The current reading of -0.012% is early-to-mid stage. The flush is not complete. You wait.
What the Alpha Insights Said
Positioning Read : No Institutional Bid in Crypto
$11.88 billion moved through dark pools on Friday. Zero went into crypto. Institutions bought NVDA, SPX, and energy. They were not accumulating digital assets. When you have a session with massive institutional activity and zero of it touches your asset class, that tells you where the institutional conviction sits. It is not here. Not yet.
Basis Edge : October 2023 Analogue and Delta-Neutral Opportunity
The Basis Edge analysis identified the BTC funding flush as the primary signal. -0.012% per eight hours is meaningful but not at exhaustion. The October 2023 analogue saw funding bottom near -0.025% before the normalisation turn. There is a delta-neutral carry opportunity available right now: spot long, perpetual short, collect the negative funding. But this requires active management and small sizing. The directional long is not ready yet.
Digital Flow : Risk Asset, Not Digital Gold
The Digital Flow analysis made a critical distinction. Bitcoin outperformed gold on Friday by more than one percentage point. That is not the digital gold thesis being validated. Gold fell because of institutional distribution. Bitcoin fell because of retail risk sentiment. Two different mechanisms with different recovery timelines. The institutional bid that will eventually drive BTC recovery is currently sitting in equities, not crypto.
Global Grid : Dollar Is the Primary Headwind
DXY at 99.27 is the upstream driver of the crypto decline. Dollar strength creates a mathematical headwind for all globally-held USD-denominated assets. Bitcoin is held globally. When the dollar bids, every dollar-priced asset faces the same currency headwind. DXY 98.80 is the master switch. Below that level, the dollar headwind lifts. Above it, BTC faces continued pressure from the macro environment.
Sentiment Read : Crowd Has Not Reached Panic
Fear and Greed dropped only 1.6 points despite assets falling 1-9%. The crowd has not reached genuine fear levels. In the October 2023 analogue, the recovery came after sentiment deteriorated further toward fear territory. The current reading suggests the flush has not reached maximum retail capitulation. You want to see more pain before the recovery bet is worth making.
Key Levels
| Level | Price / Rate | Significance |
|---|---|---|
| Resistance | $82,000 | Upper bound of current range. Recovery targets here on macro resolution. |
| Friday Close | $78,025 | Current price. Orderly flush in progress. |
| Support | $72,000 | April recovery buyer entry zone. Liquidation triggers concentrate here. |
| Danger Level | $70,000 | Below here, Scenario C. April recovery buyers face liquidation. |
| Flush Floor Signal | -0.025% / 8hr | October 2023 analogue : funding bottomed here before recovery. Watch for this level. |
| Recovery Signal | -0.005% / 8hr | Funding normalising through here = leveraged flush transitioning to exhaustion. Directional long becomes valid. |
Signal + Bias
Basis Trade: Buy spot BTC, short equivalent BTC perpetual futures. Collect negative funding rate of approximately 13.1% annualised at current -0.012% per 8hr rate. Exit when funding crosses back through -0.005% toward zero. Small sizing, active management required. This earns regardless of price direction : it is purely a funding rate play.
The directional long is not ready. Funding at -0.012% is early-to-mid stage. The October 2023 analogue shows the floor was near -0.025%. You have room left in this flush.
The macro resolution has not happened either. FOMC minutes on Wednesday determine whether the equity institutional thesis is confirmed or challenged. BTC correlates with equities at high levels right now. You need to know which direction equities resolve before making a directional bet on BTC.
The basis trade is the play. It earns while you wait. It gives you exposure to the mechanical recovery without betting on direction. When the directional signal triggers (funding through -0.005%), you transition to the long.
Next Week Setup
Monitor the funding rate every eight hours. It is the primary signal. -0.025% is the historical floor where the flush typically exhausts. -0.005% is the normalisation signal where you transition to directional long.
Sunday futures open at 18:00 ET is the first test. BTC follows ES with four-to-six times beta. If ES opens flat to positive, BTC should stabilise around $77,000-$78,000. If ES gaps down more than 0.5%, BTC faces further pressure toward $74,000-$75,000.
FOMC minutes on Wednesday 14:00 ET is the primary macro resolution event. If hawkish, 10Y toward 4.65%, VIX above 20, BTC toward $70,000-$72,000. If the minutes are a hawkish-hold (growth strong, no cuts, no hikes), the institutional equity thesis is confirmed and BTC follows equities higher. That is the recovery scenario.
NVDA earnings in late May is a secondary BTC catalyst. If NVDA beats and the tech rally accelerates, the NDX-BTC correlation pulls BTC higher. BTC’s correlation with NDX is running high in the current macro configuration.
Three Scenarios for BTC Next Week
Funding reaches -0.025% floor, normalises through -0.005%. FOMC hawkish-hold. BTC recovers toward $80,000-$82,000. Transition to directional long on funding normalisation signal.
BTC ranges $74,000-$79,000. Funding drifts toward -0.025%. No directional conviction until FOMC Wednesday. Basis trade collects funding. ETH continues underperforming.
10Y toward 4.65%, VIX above 20. BTC toward $70,000-$72,000. Funding deepens. April recovery buyer liquidation triggers. Basis trade position at risk from counterparty stress. Close basis positions if VIX breaks 20.
Risk Score
Why around 45%: The flush is orderly, not panic. The structure has completion signals that are identifiable. October 2023 analogue is constructive. But the funding is early-to-mid stage. The macro contradiction is unresolved until Wednesday. No institutional dark pool support confirmed yet. VIX at 18.43 adds beta amplification risk. The situation is watch-and-wait, not act.
The Signal Chain
- Watch funding every 8 hours. Current: -0.012%.
- Flush floor signal: -0.025%. Not yet reached.
- Recovery signal: funding normalises through -0.005%.
- Directional long trigger: funding at -0.005% AND FOMC minutes not hawkish.
- Until then: basis trade only, small sizing, active management.
Alpha Insights : Friday 16 May 2026. For informational purposes only. Not financial advice. All trading involves risk of loss.
Saturday 16 May 2026
Bitcoin (BTC/USD) — Daily Read | Friday 15 May 2026
Friday close | BTC $79,105 (-2.40%) | Risk-off correlated, divergence from prior week finally closed | Not financial advice
WHAT CHANGED FROM YESTERDAY
Yesterday BTC was at the high end of the week’s range, up 2.86% on the CPI-driven risk-on wave. The Overwatch noted that BTC’s divergence from SPX — which had built through the early part of the week — had been closed by Thursday. BTC was moving in sync with equities on positive macro catalysts. Today that sync is confirmed on the downside. BTC closed at $79,105, down 2.40%, mirroring the equity sell-off that took SPY down 1.20% and QQQ down 1.51%. The BTC-SPX correlation that the Overwatch tracked is working symmetrically: up with risk-on, down with risk-off. The divergence story from earlier in the week is resolved.
HEADLINE STATE: RISK-OFF CORRELATED — BTC -2.40% Tracking Equities Lower
$79,105 at the weekly close. BTC fell harder than SPY (-2.40% vs -1.20%) but less hard than QQQ (-1.51%) or IWM (-2.41%). BTC’s beta on risk-off days is typically 1.5-2x equities. Today it is closer to 2x SPY but inline with IWM — which is consistent with BTC’s risk-asset character. The $79,105 close is above $80,000 round number support — or rather, just below it. This is a level watch. $80,000 psychological support is now being tested from below on a weekly close. That is a structurally important position to hold or lose into Monday.
| Metric | Thu 14 May | Fri 15 May | Note |
|---|---|---|---|
| BTC/USD | ~$81,000 (+2.86%) | $79,105 (-2.40%) | Below $80K round number |
| BTC vs SPY | +2.86% vs +0.78% | -2.40% vs -1.20% | BTC beta ~2x equity |
| BTC-SPX correlation | Divergence closed (Overwatch) | Correlation confirmed symmetric | Both up and down in sync |
| $80K level | Above | $79,105 — just below | Weekly close below $80K |
KEY LEVELS INTO NEXT WEEK
- $80,000 — the round number that was just lost at the weekly close. Reclaim it Monday and the close is a wick. Lose it and it becomes resistance.
- $79,105 — Friday close, immediate reference. Monday open relative to this tells you overnight sentiment.
- $82,000-83,000 — resistance zone above. Needed to restore the Thursday bullish narrative.
- $76,000-77,000 — deeper structural support if the sell-off extends. The prior accumulation zone from earlier in the week.
OVERWATCH CONTEXT
The Overwatch noted the BTC divergence as closed by Thursday — the prior week’s narrative of BTC outperforming equities had compressed. Friday confirms the correlation is now symmetrical: BTC moves with the macro risk environment, both up and down. This is not the BTC that trades independently on crypto-specific catalysts. This is BTC as a risk-asset proxy. In that regime, what matters for BTC is what matters for equities: VIX direction, dollar direction, and growth data quality. The same playbook that governs SPY and QQQ governs BTC until the correlation breaks again.
WHAT TO WATCH NEXT WEEK
- $80,000 reclaim on Monday — the single most important price level for BTC next week. Holds $80K and the weekly close is noise. Loses it and the sell-off continues.
- Equity recovery or extension lower drives BTC in the same direction at ~2x beta. Watch QQQ first.
- Any BTC-specific catalyst (ETF flows, institutional announcement, regulatory news) can break the equity correlation temporarily.
- ETH vs BTC relative performance next week — if ETH falls harder than BTC, it confirms risk-off. If ETH leads recovery, it is risk-on.
Friday 15 May 2026 | Not financial advice. For informational purposes only.
Friday 15 May 2026
Bitcoin (BTC) — Daily Read | Friday 15 May 2026
Post-CPI close | $81,255 — D- to B in four days, breadth restored | Not financial advice
WHAT CHANGED FROM YESTERDAY
Yesterday the read confirmed the 3-day divergence had formally reversed. BTC was at $81,542 (+2.86%) mid-session, having come from a three-session lag where it refused to follow equities higher. The close landed at $81,255 (+2.49%) — slightly off the mid-session high, which is normal profit-taking after an event-driven spike. What the Overwatch added is the significance of this recovery: BTC went from a D- grade to a B grade in four days. That is the fastest recovery in the Overwatch grid’s 2026 record. When BTC rejoins a risk-on move from a multi-session divergence on a macro confirmation day like CPI, the Overwatch is explicit that the macro event was real and the breadth is now genuine. The $80,000 level is the tripwire the Overwatch identified: a close below $80K reopens the divergence question.
HEADLINE STATE: BREADTH RESTORED — Divergence Closed, $80K Is the Line to Hold
BTC at $81,255 after a three-session divergence resolving bullishly on CPI day is the most significant cross-asset breadth signal of the week. When the most risk-sensitive liquid asset in the world rejoins a risk-on thesis that was already confirmed by equities, commodities, and FX, it means the macro event was real — not a narrow sector story. ETH at $2,308 (+2.22%) confirms it was not just BTC. The whole crypto complex moved. The Overwatch said this is the breadth signal that makes the 8/3/1 grid credible: eight instruments agreeing, including the one that had been most visibly disagreeing, is a much stronger signal than seven instruments with one holdout. The holdout came back. That matters.
Key Levels
| Level | Price | Significance |
|---|---|---|
| Thursday close | $81,255 | +2.49% — divergence closed, breadth signal confirmed |
| Grid tripwire | $80,000 | Overwatch: daily close below reopens breadth divergence question |
| Strong RS upside | $83,000–$85,000 | Retail Sales confirms demand — risk appetite extends into crypto |
| Consolidation range | $79,500–$82,000 | Friday expiry + data day = position management, not trend extension |
| ETH | $2,308 (+2.22%) | Broad crypto bid confirmed — not just BTC, breadth is real |
| Macro direction | Still falling on higher timeframe | Recovery is within a macro downtrend — short-term and medium-term in conflict |
Structure · Momentum · Flow
Structure
Short-term recovering. Medium-term (higher timeframe macro direction) still falling. The divergence resolution is a short-term win, not a macro trend reversal. Do not confuse the two timeframes.
Momentum
Short-term positive. The three-session divergence reversed cleanly on above-average volume on CPI day. The move was not a squeeze — it was genuine participation. Positive momentum confirmed above $80K.
Flow
Risk-on flow returned on CPI confirmation. Institutional macro accounts that had reduced crypto exposure during the divergence are rebuilding. ETH’s parallel move (+2.22%) confirms the flow is sector-wide, not BTC-specific.
| Bias | LONG SHORT-TERM — $80K is the line that matters |
| Risk estimate | Around 35% — short-term/medium-term conflict, $80K tripwire proximity |
| Must hold | $80,000 — close below and the breadth confirmation retreats per Overwatch |
| Context note | Recovery is within a macro downtrend — this is a confirmed bounce, not necessarily a macro reversal |
| Week carry | Bullish — next divergence carries more weight because the baseline is confirmed |
This content is for educational and informational purposes only and does not constitute financial advice. Past analysis does not guarantee future results. Always conduct your own research before making any trading decisions.
Thursday 14 May 2026
Bitcoin (BTC) — Daily Read | Thursday 14 May 2026
Post-CPI mid-session | 3-day divergence formally reversed | Not financial advice
WHAT CHANGED FROM YESTERDAY
Yesterday BTC was described as WATCHING — a counter-trend bounce inside a larger downtrend, with short-term rising and macro falling. The analysis said “timeframe battle” and “not the time to pick a side with conviction.” Today that waiting paid off. The 3-day divergence — where BTC lagged equities while they rallied — has formally reversed. BTC is at $81,542 (+2.86%). The contradiction identified in the Overwatch has resolved bullishly. This is the most significant change from Wednesday to Thursday across any asset in this read.
HEADLINE STATE: DIVERGENCE RESOLVED — BTC +2.86%, 3-Day Contradiction Cleared
For three days, BTC was not following equities higher. That was the divergence flagged in the analysis. When assets that normally move together stop moving together, the tension builds until one side capitulates. Today the CPI catalyst provided the resolution: BTC moved bullishly with the risk-on wave. The 3-day divergence resolved to the upside — BTC caught up to equities rather than equities falling back to BTC. That is the bullish resolution of the two possible outcomes. ETH is also up 2.22%, confirming crypto broadly catching a bid, not just Bitcoin specifically.
Key Levels
| Level | Price | Significance |
|---|---|---|
| Current price | $81,542 | +2.86% — divergence resolution confirmed |
| Prior macro direction | Falling | Still the bigger picture — this bounce does not override it |
| Short-term direction | Rising | Now confirmed with volume and follow-through |
| ETH comparison | +2.22% | Broad crypto bid — not just BTC, confirms the move |
| Divergence resolved | Bullishly | BTC caught up to equities, not equities fell to BTC |
| P/C context | 0.531 | Very bullish sentiment — supports the risk-on crypto move |
Structure · Momentum · Flow
Structure
Short-term structure has been confirmed to the upside. The 3-day divergence was a structural tension that needed resolving — it resolved bullishly. The macro structure (falling) remains the bigger picture context. Short-term structure is now aligned with the short-term direction.
Momentum
+2.86% is meaningful momentum. Crypto does not move 2.86% on accident — that is institutional and leveraged money moving simultaneously. The momentum is real and follow-through from ETH (+2.22%) confirms the breadth.
Flow
Risk-on capital is entering crypto alongside equities. P/C at 0.531 shows broad market bullishness. When equities and crypto both bid on a CPI event, it is the same capital allocated to risk assets generally. Flow is broad and aligned.
TODAY’S BIAS: SHORT-TERM LONG CONFIRMED — Macro Context Still Requires Caution
The divergence has resolved bullishly. Short-term the direction is confirmed long. The macro downtrend identified yesterday has not been reversed by one +2.86% day — that would take sustained price action above previous highs. So: trade the short-term long momentum, respect the macro context, and size accordingly. This is not a “back to ATH” setup — it is a confirmed short-term bounce with follow-through.
Risk: Around 40%
Short-term the direction is confirmed. Risk is elevated by the macro downtrend context — this bounce could be the classic “relief rally within a downtrend” that retraces. If $81,500 holds and continues, the short-term long is valid. If it fades quickly back below $80,000, the macro short resumed and this was the “sell the bounce” moment.
By Experience Level
New to this
The divergence that was flagged yesterday — BTC not following equities higher — resolved today. This is how divergence trades work: you spot the tension, you wait for the resolution, then you trade the direction of the resolution. The analysis called the tension. CPI provided the resolution. That is the process.
Developing
BTC at +2.86% vs equities at +0.78-0.85% means crypto is outperforming on the CPI day. That is a catch-up trade — BTC was behind and now closing the gap. When a lagging asset starts catching up to the trend, the initial move is often sharp and can overshoot. The question is whether $81,500 holds into the weekend or this is a one-day catch-up that fades.
Experienced
The macro downtrend in BTC was the bigger-picture read. $81,542 needs to be contextualised against prior highs. If prior resistance sits at $83-85K, this bounce is approaching a decision zone. The short-term long is valid, but the macro short entry begins to build at those higher levels if the macro context is still falling. Watch the $83-85K range as the next decision point for BTC direction.
This is a daily analysis read for educational and informational purposes only. Nothing here is financial advice. Past performance is not a guide to future results. Trading carries significant risk of loss. Always apply your own risk management.
Wednesday 13 May 2026
Bitcoin (BTC) — Daily Framework Read | Wednesday 13 May 2026
analysis as of pre-market | CPI 3.8% shock context | Not financial advice
HEADLINE STATE: WATCHING — Mixed Signals Across Timeframes
Bitcoin is in a conflicted state. The short-term picture is rising and the 73% long read looks constructive — but the bigger picture is falling. That is the definition of a counter-trend bounce inside a larger downtrend. The framework does not have a clean trade here. When the shorter timeframe is rising and the longer timeframe is falling, you are in the middle of a timeframe battle. That is not the time to pick a side with conviction.
Key Levels to Watch
| Reference | Note |
|---|---|
| Short-term trend | Rising — near-term buyers active |
| Macro trend | Falling — bigger picture still bearish |
| Long bias read | 73% — below the 80%+ threshold for high conviction |
| Short bias read | 27% — not insignificant in a conflicted market |
| Framework state | WATCHING — no active trade signal |
Structure · Momentum · Flow
Structure
Two competing structures. The short-term is building higher — buyers are active near-term. But the longer structure has not yet reversed its bearish lean. Until the macro structure turns, short-term longs carry the risk of being caught in a bear bounce.
Momentum
73% long is above neutral but below conviction territory. Momentum is leaning long without committing. In a mixed environment this does not override the macro picture — it just means sellers have stepped back temporarily, not that they have left.
Flow
Risk-on macro regime is a marginal positive for crypto. CPI 3.8% keeps the inflation hedge narrative in play. But BTC correlation with equities has been inconsistent. Watch whether the equity long in NAS100/SP500 pulls BTC higher as a risk asset or whether it trades its own path.
Long Case vs Short Case
LONG CASE (conditional)
- 73% long read — lean is upward short-term
- Risk-on regime supports risk assets broadly
- Inflation at 3.8% — BTC inflation hedge narrative active
- Short-term structure rising — buyers are here now
- Only valid if macro structure begins to turn
SHORT CASE (macro still applies)
- Macro trend still falling — bounce risk is real
- 27% short signal in a supposedly long-leaning setup
- Counter-trend bounces can be fast and violent on the way back down
- No clean framework entry signal exists today
- Patience outperforms guessing in mixed conditions
Sizing Guidance
No active position recommended today. The framework is in watching mode for a reason. When the short-term and macro direction disagree, the risk-reward of taking a trade deteriorates significantly. Positioning against the macro trend requires exceptional precision on timing — and today’s read does not have that precision.
BTC becomes tradeable when either the macro structure aligns with the short-term, or a clean breakout from current levels resolves the conflict. Watch — do not trade.
Tuesday 12 May 2026
Daily Framework Read · Tuesday 12 May 2026
Bitcoin (BTC) — Daily Framework Read | Tuesday 12 May 2026
Published pre-market · Time-gated member content
Current State
WATCHING — No Clear Edge
Bias split: 61% long / 49% short. Near-term structure is rising but the bigger-picture structure is still falling. No reliable read.
Key Levels
| Level | Price | Notes |
|---|---|---|
| Watch Zone | — | No live entry setup today |
| Bull Trigger | Macro structure break up | Needs bigger-picture confirmation |
| Bear Trigger | Near-term support break | Short-term structure fails |
| Risk:Reward | N/A | No active setup |
Structure Read
Bitcoin is presenting a split structural picture. The near-term timeframes are showing a rising sequence — higher lows developing and short-term buyers in control. But zoom out and the bigger-picture structural trend is still pointing lower, with the macro sequence of lower highs intact. Trading against macro structure for a short-term reaction is a low-quality play; waiting for resolution is the better approach.
Momentum Read
Momentum is fragmented across timeframes — short-term showing positive pressure while the longer durations remain under a bearish lean. When momentum doesn’t agree with itself, the trade becomes a coin flip dressed up as an opportunity. That’s not how to approach risk.
Volume & Flow Read
Flow is not resolving the debate. Neither buyers nor sellers are asserting dominance in the volume picture. Mixed flow combined with conflicting structural timeframes means the market itself hasn’t made a decision yet, and trading ahead of that decision is gambling on timing rather than reading an edge.
The Verdict
The best trade today is no trade on Bitcoin. Short-term structure is rising, but you’d be buying into a macro downtrend — and the history of that decision isn’t kind. Until the bigger-picture structural sequence flips, any long is swimming against the current. Wait for macro structure to confirm a shift, or watch for near-term support to break and align with the bigger picture before positioning short. Right now the framework gives you nothing clean.
Long Case vs Short Case
61%
Near-term structure rising. Short-term buyers in control.
49%
Macro structure still falling. Near-term bounce remains vulnerable.
Position Sizing Guidance
No position today. Cash is a position on Bitcoin when the read is this mixed. Add it to the watchlist and wait for one of two things: the macro structure breaks up and confirms the short-term buy thesis, or the near-term support fails and the short trade aligns with the macro downtrend. Neither scenario requires you to be early — the move will still be there once it confirms.
This content is for educational and informational purposes only. Nothing here constitutes financial advice or a recommendation to buy or sell any instrument. Trading involves substantial risk of loss. Past performance is not indicative of future results. Always conduct your own due diligence and manage risk appropriately.
Tuesday 5 May 2026
Bitcoin (BTC/USD) — Daily Framework Read | Tuesday 5 May 2026
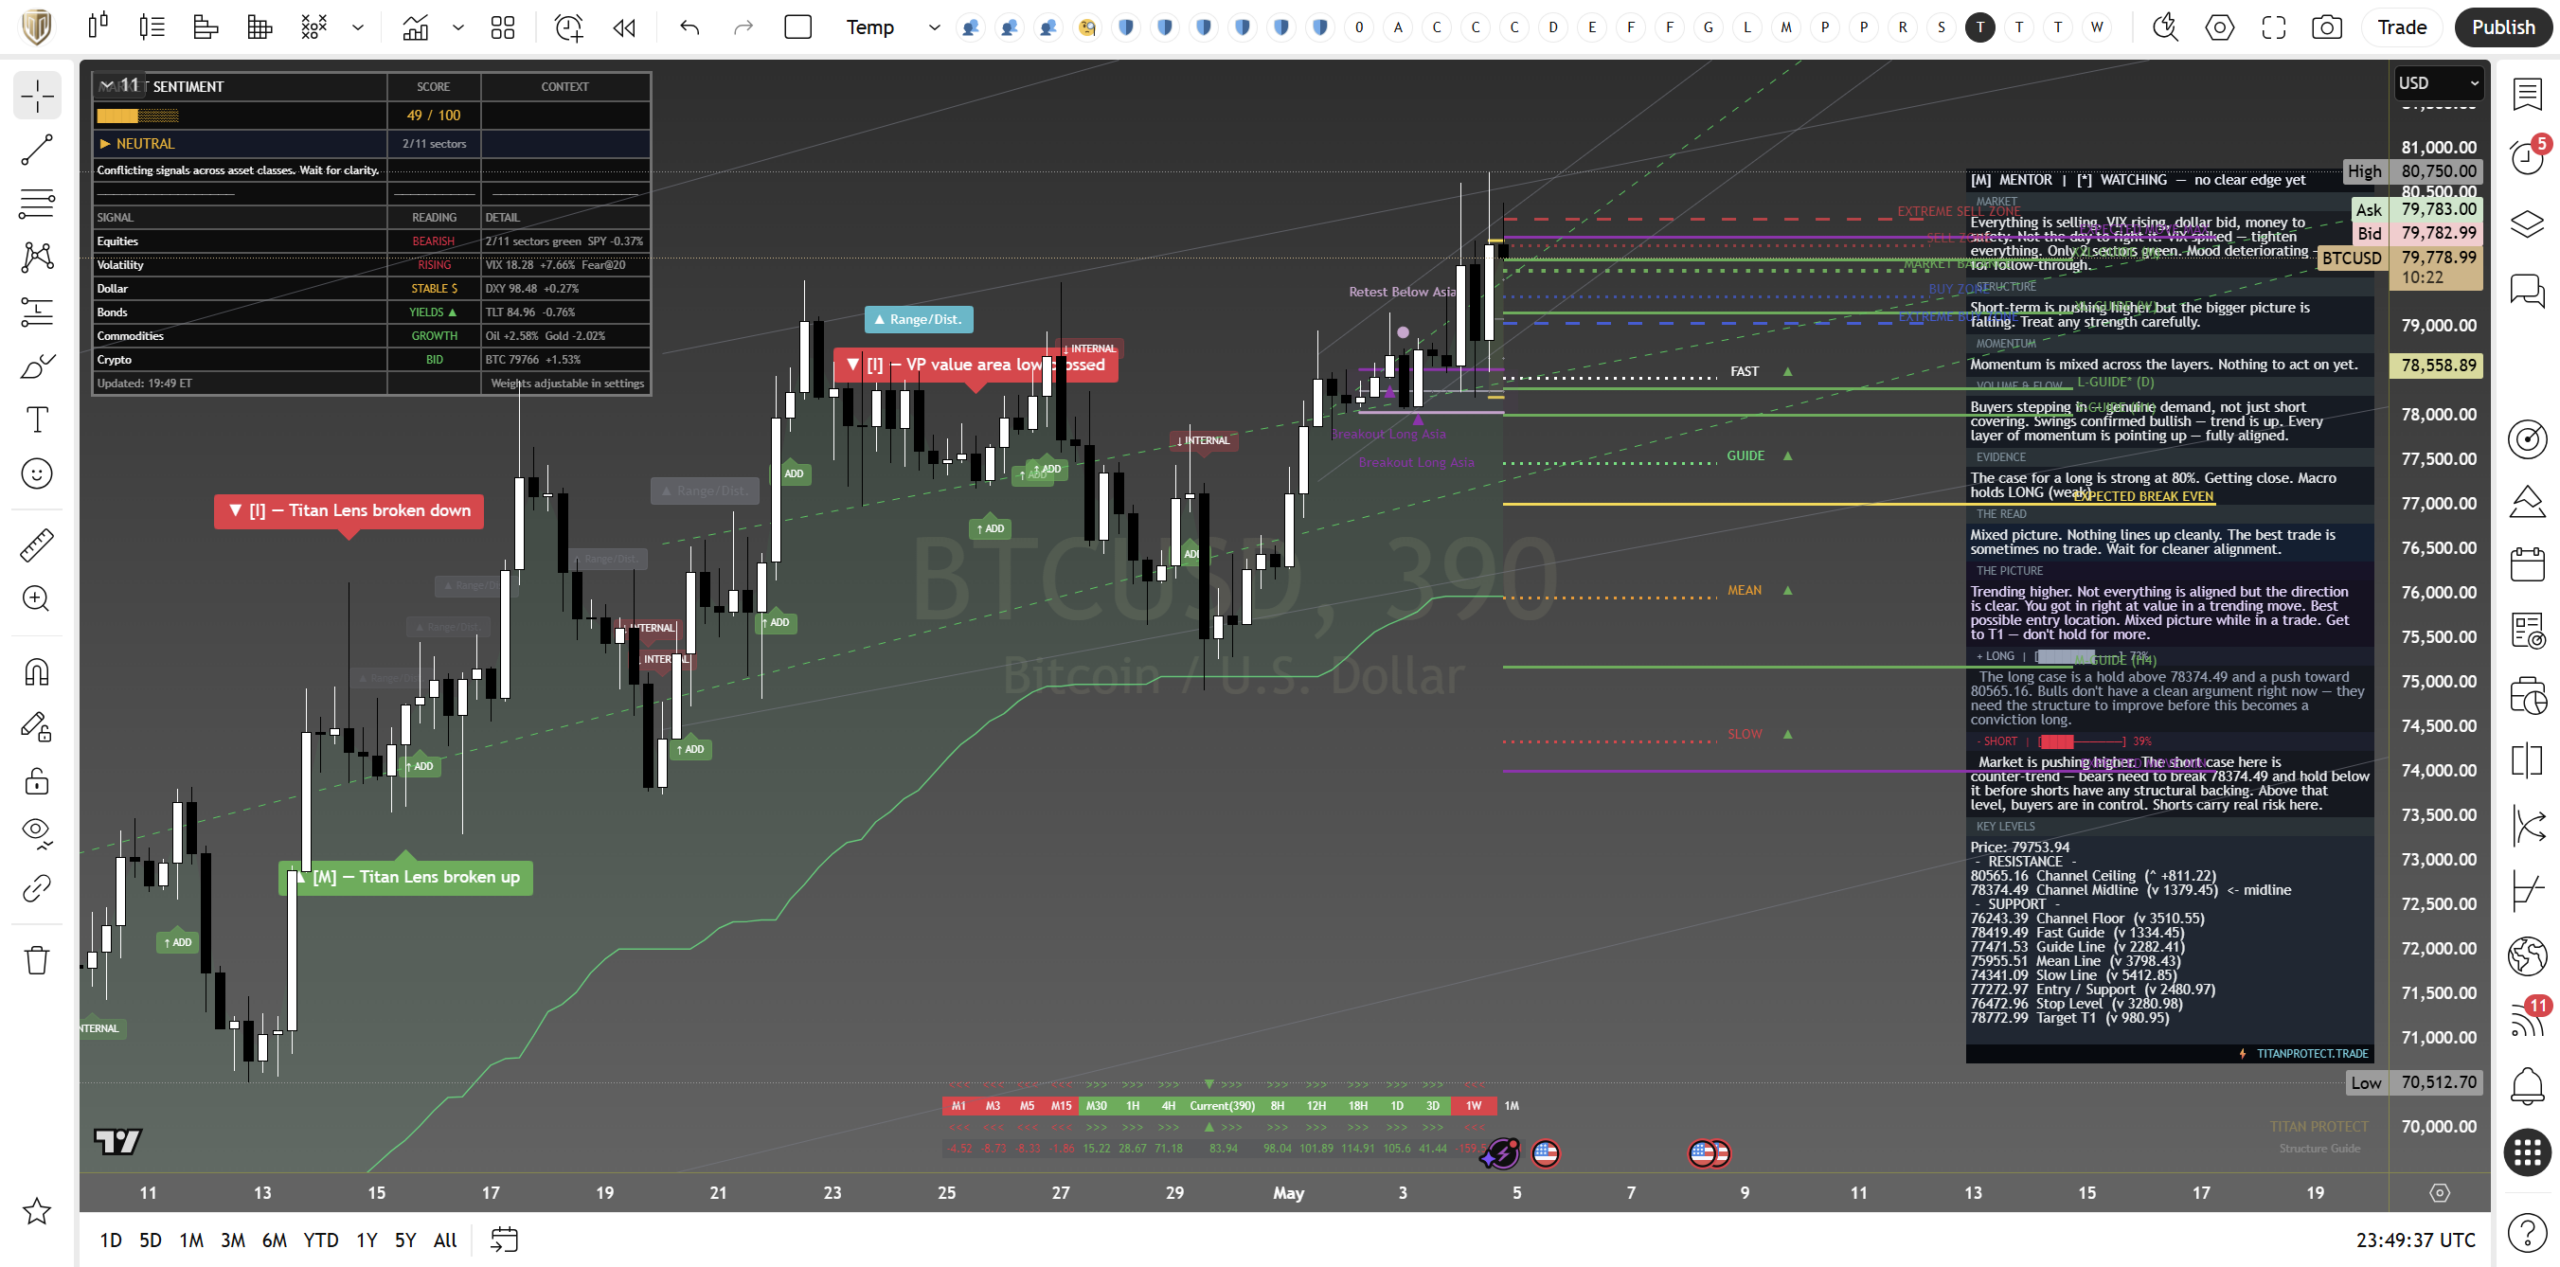
Tuesday 5 May 2026. The framework’s daily read on Bitcoin, taken from the locked snapshot at the post-close anchor. What changed against Monday’s read, where the levels sit, and what the call is into the next session.
Daily Read at a Glance
| Bias | Watching — short-term softening inside a higher daily structure |
| Conviction | Medium. Daily trend intact, intraday structure broken down |
| Structure | Markup paused, value area lost on the lower timeframe, retesting the prior breakout shelf |
| Risk profile | Around 60% — vol elevated alongside the broader risk pullback, headline tape still active |
| Last lock | 2026-05-05 post-close anchor |
What Changed Since Monday
Monday’s read on Bitcoin sat in the same neighbourhood it has all of last week — markup intact on the daily, pressing the upper edge of the recent value area but unable to extend cleanly through it. The framework flagged a softening intraday read into the close, with sellers stepping in around the prior swing high and the lens breaking down on the lower timeframe before recovering. The call was patience: do not chase the highs, watch how price behaves on the retest of the shelf.
Tuesday’s read confirms that hesitation. Price has rolled into the prior breakout zone and is now testing the floor of last week’s range. The daily structure is unbroken — higher lows and a higher swing high remain on the chart — but the intraday lens has now firmly broken down. That is the structural change worth marking.
| Read | Monday 4 May | Tuesday 5 May |
|---|---|---|
| Bias | Watching, leaning long on the daily | Watching, intraday now defensive |
| Daily structure | Markup, value rising | Markup, retesting the prior breakout shelf |
| Intraday structure | Mixed — lens broken up then back down | Lens broken down, value area lost |
| Conviction | Medium | Medium, with a defensive lean |
| The call | Patience around the highs | Watch the retest, let the level prove itself |
Mentor’s Read
Structure
The daily picture has not been damaged. Bitcoin is still printing higher lows off the back of the recent leg up, and the prior breakout zone sits underneath as a structural floor. What has changed is the lower-timeframe behaviour — the intraday lens has broken down, value has slipped, and the buyers who were absorbing weakness last week have stepped back. That combination tells you the rally has paused, not reversed. The market is now asking the question it always asks after a strong leg up: does the breakout level hold as support, or does it fail and turn into a trap?
Momentum
Momentum has cooled in line with the broader risk tape. The push that took price into the highs has lost urgency. There is no panic in the order flow — sellers are not aggressive, buyers are not absent — but the upward bid that drove last week’s extension is no longer there. Bitcoin is in the middle of its own range, which is the worst place to take a directional view. The analysis reads patience, not conviction, here.
Volume and flow
Volume on the pullback has been measured. There is no capitulation print, no liquidation wave, no sign that the broader buyer base has lost interest. That matters. A pullback that loses value on light volume is far more often a digestion than a top. The signal to watch is whether the retest of the prior breakout shelf produces a clean rejection of lower prices or a drift through it. The first means the daily structure is reaffirmed. The second means the rally was the trap.
The call
Watching. Bitcoin is between its two natural decision points — the prior breakout shelf below as support, the recent swing high above as resistance. The framework does not chase positions in the middle of that range. The trade comes when price tests one of the two edges and the lens, the volume, and the broader risk tape all point in the same direction. Right now they do not. The defensive lean on the intraday read is the only meaningful change against Monday, and it argues for letting the level work, not for being early.
Key Levels
| Type | Zone | Why it matters |
|---|---|---|
| Resistance | Recent swing high | The wall the rally has not been able to clear. Reclaim and hold reopens the upside leg. |
| Pivot | Lower edge of the recent value area | Where the analysis reads the intraday lens broken. Price below this level is defensive. |
| Primary support | Prior breakout shelf | The floor that defines whether last week’s leg up survives. A clean rejection here is the long signal. |
| Failure level | Below the breakout shelf | Loss of this zone turns the rally into a failed extension. Bias flips defensive on the daily. |
Track Record — What We Called Yesterday
Monday’s read was patience around the highs, not chasing the extension, and watching how price behaved on the retest. Price has done exactly what the framework called for — rolled back from the swing high, tested the upper part of the prior value area, and is now drifting toward the breakout shelf. The structural read of “do not buy strength into resistance” worked. The next decision sits at the support test, not behind us.
Risk Assessment
Risk: around 60%. Three factors lift it above the baseline. First, broader risk-asset volatility is elevated, which historically widens Bitcoin’s intraday range and increases the chance of a fakeout in either direction. Second, the intraday lens is broken down, which means the immediate path of least resistance is sideways-to-lower, not up. Third, the prior breakout shelf is untested as support. The first time a level is tested is the time it carries the most uncertainty. Position size accordingly. The framework does not take a full position into a level it has not yet seen behave.
Cross-Reference
Bitcoin’s read sits inside a wider risk-off lean across the tape. The headline indices have softened, volatility has lifted off the floor, and the dollar has firmed at the margin. None of those three are catastrophic on their own, but the combination is why the framework’s intraday read on Bitcoin has moved defensive even though the daily structure is intact. The Digital Flow desk on Alpha Insights covers the broader crypto cross-section — sector dispersion, alt rotation, and the relationship between BTC and the rest of risk — and the read there matches the call here: the daily uptrend is the dominant story, but the next move comes from the support test, not the highs.
Educational content. Not financial advice. Markets carry risk of loss. Position size and stops are your responsibility. The framework’s read is one input, not a trade signal.
Continue with Titan Protect
Twenty-plus instruments. One framework.
We read more than twenty instruments daily across four sessions. The framework’s sunrise call landed across the day — the Pre-NY case study shows what the lines drew, what New York did, and where the read stands.
Core
£59/mo
Indicator suite plus daily framework reads.
Edge Popular
£109/mo
Core plus Shield dashboard and member-only briefs.
Elite
£179/mo
Edge plus weekly 1:1 call and early access to new tools.
Save 15% on annual billing
Want to see the framework in action? Free Explorer tier — no card required.
Join the live community: Discord channel · Shield dashboard
Education, not financial advice. Trade your own analysis.
Sunday 3 May 2026
Bitcoin (BTC/USD) — Daily Framework Read | Sunday 3 May 2026
Bitcoin (BTC/USD) | Monday Open Framework Read | Data basis: Friday 1 May 2026 close
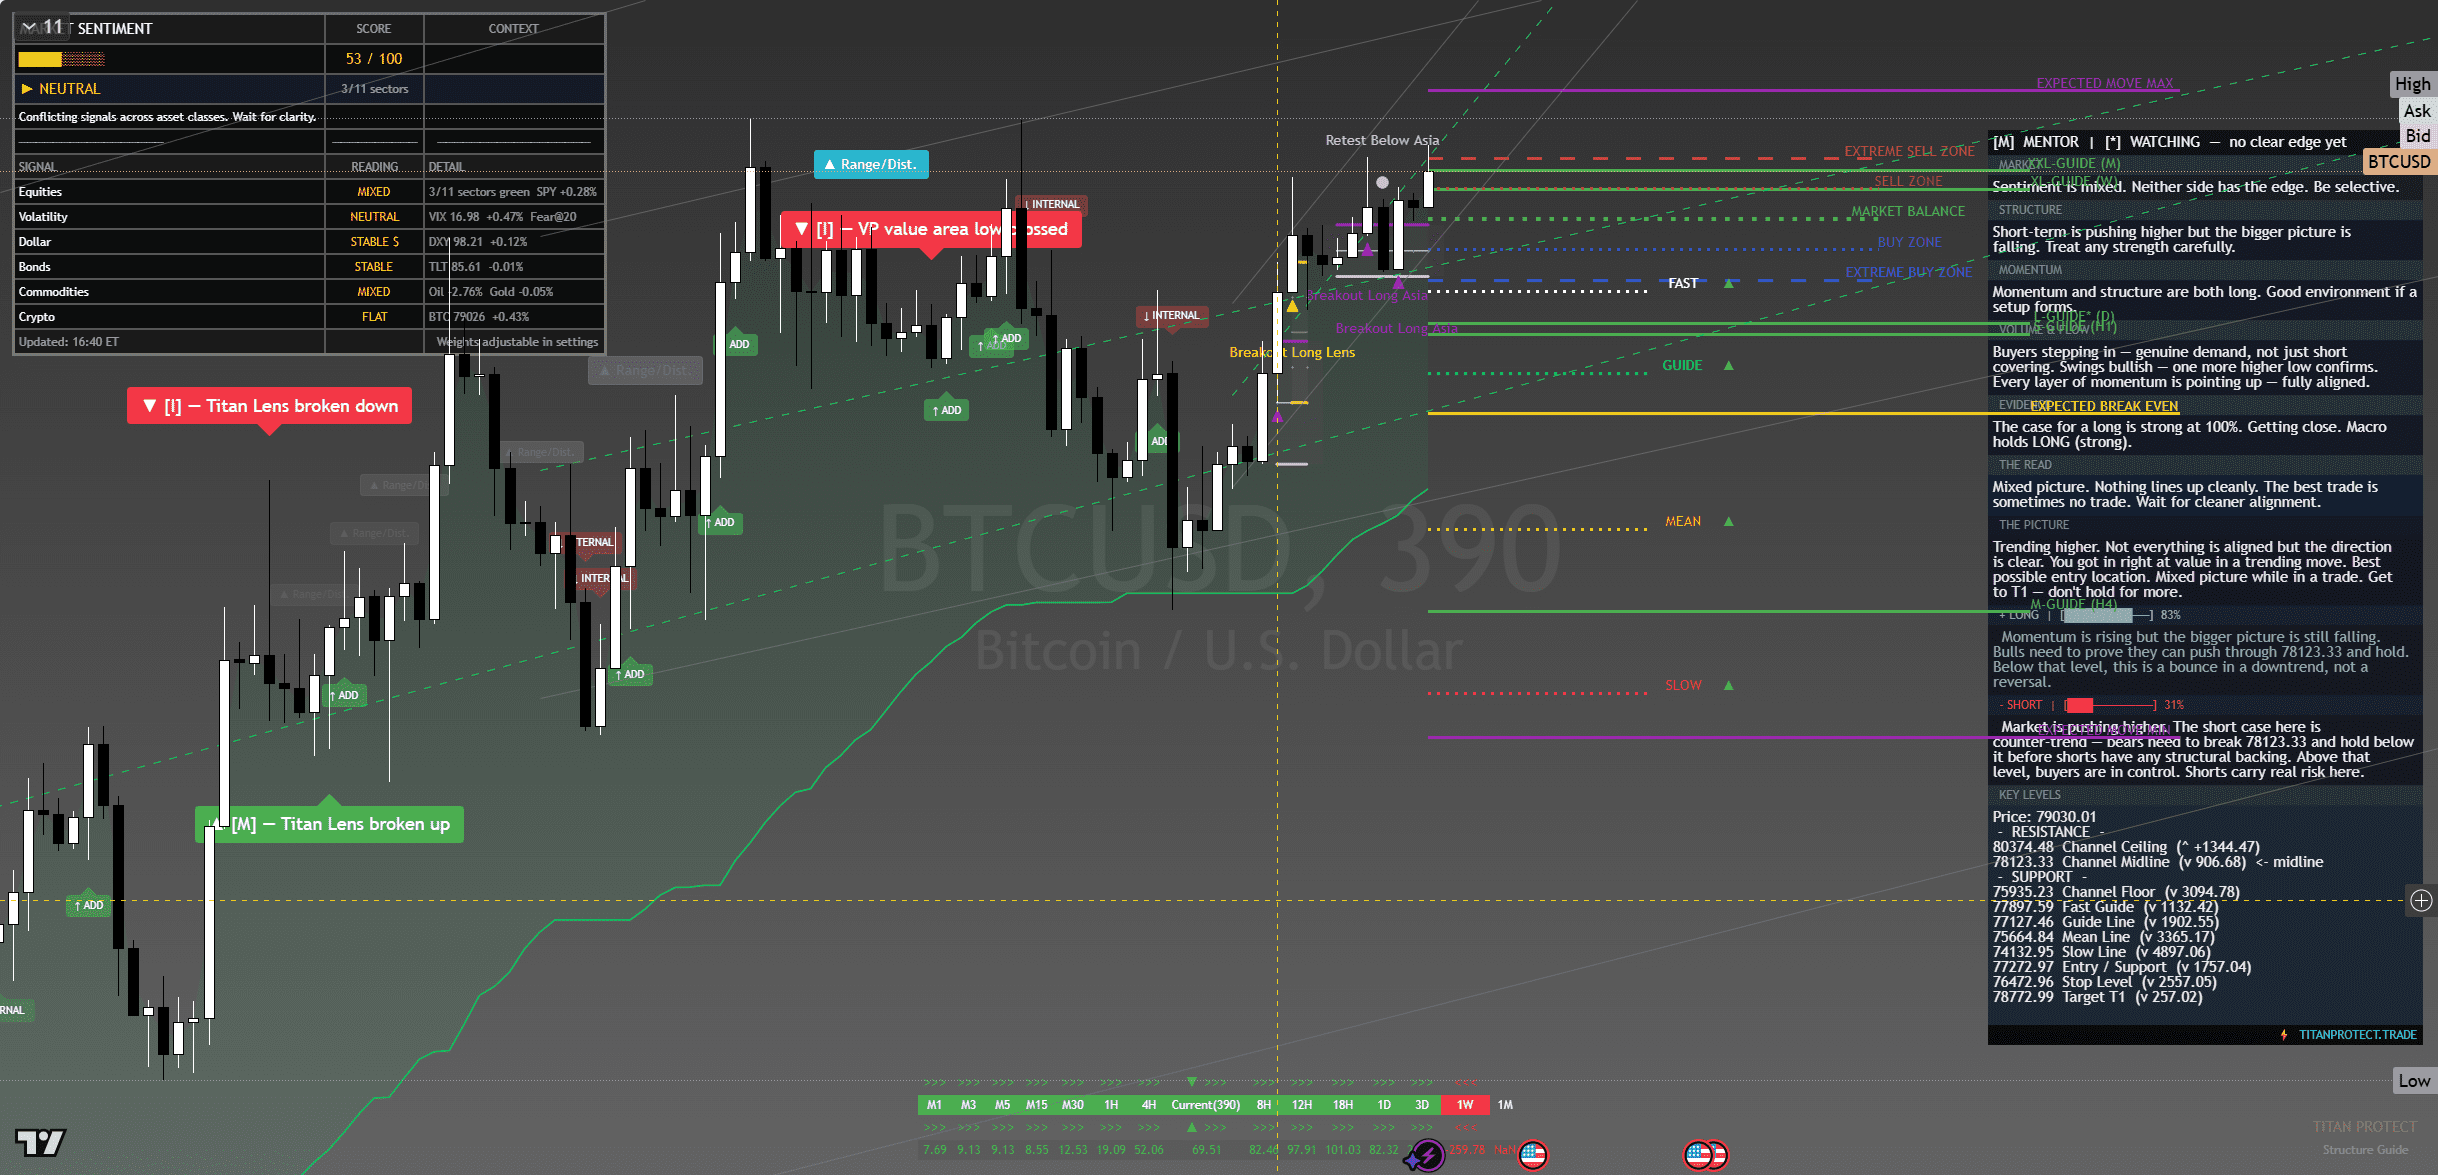
Bitcoin (BTC/USD) — chart with framework overlay. The Lens annotations show structural breaks, reversal triggers and confluence zones at the levels referenced below.
Where It Sits
Structure
Structurally BTC is in a clear uptrend on daily timeframes with higher highs and higher lows since the early-April low. The 4-hour timeframe has been consolidating below 80,000 for a week — that consolidation is the decision point. Hold and the range becomes a base, lose 76,500 and the structure softens.
Momentum
Momentum has flattened in the consolidation but daily structure remains supportive. Internal momentum readings sit in the upper-middle of their range — neither extended nor exhausted. The momentum profile supports continuation if 80,000 is taken.
Volume & Flow
BTC futures flow has been balanced through the consolidation. ETF flows remain modestly positive. The pattern is one of patient accumulation rather than aggressive buying or selling.
Key Levels
| Level | Type | Significance | Action Zone |
|---|---|---|---|
| 82,000 | Resistance | Round number, prior swing high zone | Take profits if reached |
| 80,000 | Pivot | Round-number psychological level | Hold above = bullish; lose = consolidation |
| 78,630 | Friday close | Reference anchor | Bias line for Monday open |
| 76,500 | Support | Recent breakout retest level | Buy zone with defined stop |
| 73,000 | Major support | Prior congestion floor | Stop-out below for longs |
Three Scenarios Into Monday Open
Continuation
BTC holds 78,500 through Asia, takes 80,000 round number cleanly during US session as risk-on continues. Runs to 82,000 zone overnight. Constructive close above 81,000.
Range
BTC churns 77,500-80,500 through the weekend roll. Magnet to Friday close. Range trade dominates without fresh catalyst.
Mean Reversion
BTC fades on risk-off shift or specific crypto headline, breaks 76,500, runs to 73,000. Mean-reversion within the broader trend.
Risk Score
Risk sits at Around 55% heading into Monday open.
Risk is moderate-elevated. Bitcoin trades 24/7 so weekend gaps are smaller but liquidity-driven spikes are real. The structure is constructive but BTC has consolidated for a week without breaking through 80,000 — the longer it sits below the round number, the more the breakout becomes a coin-flip rather than a setup. Position-sized longs on support tests, smaller new entries until 80,000 is taken cleanly.
How to Walk It
Entry / Stop / Target structure:
- Long 76,800-77,200 pullback | Stop 76,000 | Target 80,000 | R:R 3:1
- Long 80,200 breakout | Stop 79,000 | Target 82,000 | R:R 1.4:1
- Short 82,500+ rejection | Stop 83,500 | Target 79,500 | R:R 2.5:1
Experience-level guidance:
Beginner: The Monday open after a Friday record close is exactly the situation where over-confidence costs money. Reduce size to half your standard. Trade only the cleanest setup from the entries above. If the tape opens against your bias, do nothing — wait for the second hour, when the institutional flow has tipped its hand.
Intermediate: Use the levels table to define the trading range. Fade the extremes with defined stops, take profits before the round-number resistance levels. Do not carry directional positions through the day if you cannot watch the tape — Monday opens are prone to fast reversals.
Advanced: The vol regime is supportive of trending moves. Defined-risk options structures around the key pivot levels capture the asymmetry cleanly. Keep notional small relative to your book — Monday after a record-close week is asymmetric speculation, not core positioning.
The Sunday Composite — How This Read Sits Inside The Cross-Asset View
This single-instrument framework read is one slice of the larger Sunday weekend synthesis. The composite takes positioning, macro, sentiment, volatility, sector dispersion and trade structure as separate analytical layers and arrives at a unified composite verdict for Monday open. Each layer below is unpacked in full.
Read the full composite for the cross-asset context driving this instrument:
The institutional positioning split — Asset Managers vs Leveraged Funds in size
PCE clearance and the macro case for Monday’s carry
The three-layer sentiment disagreement — surface greed, retail neutral, professionals hedged
The vol curve term structure and what VVIX is signalling
Sector dispersion and the breadth problem behind the record close
The Monday position-management playbook — sizing tiers and trade plans
Sunday Overwatch — the unified composite verdict
Continue Reading
The macro frame driving this read is unpacked in the weekend briefs:
Sunday Setup — Reading The Tape Into Monday Open
PCE Cleared, VIX Crushed, SPY Closed 720 — Friday Post-Close Recap
This analysis is for educational and informational purposes only. It does not constitute financial advice. Always manage your risk independently and in accordance with your own financial circumstances.
Continue with Titan Protect
Twenty-plus instruments. One framework.
We read more than twenty instruments daily across four sessions. The framework’s sunrise call landed across the day — the Pre-NY case study shows what the lines drew, what New York did, and where the read stands.
Core
£59/mo
Indicator suite plus daily framework reads.
Edge Popular
£109/mo
Core plus Shield dashboard and member-only briefs.
Elite
£179/mo
Edge plus weekly 1:1 call and early access to new tools.
Save 15% on annual billing
Want to see the framework in action? Free Explorer tier — no card required.
Join the live community: Discord channel · Shield dashboard
Education, not financial advice. Trade your own analysis.