Fear Rising Despite the Bounce
The Sentiment Divergence Nobody’s Talking About | Monday 8 June 2026
Nasdaq 100 (QQQ) rallied 1.42% on Friday. S&P 500 (SPY) gained 0.23%. VIX collapsed 12%. And somehow, the CNN Fear & Greed Index dropped to 40.1 — deeper into fear territory than the session before. That is the contradiction at the centre of Monday’s open. Price went up. Sentiment went down. When those two diverge this sharply, one of them is lying. It is rarely sentiment.
If you have been following today’s sequence, the pieces are connecting. The Positioning Pressure analysis showed $335M in dark pool outflows on a rally day — classic distribution into strength — with a $3B put wall pinning S&P 500 (SPY) at 740. The Macro Pulse explained how hot jobs data killed rate-cut expectations, sent the dollar to a six-week high, and produced what it called the worst macro configuration for risk assets since Q3 2023. Now the sentiment data adds a third layer: the crowd is not buying this bounce either, and the breadth data underneath says the rally has no foundation.
What We Called vs What Happened
First production run for Sentiment Shift. No prior calls to evaluate. Starting the track record from today. Every future edition will reference this post’s calls and whether they held. Accountability starts now.
Sentiment Dashboard
| Indicator | Reading | Prior | Zone | Interpretation |
|---|---|---|---|---|
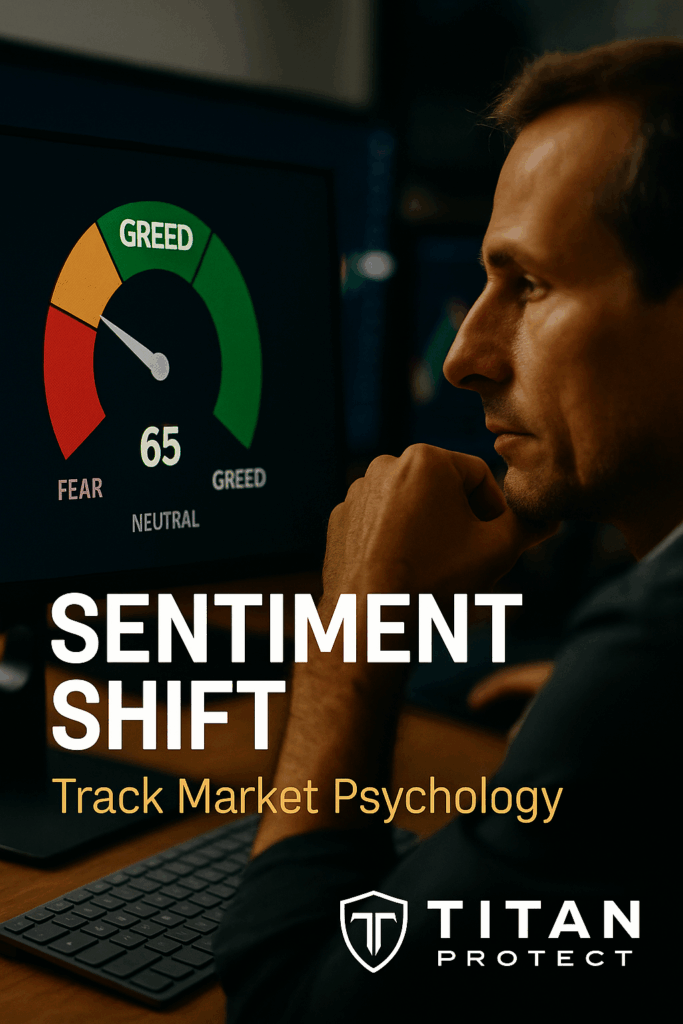
| CNN Fear & Greed | 40.1 | 42.1 | Fear | Falling into green tape — 5 of 7 sub-components worsening |
| VIX | 18.92 | 21.51 | Moderate | 12% crash — cheapest vol into Iran weekend risk since Mar 2024 |
| VIX9D (Short-Term) | 23.92 | — | Elevated | 5pts above spot VIX — near-term event fear still priced |
| VVIX (Vol of Vol) | 102.04 | — | Neutral | Options market not panicking but not complacent either |
| AAII Bullish | 36.3% | 41.0% | Below Avg | Down from 41% two weeks ago — conviction fading |
| AAII Neutral | 36.6% | — | Elevated | Highest in 8 weeks — confusion, not capitulation |
| Put/Call Ratio | 0.792 | — | Bullish Lean | Surface read — Positioning Pressure showed $48M July put spread hiding underneath |
| Death Crosses | 912 | 860 GC | Extreme | 52 more death crosses than golden crosses — breadth damage structural |
| HMM Regime | 45% sideways | — | Range | 26% bear + 8% crisis = 34% downside probability vs 21% bull |
The Divergence Explained
Here is what is actually happening. Fear & Greed at 40.1 is a analysis that weighs seven inputs: market momentum, breadth, put/call ratios, safe haven demand, junk bond demand, VIX, and stock price strength. While VIX crashed and the headline indices rallied on Friday, five of those seven sub-components moved toward fear. Breadth deteriorated (912 death crosses in the universe). Safe haven demand increased with Gold (XAU/USD) holding above $4,354. Junk bond spreads widened. The analysis dropped because the majority of the market is getting worse, even as the two loudest inputs — VIX and price momentum — moved the other way.
This is a narrow rally. The indices went up because a handful of mega-cap names bounced. Under the surface, participation was awful. When the headline number recovers but the breadth data keeps deteriorating, you are watching the final stages of a move running on fumes. Think of it like a building where the top floor is freshly painted but the foundation is cracking.
VIX9D vs VIX Spot — The Hidden Fear
The VIX9D at 23.92 while spot VIX sits at 18.92 is a 5-point gap. That means options traders pricing the next nine days see materially more risk than the 30-day implied volatility suggests. This is not abstract. It means the options market expects something in the next week to two weeks — likely the Monday open reaction to Iran strikes, the ORCL/ADBE earnings cluster, or a delayed response to the NFP repricing — that does not show up in the smoothed 30-day VIX number. Short-term fear is real. The VIX headline is masking it.
AAII — Retail is Confused, Not Panicking
The AAII survey captures retail sentiment. Bullish at 36.3% is below the historical average of 37.5%. The more interesting number is the neutral camp at 36.6% — highest in eight weeks. Retail is not panicking. They are stepping to the sideline. The shift from bullish to neutral (not bearish) signals confusion rather than capitulation. Hot jobs, Iran missiles, a bouncing market, dying rate cuts — the signals are contradictory and retail does not know what to do. So they are doing nothing.
Historically, elevated neutral readings resolve in the direction of the prior trend. The market was trending up before this shock, so the historical pattern says bullish resolution. But the Macro Pulse analysis showed the regime has changed fundamentally — rate cuts are dead, the US Dollar Index (DXY) is at a six-week high at 105.4, and crude sits at $91.29 with Iran premium. When the macro foundation shifts, historical patterns based on the old regime become unreliable. This is one of those moments.
912 Death Crosses — The Breadth Collapse
This number demands attention. A death cross occurs when a stock’s 50-day moving average crosses below its 200-day — one of the most basic trend signals. Having 912 stocks in death-cross territory against only 860 golden crosses while the S&P 500 (SPY) rallies is a screaming divergence. The generals are charging forward while the army is in retreat.
Context: before the January 2022 correction, death crosses peaked around 800. Before the September 2023 pullback, they reached 750. At 912, this is the most extreme breadth divergence in over three years. Historically, readings above 850 have preceded 5-10% corrections within 4-8 weeks. The damage is not localised to one sector — it is broad, structural, and getting worse.
The Contradiction Map
| Signal | Says | Contradicts | Implication |
|---|---|---|---|
| Nasdaq 100 (QQQ) +1.42% | Risk-on | F&G dropping to 40.1 | Price rallied on narrow leadership, not broad conviction |
| VIX -12% to 18.92 | Fear unwinding | VIX9D at 23.92 | 30-day calm masking 9-day event risk |
| Put/Call 0.792 | Bullish call buying | $48M July put spread | Retail buying calls, institutions buying puts |
| AAII neutral 36.6% | No panic | No conviction to buy | Sideline cash = fuel for move in either direction |
| Gold (XAU/USD) holding $4,354 | Safe haven demand | Equity bounce same day | Money hedging in both directions simultaneously |
| HMM 45% sideways | Range-bound | 34% bear+crisis | Statistical model leans defensive, not neutral |
Six contradictions across a single session. When sentiment indicators fight each other this aggressively, the resolution tends to be violent. The question is direction, not magnitude. And with the positioning data (Positioning Pressure showed leveraged funds short and dark pools distributing) and the macro data (Macro Pulse showed rate cuts dead and dollar surging) both leaning bearish, the weight of evidence tilts toward a downside resolution.
Risk Assessment
Around 65%
Elevated. The breadth collapse at 912 death crosses is structural, not noise. The F&G divergence from price is a late-cycle warning signal that has preceded every correction exceeding 5% since 2020. VIX9D vs VIX spot gap shows near-term event risk the headline number is hiding. Sentiment says the bounce is not trusted — and historically, untrusted bounces fail within 3-5 sessions.
Scenario Analysis
Around 20%
F&G drops below 30 (extreme fear) by Wednesday, triggering a contrarian buy signal. ORCL and ADBE beat and guide up, pulling breadth forward. Rotation broadens from mega-cap into mid-cap and Russell 2000 (IWM). Historically, F&G sub-25 reversals produce 3-5% rallies within 10 trading days. This requires Iran to stay contained and dollar to stabilise below 106.
Around 45%
F&G oscillates 35-45 through the week. Breadth does not improve. S&P 500 (SPY) holds 732-742 range on mega-cap leadership while equal-weight underperforms. The divergence widens day by day until a catalyst — earnings or geopolitics — forces resolution. This is a market that looks fine on the headline but is hollow underneath. The most dangerous configuration because it lulls people into false comfort.
Around 25%
The 912 death crosses drag the cap-weighted indices down. Even NVIDIA (NVDA) and Apple (AAPL) cannot hold if breadth damage spreads to mid-cap tech and financials. S&P 500 (SPY) breaks below 728 support. F&G approaches 25 — real fear. This aligns with positioning (leveraged funds short, $3B put wall), macro (no rate relief, dollar squeeze), and now sentiment all pointing the same direction.
Around 10%
Iran situation escalates over the weekend. Crude spikes above $95. VIX reverses the entire 12% drop and then some. The already-fragile breadth picture turns into a rout. F&G crashes below 20. This scenario turns the current divergence into a full-blown liquidity event where correlations go to 1 and everything sells together.
Strategy Tiers
Scalping (1-5 Minute)
The VIX9D vs VIX spot divergence creates intraday volatility pockets — expect sharp moves at the open (09:30 EDT / 14:30 BST / 22:30 JST) and around the European close (11:30 EDT / 16:30 BST / 00:30 JST). Fade rallies in Russell 2000 (IWM) and equal-weight toward breadth weakness. Scalp longs only in NVIDIA (NVDA) or Tesla (TSLA) where single-name flow is constructive per Positioning Pressure. Tight stops, 2:1 minimum R:R. Do not hold through lunch.
Intraday (15min – 4hr)
The divergence creates opportunity in both directions. Long plays: target the narrow window where mega-caps push the index — first 30 minutes and last hour. Short plays: Russell 2000 (IWM), equal-weight S&P 500, and breadth-sensitive names are more honest reads. Watch F&G sub-components intraday for confirmation. Entry: short S&P 500 (SPY) on failed test of 740 put wall. Stop: 742.50. Target: 735. R:R roughly 2:1.
Swing (1-5 Days)
The sentiment picture says do not trust the bounce. Swing traders should be reducing exposure, not adding. If holding longs, track the advance/decline line and new 52-week lows daily — if breadth deteriorates further while indices hold flat, that is a classic topping pattern. Entry: short Nasdaq 100 (QQQ) below 29,000 with confirmation. Stop: 29,500. Target: 28,200. R:R roughly 1.6:1. Sizing: maximum 50% of normal position. Hedge longs with Gold (XAU/USD) or VIX calls.
Positional (Weeks-Months)
The 912 death crosses and rising F&G fear-into-strength pattern are medium-term warnings, not immediate signals. Positional traders should be building watch lists for the washout, not acting yet. If F&G drops below 25, that becomes a generational buying opportunity with 3-6 month horizon. Until then, carry reduced equity exposure and overweight cash, Gold (XAU/USD), and short-duration treasuries. The macro regime (no rate cuts, strong dollar) favours defensive rotation.
Position Sizing
| Category | Sizing | Rationale |
|---|---|---|
| Index longs (SPY, QQQ) | REDUCED (25-50%) | Breadth divergence + untrusted bounce = elevated reversal risk |
| Single-name AI/tech (NVDA, TSLA) | STANDARD (75%) | Positioning Pressure showed accumulation in these names specifically |
| Short setups (IWM, equal-weight) | STANDARD (75%) | Sentiment, positioning, and macro all aligned bearish |
| Hedges (Gold, VIX calls) | MAX (100%) | VIX crushed to 18.92 makes protection historically cheap |
| Unhedged long index | AVOID | Three-layer convergence (positioning + macro + sentiment) against |
Hedging Recommendations
VIX at 18.92 after a 12% drop makes volatility protection the cheapest it has been in six weeks. The VIX9D at 23.92 confirms near-term event risk is still priced. Specific hedges: (1) Buy VIX calls at the 22 strike, 2-week expiry — this captures any reversal of Friday’s vol crush. (2) Gold (XAU/USD) allocation at 5-10% of portfolio as safe haven — sentiment and geopolitical risk both supportive. (3) For equity longs, consider a put spread on S&P 500 (SPY) at 735/725 for the next two weeks — the $3B put wall at 740 from Positioning Pressure makes the 735 strike a logical first target on any breakdown.
Experience-Level Guidance
Beginner
When 912 stocks are in technical downtrends and the fear index is dropping despite a green day, the market is sending a clear message: the rally is thin and unreliable. This is not the week to be aggressive. Study the contradiction table above and ask: do you trust a bounce that the crowd, the institutions, and the breadth data all reject? If the answer is no, staying in cash is a valid position. Cash is a position. It has zero drawdown risk and preserves the ability to act when a real opportunity appears.
Intermediate
The divergence is your edge this week. While retail is confused (36.6% neutral), you should be building your thesis from the contradiction data. Watch the F&G sub-components daily — if breadth continues to deteriorate while VIX stays crushed, that divergence will snap. Consider reducing index exposure by 30-50% and rotating into Gold (XAU/USD) or short-duration bonds. If you want to stay long equities, focus only on the names showing institutional accumulation (NVIDIA, Tesla, AMD per Positioning Pressure) and avoid broad index positions.
Advanced
The VIX9D/VIX basis at +5 points combined with VVIX at 102 creates a vol surface trade. Buy near-term vol (VIX calls or SPY weekly puts) and sell longer-dated vol (30-day VIX puts) to capture the term structure inversion. The HMM at 45% sideways with 34% downside skew suggests mean-reversion strategies will underperform trend-following. If you have the tools, track the F&G analysis decomposition daily — the moment safe haven demand and junk bond spreads reverse, the divergence resolves and you want to be positioned before the crowd notices.
Market Timing Verdicts
| Horizon | Verdict | Rationale |
|---|---|---|
| Short-term (1-7 days) | Bearish lean | VIX9D elevated, F&G falling, Iran weekend risk unresolved. Monday gap risk is real. |
| Medium-term (1-8 weeks) | Bearish | 912 death crosses historically precede 5-10% corrections. Rate cuts dead. Dollar squeezing. |
| Long-term (2-12 months) | Neutral — waiting for washout | If F&G drops below 25, that becomes a buying opportunity. Until then, patience pays. |
This is Post 02 of the Titan Alpha Insights daily sequence. The sentiment divergence described here is the thread connecting every layer today. Positioning Pressure (Post 00) showed the institutional distribution. Macro Pulse (Post 01) explained why rate cuts died and the dollar surged. Now the sentiment data confirms the crowd is not buying the bounce either. Three independent lenses, one conclusion. Next: Volatility Lens breaks down the VIX crash and what the options surface is really pricing for the week ahead.
Alpha Insights by Titan Protect. Published 8 June 2026. This content is analytical commentary, not financial advice. All trading involves risk.