
The Tesla Framework Journal for April 2026, newest read at the top. Each dated entry is our read on the close, kept as a living record so the framework can be judged over time. This is analysis, not financial advice.
Sunday 26 Apr 2026
TSLA Daily Ticker Read: High Beta Walks Into A Mag 7 Print Week With Mixed Signals
Daily Ticker Read | Sunday 26 April 2026
Tesla closed Friday at 376.30 ahead of a Mag 7 earnings week. Block buying showed up at 1.30 billion dollars notional, the only directional bull options print of size hit at 367.50, and put skew is loaded heavy. Structure says the leg lower has paused at a level the framework cares about. Volatility says the crowd is paying up for downside protection. Both readings have to coexist into the print, and then the tape decides.
Where The Stock Sits
TSLA closed Friday at 376.30. Price sits in the lower third of its twenty-day range and below the prior fifty-day pivot, which is where the slide stalled this week. Across the last month the stock drifted from 405 down through 380. Sellers control the higher timeframe. Buyers only stepped in at the 368 to 372 shelf. That shelf matters now because price sits just above it into earnings.
The directional bias reads cautious. Friday printed an inside-day style hold near the base, which says sellers stepped back rather than stepped down. That is a pause, not a reversal. Above price sits supply between 384 and 388. Below sits the line in the sand near 368. The wider trend has rotated into a wide range rather than a clean trend. This is a high-beta name waiting on a catalyst.
Three Levels That Decide The Week
Support: 368 to 370. The shelf the framework keeps marking as the line in the sand. It was where the slide paused and where the only directional bull options print of size sat at 367.50. A daily close below 368 takes that line out and opens 360 then 352 in fast order.
Decision: 376 to 378. Friday’s close sits inside this zone. The 377.50 strike is the dealer pin into the weekly expiry, and 376 to 378 is where the day’s range tends to anchor. Reclaim 378 on volume and 384 opens. Lose 376 on volume and the tape points back to 370.
Resistance: 384 to 388. The supply cluster from earlier in the month. The 380 round number is the first magnet inside it, and 380 is the option max-pain print, so a drift into it without follow-through is the path of least resistance for dealers. Through 388 on a daily close opens a measured move toward 400. Rejection at 388 is the short trigger.
Long Bias Setup
Pin-And-Squeeze Long: Buy The Defended Shelf At 370
Risk score: around 60%
Entry: 370 to 372 on a controlled tag with rejection wicks. Stop: 367. Target one: 380. Target two: 388. Risk to reward: 1:2.5 to first, 1:5 to second.
Why it works: The shelf at 368 to 370 has held twice. Block buying was on the cross-tape at over a billion dollars notional. The lone directional bull options print of size sat at 367.50, which is positioning for a defence rather than a break. Max pain at 380 gives dealers the incentive to pull price toward the upper end into Friday’s expiry. Kill condition: A daily close below 367 cancels the read.
Short Bias Setup
Supply-Cluster Short: Fade Failed Pushes Into 388
Risk score: around 65%
Entry: 386 to 388 on a wick rejection candle, ideally paired with weakness in the wider Mag 7 tape. Stop: 391. Target one: 378. Target two: 370. Risk to reward: 1:2.7 to first, 1:6 to second.
Why it works: Put skew sits roughly 120 points wide on the volatility surface, with downside puts trading materially richer than upside calls. That is fear pricing. The supply at 384 to 388 contained the stock earlier in the month. Kill condition: Two clean daily closes above 388 mean supply has been absorbed.
Time Horizons
Intraday (zero to one day): The 376 to 378 pivot dominates. Above it, 380 is the magnet. Below it, 372 then 370. Most of the day’s range will sit between 372 and 380. Pin behaviour into the weekly expiry is the dominant flow until the print.
Swing (two to ten days): The week is binary. A clean delivery setup with reaffirmed robotaxi commercial timeline takes the stock to 388 then 400. A guidance reset on volumes or margins, especially with any China softness flagged, takes it back to 360 then 352. No third path matters.
Positional (two to eight weeks): The wider trend has rotated into a range between roughly 352 and 405. A monthly close above 405 confirms a fresh leg with a measured target near 440. A monthly close below 352 opens 320. The headline-tape sensitivity to executive commentary is the wildcard that can override the print on any given session.
Risk Score
Stock risk score: around 70 percent.
- Plus 25 percent for an earnings print inside a five-name Mag 7 cluster compressed into two sessions
- Plus 20 percent for the put skew trading roughly 120 points richer than upside calls (fear pricing)
- Plus 15 percent for headline sensitivity to executive commentary and administration policy posts
- Plus 10 percent for VIX at 18.71 and VVIX at 97.18, meaning hedges are still being paid for
- Minus 10 percent because the shelf at 368 to 370 has held twice and block buying confirmed the level
This is a binary-event week. Tesla is a higher-beta version of every Mag 7 risk. Position sizing should reflect that. Kill conditions are non-negotiable.
The Catalyst That Owns The Week
Tesla sits inside the Mag 7 earnings cluster. Three layers set the read. The print itself focuses on deliveries, automotive gross margin excluding credits, energy storage, and any cost commentary tied to China. The conference call carries the robotaxi commercial timeline and the autonomy roadmap, which weigh more than the headline numbers this cycle. The Mag 7 reaction tape matters because Tesla rarely trades in isolation when Apple, Microsoft, Nvidia, Amazon, and Meta are reporting in the same window.
The macro overlay is Powell’s press conference midweek. A dovish tilt adds a discount-rate tailwind that high-beta names amplify. A hawkish hold weighs on the multiples that make the Tesla story work. The headline-tape sensitivity is unique to this name. Administration commentary on tariffs, on China, or on electric vehicle policy can move the stock more than a one percent earnings beat. The only defence is sizing that survives the gap.
Read the long setup as the base case if the shelf holds and the print lands clean. Read the short setup as the trade that activates only on confirmation of supply at 388 or on a guidance reset that breaks the shelf. Both carry kill conditions. The job is not to predict. The job is to be sized for either side and let the levels decide entry.
What We Called vs What Happened
Scoring the Wednesday 22 April read against Friday 26 April close at 376.30.
| Call (22 Apr) | Outcome (by 26 Apr) | Verdict |
|---|---|---|
| Neutral, no trade, post-print digestion with zero edge | Tesla rolled from 387.51 to 376.30 over the window. Sitting it out was the correct call versus chasing the rally on either side | Confirmed |
| Range 380 to 395 the consolidation zone | Lower bound failed. Friday closed below 380 inside a wider 372 to 388 range. Range reset lower | Reversed |
| Support 1 at 375 must hold for neutral to stay neutral | Tagged and held. Friday close at 376.30 sits inside the 368 to 372 shelf zone. Buyers stepped in just above | Partially |
| Wait for break above $400 for longs | Never tested. Distance from spot widened over the window. Long trigger remained clear of price | Open |
| Relative underperformance is a yellow flag | Confirmed. Tesla underperformed the rest of the mega-cap basket through the window. Yellow flag became the lower-third range location | Confirmed |
Track record: two of five calls confirmed over the four-session window. The range floor failed but the broader caution thesis was correct, and the neutral, no-trade discipline saved entries on either side of a rolling tape.
This is analysis, not financial advice. Always manage your risk.
Thursday 23 Apr 2026
Daily Framework Read | Thursday 23 April 2026 | Published 22:00 London / 17:00 New York / 07:00 Tokyo
NVIDIA $199.64 -1.41%
NVIDIA pulled back 1.4%, slipping below $200 again. The decline was more modest than MSFT or TSLA, suggesting the AI narrative still provides relative support. But losing $200 psychologically is not ideal. The stock needs to reclaim that level quickly or risk a drift toward $190.
Framework Read
| Layer | Reading | Interpretation |
|---|---|---|
| Direction | CAUTIOUS LONG | AI narrative supports but $200 must be reclaimed |
| Structure | Testing pivot | $200 is the line between bullish and neutral |
| Momentum | Fading | Short-term momentum turned negative |
| Flow | Mixed | Some profit-taking but long-term holders not selling |
| Evidence | Cautious bullish | AI story intact but needs price confirmation |
Yesterday vs Today
Yesterday NVDA participated in the tech rally. Today it pulled back 1.4%, much less than MSFT’s 4% but still enough to lose $200. The relative outperformance versus other mega-caps suggests the AI investment thesis is providing a floor. But the floor is lowering with each test.
The Read
NVDA at $199.64 is below the psychological $200 mark. The AI capex cycle remains the bull case. Data centre demand is strong. But the stock has been struggling to hold above $200 for multiple sessions. This battle between the narrative and the price action needs resolution. A close above $203 this week would be bullish. Below $195 and the next support is $185.
The call: cautiously long above $195. Buy if $200 is reclaimed with conviction. Stop below $192. Target $210 on breakout.
Key Levels
| Level | Price | Significance |
|---|---|---|
| Target 2 | $215.00 | Measured move on breakout |
| Target 1 | $210.00 | Prior high resistance |
| Pivot | $200.00 | Psychological level. Must reclaim |
| Support 1 | $195.00 | Near-term support |
| Stop Zone | $192.00 | Below here the setup fails |
| Support 2 | $185.00 | Deep support |
What We Called vs What Happened
The framework has been watching $200 as the pivot level. Today it broke below. The call was correct in identifying this as the key level. The question now is whether it reclaims it tomorrow or tests $195 first.
Risk Assessment
Domain risk: Around 45% (moderate)
NVDA carries moderate risk below $200. The AI narrative provides support but valuation concerns persist. The stock is highly sensitive to any shift in the AI capex narrative. Trade with defined risk.
Bottom line: NVDA slipped below $200 on the tech pullback. AI narrative provides a floor but the stock needs to reclaim $200 for the bullish case. Watch $195 support. Cautiously long with defined stops.
Cross-reference: Today’s Sectors Report for tech rotation analysis.
This is analysis, not financial advice. Always manage your risk.
Thursday 23 Apr 2026
Daily Framework Read | Wednesday 22 April 2026 | Published 22:00 London / 17:00 New York / 07:00 Tokyo
NVIDIA $202.50 +1.31%
NVIDIA reclaimed the $200 psychological level and held above it into the close. The framework says LONG. That $200 level has been acting as a magnet for months. Reclaiming it today and closing above it with conviction is a statement. Psychological levels matter because institutions use them as decision points. Above $200, the model says buy. Below $200, the model says wait. Today, the model says buy.
Framework Read
| Layer | Reading | Interpretation |
|---|---|---|
| Direction | LONG | Reclaimed $200. Psychological level now support. Constructive |
| Structure | Reclaiming key level | $200 reclaimed and held. Prior resistance becoming support |
| Momentum | Building | Momentum is turning up from the $200 reclaim. Early-stage acceleration |
| Flow | Institutional interest | Volume picked up on the reclaim. AI narrative continues to draw capital |
| Evidence | Leaning bullish | The $200 reclaim is significant but needs follow-through to confirm |
Yesterday vs Today
Yesterday NVIDIA was hovering around $200 without conviction. Today it pushed through and closed at $202.50. The difference is small in percentage terms but large in structural terms. A close above a key psychological level after multiple tests changes the character. The market has decided that $200 is now support, not resistance.
The Read
The AI capex cycle is still intact. Every major tech company is increasing GPU spend and NVIDIA is the primary beneficiary. The $200 level was psychological resistance because it represented a market cap milestone. Now that the market has accepted that valuation, the path higher is cleaner. The narrative is supportive, the earnings trajectory is supportive, and the price action has confirmed.
The call: long above $200. That level is now the line. Stay long as long as NVIDIA holds above $200 on a closing basis. Target $210 as the next measured move. If $200 fails on a retest, reassess.
Key Levels
| Level | Price | Significance |
|---|---|---|
| Target | $215.00 | Measured move target above the $200 reclaim |
| Resistance | $210.00 | Prior swing high. First test on continuation |
| Pivot | $200.00 | THE level. Now support. Must hold on any retest |
| Support | $195.00 | Structural support below the psychological level |
| Stop Zone | $192.00 | Below here, the reclaim has failed and the picture resets |
What We Called vs What Happened
The framework flagged $200 as the decision level. Today the market made its decision: above. The reclaim was clean, the close was above, and the volume confirmed. The $200 level is now support until proven otherwise.
Risk Assessment
Domain risk: Around 30% (low-moderate)
The $200 reclaim reduces risk because it gives a clear invalidation level. The AI narrative is supportive, the earnings trajectory is strong, and the broader tech sector is rallying. The main risk is a rotation away from AI names, but today’s price action suggests that rotation is not happening yet.
Bottom line: NVIDIA reclaimed $200 and that changes the picture. Long above $200. Target $210-215. Stop below $192. The AI capex cycle is intact and NVIDIA is the primary beneficiary. The psychological level is now your support line.
Cross-reference: Today’s Sectors Report for semiconductor flow and AI capex data.
This is analysis, not financial advice. Always manage your risk.
Tuesday 21 Apr 2026
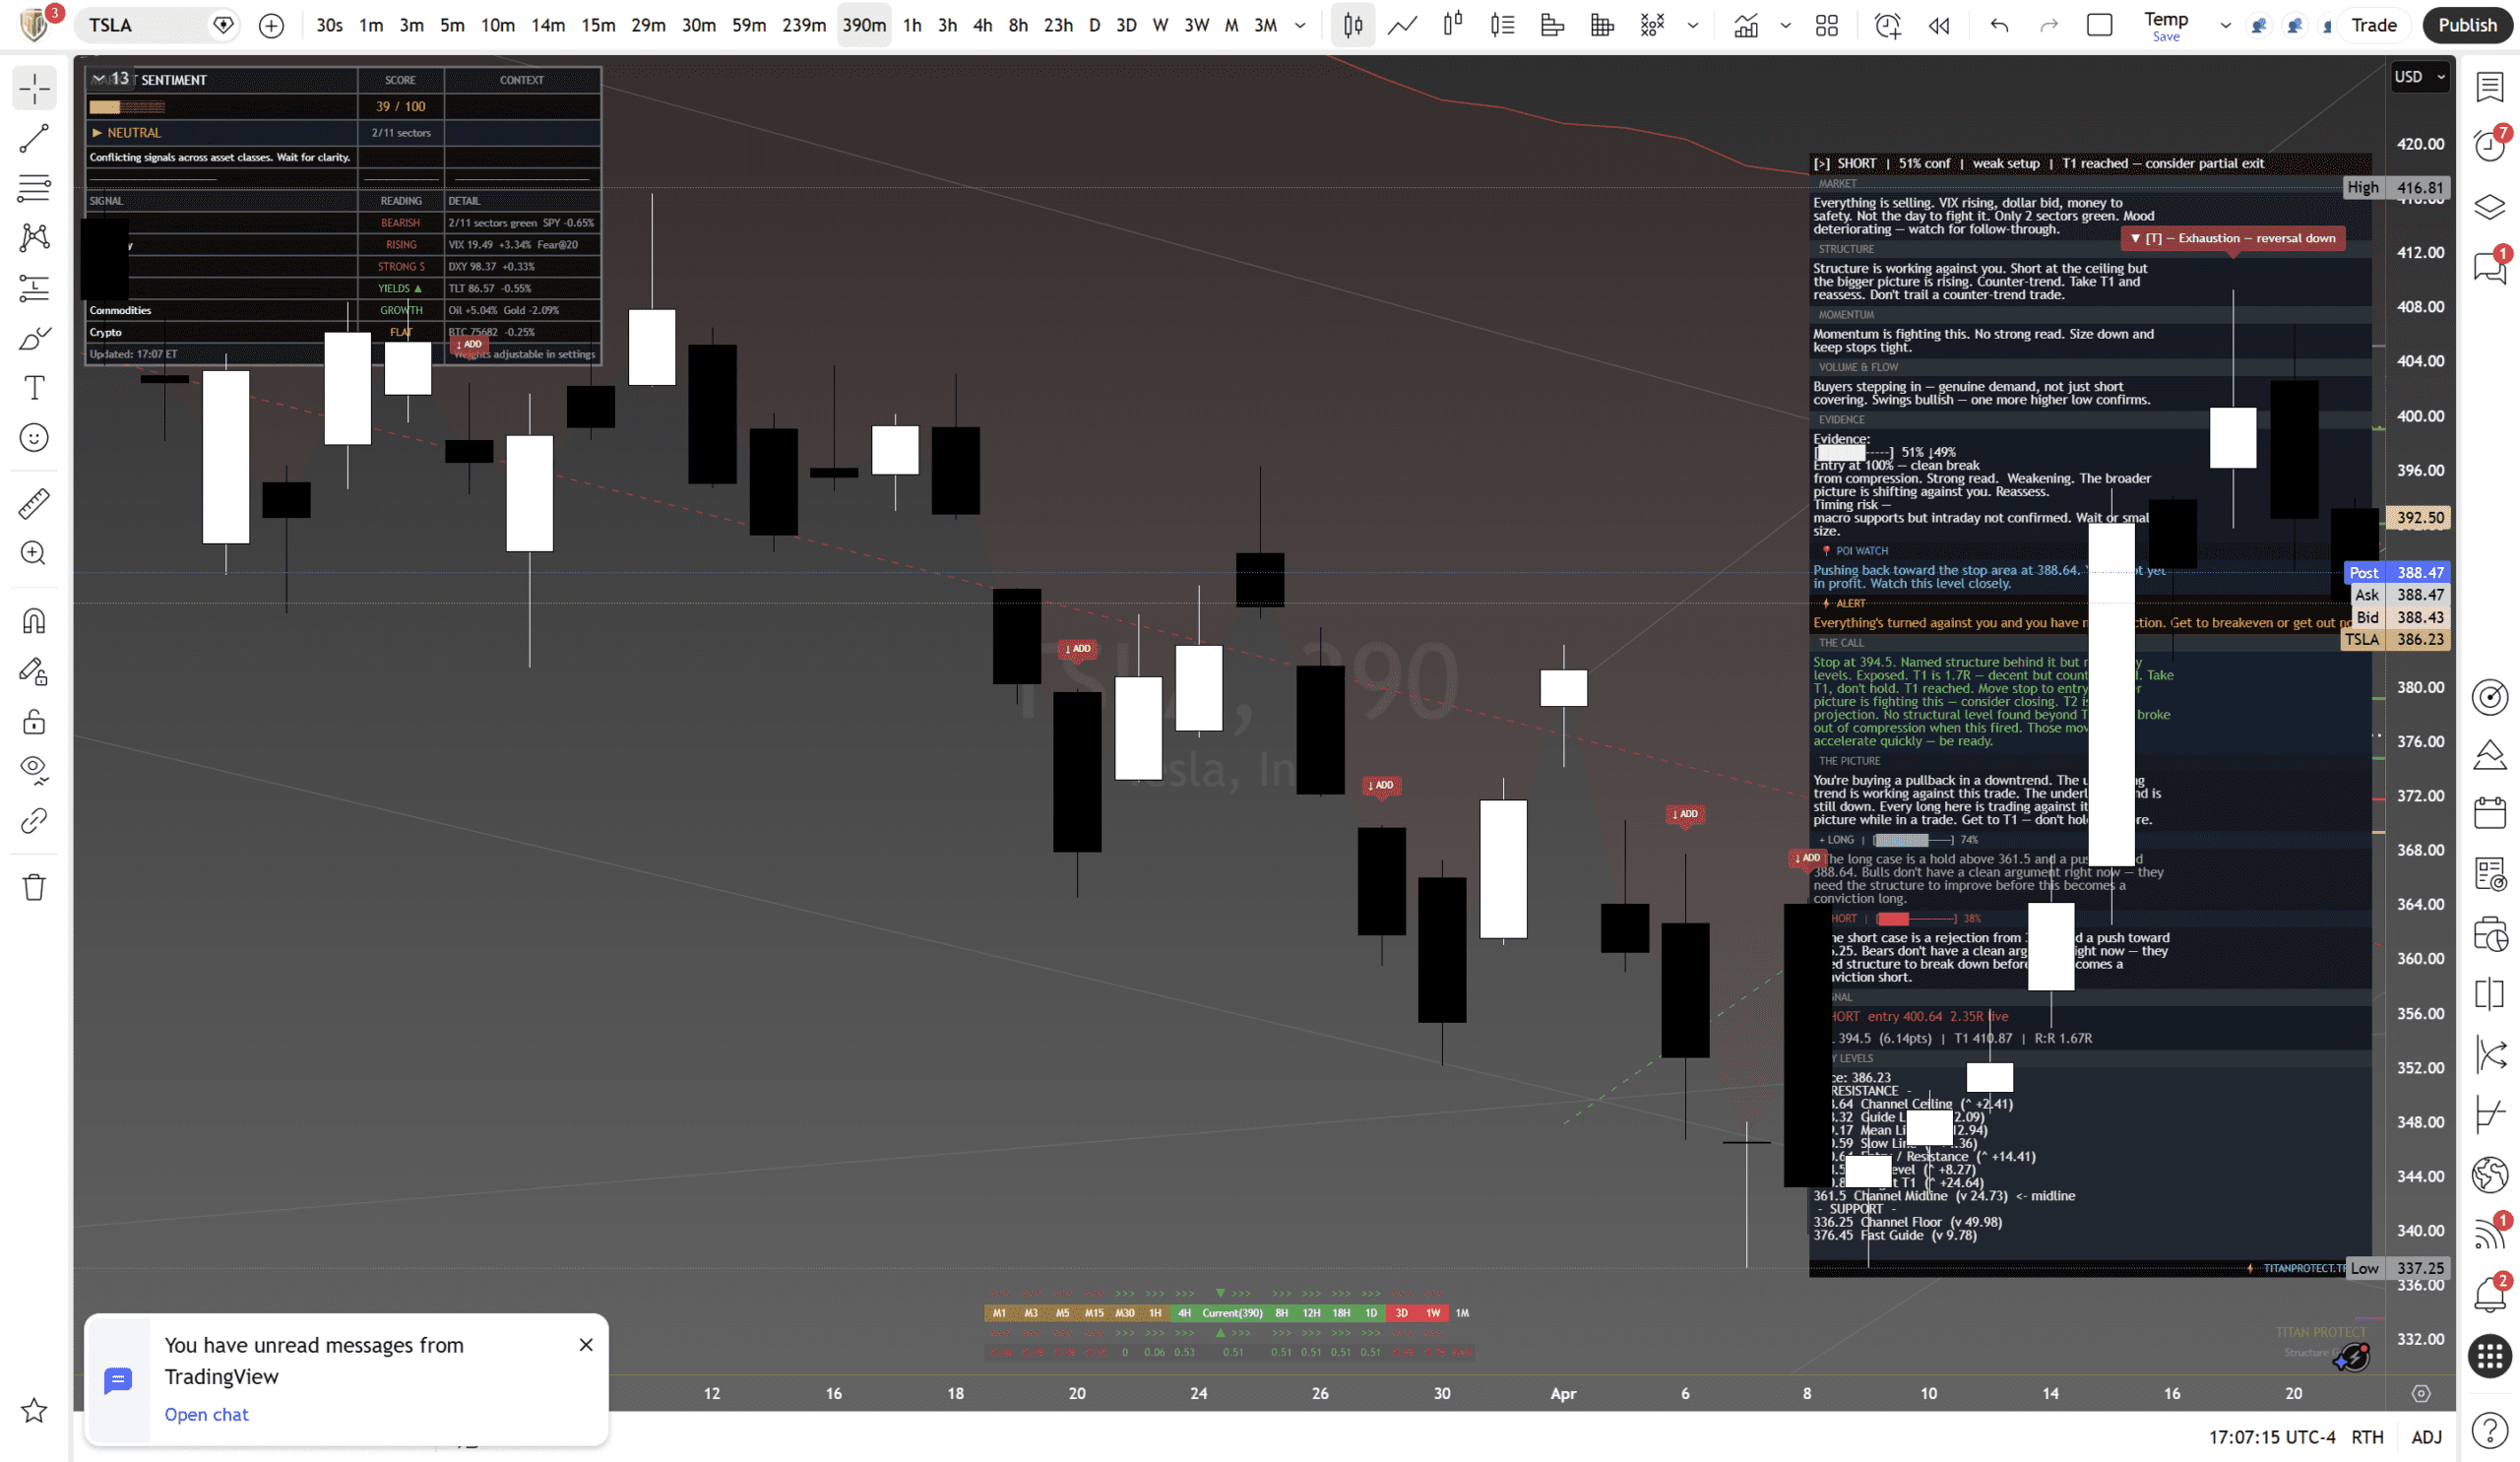
Daily Framework Read | Tuesday 22 April 2026 | Published 22:00 London / 17:00 New York / 07:00 Tokyo
Tesla closed at $386.42, down 1.55% heading into tonight’s earnings report. The framework reads SHORT with targets already reached and exhaustion signals appearing. Structure is working against you if you are long. This is not a stock to be aggressive with in either direction heading into a binary event.
What the Framework Says
| Layer | Reading | Interpretation |
|---|---|---|
| Direction | Short | T1 targets reached. Week setup 1:1 reached. Consider partial exit on existing shorts |
| Structure | Working against | Stalled at the ceiling. The structure is fighting any upside attempt |
| Momentum | Fighting | No strong read. Momentum is split. Neither bulls nor bears have clear control |
| Flow | Sellers pressing | Short covering happening. Genuine demand weak. Exhaustion signals visible. One more higher low cautious |
| Evidence | Downtrend | Overall still in a downtrend. The underlying trend is working against you on the long side. The broader read is a good month to be flat or short |
The Read
Tesla is in a difficult spot. The framework is short, targets have been reached, and exhaustion signals are appearing. That combination usually means: if you are short, take some off. If you are flat, do not initiate into earnings. The risk-reward of a new position here is poor in both directions.
Structure is working against any long attempt. The ceiling has held. Exhaustion is visible on the chart, which means the selling pressure could be fading, but that does not automatically mean buying takes over. Sometimes exhaustion just leads to a sideways grind while the market figures out what comes next.
Earnings tonight. Everything changes after the print. The framework read above is the pre-earnings structural picture. Whatever Tesla reports will override the technical setup for at least the next 48 hours. Position accordingly: either be hedged or be flat.
Key Levels
| Level | Price | Significance |
|---|---|---|
| Ceiling | ~$400-405 | Structure rejected here. Exhaustion signals at this level |
| Current Price | $386.42 | Trading below ceiling rejection. Weak close heading into earnings |
| Fast Guide | $384.30 | Immediate support. Price sitting right on it. Any break opens downside |
| Channel Floor | $361.00 | Structural floor. An earnings miss could push price here quickly |
| T1 (reached) | ~$385 | Short target already hit. Partial profit zone for existing shorts |
Scenario Analysis
| Scenario | Trigger | Implication |
|---|---|---|
| Earnings beat | Strong revenue + guidance | Gap above $400 ceiling. Framework short thesis pauses. Wait for structure to rebuild before re-entering |
| Earnings miss | Revenue miss or weak guidance | Gap toward $361 channel floor. Framework short thesis confirmed. New shorts risky at that point due to exhaustion |
| In-line | Meets expectations, guidance vague | Likely sells off on lack of catalyst. IV crush hurts option holders. The worst outcome for option buyers |
Risk Assessment
Domain risk: Around 75% (elevated)
This is the highest-risk stock of the five today. Earnings tonight make every technical level potentially irrelevant for the next session. The framework reads short with targets hit and exhaustion showing. VIX at 20.29 and implied volatility at the 82nd percentile mean the market expects a big move. Do not be a hero here. If you have no position, the smartest play is watching the reaction and trading the aftermath, not the event itself.
Bottom line: Tesla is short on the framework with targets reached. Earnings tonight will override everything. If you are short, take partial profit. If you are flat, stay flat through the print. Trade the reaction, not the prediction. The structural picture says short but exhaustion says the easy money on that trade has already been made.
This is analysis, not financial advice. Always manage your risk.


