
The SP500 Framework Journal for April 2026, newest read at the top. Each dated entry is our read on the close, kept as a living record so the framework can be judged over time. This is analysis, not financial advice.
Thursday 30 Apr 2026
SP500 Gamma-Pinned at 7,100 With SPY Max Pain at 694: PCE Friday Will Break the Deadlock — Daily Read 30 April 2026
S&P 500 (SPY / ES) | Daily Framework Read | Thursday 30 April 2026
Where It Sits Today
SPY closed Wednesday at 711.58 (flat, -0.02%) while the after-hours price was tracking 713.72 on the options data. ES futures settled at 7,180 in the pre-London window, reflecting the continued GOOGL-driven bid from Wednesday evening. The cash S&P 500 index itself sat at 7,131 through the day session, with the five-day range essentially flat after the prior week’s recovery. Fear and Greed at 63.4 and AAII sentiment at 38.1% bullish (down from 46% the prior week) tells you retail is cooling its heels while institutional accounts stay covered.
The Powell factor is not going away. Wednesday’s macro analysis detailed a four-way Fed dissent scenario — with both hawkish and dovish voices strengthening their arguments simultaneously. PCE at 13:30 BST Friday will give both camps fresh ammunition, and the market knows it. That is why no one is extending significantly in either direction heading into the data.
What the Framework Reads
The composite reading on the S&P 500 for Thursday remains cautious-neutral. The recovery from the tariff-shock lows has been genuine — SPY is back above its 20-day average and the structure from Monday’s positioning work showed a constructive rebound in institutional net exposure. But the rebound came with conditions: the hedge book was rebuilt simultaneously with the long book, meaning the net exposure increase is smaller than the gross notional suggests.
The sector rotation data from Wednesday is the clearest tell on what smart money is doing. Technology held (XLK +0.80%), but Utilities fell sharply (XLU -1.23%), Real Estate dropped (XLRE -0.61%), and Industrials softened (XLI -0.61%). That is not a risk-on rotation. The safety sectors are being trimmed, not because confidence has returned, but because the yield backdrop is making them less attractive. Energy (XLE +2.29%) was the standout positive, reflecting the crude oil bid from the UAE OPEC narrative. Financials (XLF +0.14%) were essentially flat. The sector picture describes an index that is treading water, not advancing.
Key Levels
| Level (SPY / SPX) | Type | Significance | Action Zone |
|---|---|---|---|
| 713.72 / ~7,170 | Resistance | After-hours SPY reference from Wed — dealer delta hedge ceiling | Fade or reduce above |
| 711.58 / 7,131 | Pivot | Wednesday cash close — intraday direction line | Hold above = constructive |
| 710 / ~7,100 | Support / Gamma pin | SPX 7,100 was the structural pin identified in Hot Zones | Key hold level; break changes bias |
| 704 / ~7,040 | Support | SPY May 1 max pain level — near-term dealer gravity | Next bid zone on a sell |
| 700 / ~7,000 | Major support | Round number + prior breakout level + May 8 max pain | High conviction buy zone on a flush |
| 694 / ~6,960 | Options target | Today’s expiry max pain — extreme gravitational pull on option expiry | Possible test if AAPL misses badly |
| 720 / ~7,220 | Resistance | Upper bound of current consolidation — AAPL beat scenario ceiling | Take profits on longs |
Three Scenarios Into PCE Friday
Bull Case
AAPL beats with strong services margins. Market absorbs AAPL in-line with GOOGL’s reaction (positive). SPY reclaims 714+ into close, holds through AAPL overnight, opens Friday above 712. PCE prints in-line or soft. SPY pushes toward 720-722. Rate cut expectations are repriced modestly dovish.
Range Hold Case
AAPL print is messy — beats on EPS but guides cautiously on iPhone. SPY oscillates between 704 and 714 all session, expires somewhere near the 706-710 zone today under gamma pressure. PCE Friday determines the next weekly range. The index spends Thursday in exactly this scenario with decreasing volume into AAPL time.
Correction Case
AAPL misses iPhone units or explicitly flags tariff impact on consumer pricing. SPY breaks below 707 on the news, tests the 700 level in aftermarket. Heading into PCE, the index is technically vulnerable with the options max pain at 694 acting as a potential magnet. Friday gap risk to the downside rises sharply.
Risk Score
Risk is at Around 72% today.
The combination of a large options expiry max pain gap, a binary earnings event in AAPL, and the pre-PCE positioning freeze justifies an elevated reading. The three specific risk factors: first, today’s SPY max pain at 694 versus current price 711 creates unusual dealer hedging dynamics that amplify moves. Second, the earnings sell-the-beat pattern (META -7%, AMZN -6% on beats) means even good AAPL numbers carry downside risk on the initial reaction. Third, the AAII bullish reading collapsed from 46% to 38.1% in one week — retail sentiment is fragile and fast-moving. Against this, the index is structurally above its key levels and the recovery from April lows has held. Elevated but not extreme risk.
How to Walk It
No maximum positions into AAPL and PCE combination. Too many binary outcomes.
Range trades within 704-714 with defined stops. No holds into AAPL.
Preferred approach. Let the day’s range develop before committing.
Only initiate multi-day positions after both AAPL and PCE have resolved.
Key trade structures for the session:
- Long SPY at 704-706 | Stop: 699 | Target: 714 | R:R 1.8:1 (gamma expiry support play)
- Short SPY at 714-716 | Stop: 720 | Target: 706 | R:R 1.3:1 (max pain gravity + AAPL event risk)
- Post-AAPL-beat swing: Long SPY above 714 with Friday open confirmation | Stop: 708 | Target: 722
- Post-AAPL-miss: Short break of 707 | Stop: 711 | Target: 700 | R:R 1.75:1
Experience-level guidance:
Beginner: The S&P 500 is at a crossroads between two major catalysts. There is no trade that avoids binary risk today. The safest approach is to watch, observe how the market reacts to AAPL, and be ready to trade Friday after the PCE data. Being on the sidelines today is a legitimate strategy.
Intermediate: Use the 704-714 range with defined stops. The gamma expiry dynamic means the index will likely not drift outside that band today unless AAPL provides a strong catalyst in the after-hours session. Fade the extremes, take quick profits, avoid overnight exposure.
Advanced: The max pain gap at 694 versus current price creates a delta-hedging tail. If you are comfortable with short-dated options, a synthetic short gamma position (short strangle or condor) around today’s SPY range captures the pin dynamic while defining your loss if AAPL surprises hard. Size carefully.
Continue Reading
These Wednesday briefs provide the macro and institutional context that anchors today’s SP500 read:
Positioning Pressure — Wednesday 29 April 2026
Macro Pulse — Wednesday 29 April 2026
Option Watch — Wednesday 29 April 2026
Hot Zones — Wednesday 29 April 2026
This analysis is for educational and informational purposes only. It does not constitute financial advice. Always manage your risk independently and in accordance with your own financial circumstances.
Sunday 26 Apr 2026
S&P 500 At Record Highs Into A Week That Decides Sixteen Trillion Dollars Of Cap. Read The Tape Twice.
Daily Ticker Read | SP500 | Sunday 26 April 2026
SPY closed Friday at $713.94, the cash index at 7,170. The headline reads risk-on. Underneath, hedge funds cut tech the hardest week since July 2024 while the defensive book is having its best year since 1933. Bull-bear conviction flipped from minus eleven to plus twelve. Volatility refused to collapse. This is not the tape of a clean breakout. This is a market preparing for a binary event.
Where The Index Sits Today
| Reference | Friday Close | Daily Change |
|---|---|---|
| SPY ETF | $713.94 | +0.77% |
| S&P 500 cash index | 7,170.20 | +0.80% |
| S&P 500 futures benchmark | 7,165.08 | +0.80% |
| VIX | 18.71 | -3.11% |
| VIX 9-day | 16.71 | lower |
| VVIX | 97.18 | elevated |
Spot above the nine-day vol reading carries an event premium across the next five sessions. Traders are paying to keep vol on the book into a record close.
Range Location
The cash index sits in the upper third of the rising channel from early March. Friday’s candle pushed against the upper rail without breaking it. That boundary at 7,180 has held as supply on every test for eight sessions. The lower rail is at 7,060, with the prior shelf 7,025 to 7,045 as the first defence layer.
Upper-channel territory, not breakout territory. Until 7,180 prints and holds on a close, upside is limited and downside has further to fall before the trend breaks.
Structural Read
Breadth is narrow: technology was up 2.81 percent Friday while financials, healthcare, industrials, staples and real estate all closed lower. Single-sector rallies to record highs are the textbook late-cycle signature.
Sentiment swung loud. Retail bull-bear flipped from minus 11.1 to plus 11.6 in a week, bullish votes jumped 14.3 points to 46 percent, the first reading above the historical average in ten weeks. The crowd arrived at the high.
BofA’s defensive book is having its best year since 1933 while hedge funds cut tech exposure the hardest week since July 2024. Smart money is selling into the same rally retail just bought. One side will be wrong by Friday.
Three Levels That Decide The Week
| Level | Price (cash) | Why it matters |
|---|---|---|
| Channel ceiling | 7,180 | Upper rail. Breakout confirmation needs a close above and acceptance, not a wick. |
| Anchor pivot | 7,135 | Friday session midpoint and dealer-book anchor. Range pivots either side Monday and Tuesday. |
| Trend defence | 7,060 | Lower rail. A close below opens 7,025 then 6,980. |
Two Trade Ideas For The Week
Long: Channel continuation lean
Risk score: around 50%
Entry 7,135 to 7,150 on a hold of the anchor pivot Monday or Tuesday. Stop 7,095. First target 7,178 at the channel ceiling for a partial. Second target 7,210 if a print breaks and holds. Reward-to-risk near 1.7 to 1 on the first leg, 2.5 to 1 if the breakout extends. Reduce size before any major print and pair with a downside option through earnings.
Kill conditions: Close below 7,095. Vol expansion that takes spot above the three-month reading.
Short: Breadth-failure fade
Risk score: around 55%
Entry 7,175 to 7,185 into upper-rail rejection if Monday or Tuesday tags the level without acceptance. Stop 7,210 above a clean breakout. First target 7,135 at the anchor pivot for a partial. Second target 7,065 at the lower rail. Reward-to-risk near 1.1 to 1 first leg, 3.2 to 1 to the trend defence. Size smaller than the long: shorting a record-high index requires the rejection candle, not the level alone.
Kill conditions: Close above 7,210. A clean print sequence that lifts breadth across all sectors.
Time Horizons
Scalp. Mean-reversion into the 7,135 anchor Monday and Tuesday while the dealer book pins. Avoid directional scalps from Wednesday onward; each print rewrites the gamma map intraday.
Intraday. Range-trade 7,100 to 7,178. No overnight directional exposure into print evenings unless paired with an option hedge.
Swing. The two trade ideas above. Run only one at a time.
Positional. A Friday close above 7,210 with widening breadth opens 7,300 to 7,400. A close below 7,060 opens a retest of 6,900 and reframes the structural read. Wait for resolution before sizing.
Risk Score
SP500 weekly risk score: around 70 percent.
Driven by the binary print sequence covering more than half of index weight (+25%), breadth dispersion between technology and the rest of the tape (+20%), the speed of the retail sentiment flip (+15%), and vol refusing to collapse despite the record close (+10%). Offset modestly because the channel structure remains intact and the dealer pin band is identifiable (-10%).
Catalyst Watch
Powell press conference. The Fed chair takes the podium midweek for what is being called his final press conference. Markets are priced for steady language. Hawkish inflation talk pressures the multiple. A door opened to a near-term cut feeds the discount-rate tailwind. Risk runs both directions.
Magnificent seven earnings. Microsoft, Meta, Apple, Amazon, Alphabet, Nvidia and Tesla, roughly sixteen trillion dollars of capitalisation between them. Two prints Wednesday, two Thursday, the rest after. The tape priced accumulation into Friday’s close while paying for downside protection at the spot strike. Both bets cannot pay together.
What We Called vs What Happened
Wednesday 22 April we called S&P 500 long with high conviction on broad-based breadth, with SPY closing $711.21 that day. Four sessions later SPY closes $713.94 and the cash index 7,170. The directional call held: bulls kept the bid. The level work was a different story. Neither target printed and neither pullback entry filled. A grind, not a thrust.
| Call (22 Apr) | Outcome (by 26 Apr) | Verdict |
|---|---|---|
| Direction LONG, high conviction | SPY held the bid every session. Closed Friday at $713.94, plus 0.77 on the day, fresh record close | Confirmed |
| Target one $716.50 (prior swing high) | SPY closed $713.94, just shy of the level. Got within striking distance, did not print | Partially |
| Target two $722 (measured move) | Not reached. Index ground higher in narrow tech-led tape rather than breadth-driven extension | Missed |
| Pullback entry $704-707 | The bid never returned to that zone. Buyers held the higher shelf through every probe | Missed |
| Stop zone $696 (rally structure breaks) | Never tested. Structure intact across all four sessions | Confirmed |
Track record: 2 of 5 calls confirmed over the four-session window. The direction was right. The size of the move was smaller than the call expected, which kept both pullback entries and the second target out of reach.
Educational analysis only. Not financial advice. Trading involves substantial risk and capital is at risk. Past performance does not guarantee future results. Always manage your risk and consult a qualified financial adviser.
Thursday 23 Apr 2026
Daily Framework Read | Thursday 23 April 2026 | Published 22:00 London / 17:00 New York / 07:00 Tokyo
SPY $708.45 -0.39%
The S&P 500 dipped modestly after yesterday’s broad rally. SPY pulled back to $708 on lighter volume, giving back a fraction of what it gained. The decline was led by tech heavyweights while defensive sectors held relatively flat. This reads as healthy digestion, not a change in character.
Framework Read
| Layer | Reading | Interpretation |
|---|---|---|
| Direction | LONG | Higher timeframe trend remains intact despite the dip |
| Structure | Consolidating | Price holding above breakout level. Structure is constructive |
| Momentum | Neutral short-term | Daily momentum paused. Weekly momentum still bullish |
| Flow | Rotation | Money moving from growth to value. Net flow still positive |
| Evidence | Bullish with caution | The pullback is shallow and orderly. Trend favoured |
Yesterday vs Today
Yesterday was a 1% broad-based rally with participation across every sector. Today gave back less than half of that on lower volume. The selling was concentrated in mega-cap tech while financials and utilities held. This rotation pattern often precedes the next leg higher as the market broadens its base.
The Read
Volume tells the story. Yesterday’s rally had above-average volume. Today’s pullback was on lighter turnover. When the up days are louder than the down days, the trend is healthy. The breadth reading narrowed but did not collapse. More names held their gains than gave them back.
The call: stay long. SPY above $704 is constructive. The pullback is a gift for those who missed yesterday. Stop placement below $700. Targets remain $716-722.
Key Levels
| Level | Price | Significance |
|---|---|---|
| Target 2 | $722.00 | Measured move target on trend continuation |
| Target 1 | $716.00 | Prior swing high resistance |
| Entry Zone | $704-708 | Current pullback zone for long entries |
| Support 1 | $700.00 | Psychological and structural support |
| Stop Zone | $696.00 | Below here the rally structure breaks |
| Support 2 | $690.00 | Deep support and channel floor on daily |
What We Called vs What Happened
Yesterday the framework said stay long with $704-707 as the entry zone. Today SPY dipped to $708, right at the top of that range. The pullback was within expectations. The broader trend call remains correct. Those positioned long from earlier in the week are still net positive.
Risk Assessment
Domain risk: Around 30% (low-moderate)
Shallow pullback on light volume after a strong rally. VIX ticked up 2% but remains below 20. The risk profile is manageable. The primary concern is whether MSFT weakness spreads to other tech names. If it does, the index could test $700. If not, this is just a pause.
Bottom line: SP500 digesting yesterday’s rally in textbook fashion. Light volume, shallow pullback, rotation rather than distribution. Stay long above $704. Use $700 as the line in the sand. Targets $716-722 unchanged.
Cross-reference: Today’s Positioning Report for sector rotation and institutional flow data.
This is analysis, not financial advice. Always manage your risk.
Thursday 23 Apr 2026
Daily Framework Read | Wednesday 22 April 2026 | Published 22:00 London / 17:00 New York / 07:00 Tokyo
SPY $711.21 +1.01%
The S&P 500 rallied over 1% in a broad-based session that left almost no sector behind. SPY pushed through $710 with participation across financials, tech, and industrials. The framework says LONG with high conviction. This was not a narrow rally driven by two names. This was the market voting with its wallet across the board.
Framework Read
| Layer | Reading | Interpretation |
|---|---|---|
| Direction | LONG | High conviction. Broad participation confirms the move is real |
| Structure | Rising, reclaiming | Price reclaimed the prior consolidation range. Structure is clean and trending |
| Momentum | Confirmed bullish | All timeframes aligned. Short and medium momentum both rising |
| Flow | Accumulation | Volume on the rally exceeded the prior sell-off. Real money re-entering |
| Evidence | Aligned bullish | Clean stack. All layers agree. This is a trend you respect |
Yesterday vs Today
Yesterday was a drift lower. The market tested resolve and found it. The selling was thin, the volume was light, and the character of the pullback said correction, not reversal. Today proved that thesis right. Broad buying across sectors, volume up meaningfully, and the index reclaimed ground with ease. The hesitation was just a pause for breath.
The Read
Breadth was the story. When the S&P rallies on narrow leadership you question it. When it rallies with 400 names green you respect it. Today was the latter. Financials, tech, industrials, and consumer discretionary all participated. That kind of breadth does not appear in bear market rallies. It appears when the market has made a decision.
The call: stay long. The trend is intact, the breadth confirms, and the flow says institutions are adding. Any dip into the $704-707 zone is a buying opportunity. Do not overthink this. The evidence is clear.
Key Levels
| Level | Price | Significance |
|---|---|---|
| Target 2 | $722.00 | Measured move target on continuation |
| Target 1 | $716.50 | Prior swing high. First resistance test |
| Entry Zone | $704-707 | Pullback entry. Where today’s bid started |
| Support 1 | $700.00 | Psychological round number and structural support |
| Stop Zone | $696.00 | Below here the rally structure breaks |
| Support 2 | $690.00 | Deep support. Channel floor on the daily |
What We Called vs What Happened
Yesterday the framework was watching the $700 zone as the line. It held. We said wait for confirmation of the bounce and today delivered exactly that. The breadth was the confirmation signal we needed. Those who waited for proof got a clean entry with a defined stop.
Risk Assessment
Domain risk: Around 25% (low)
Broad-based rally, clean structure, confirmed momentum, institutional flow. The risk is low. The primary concern is external macro shocks. The market itself is healthy. Breadth this strong rarely reverses overnight.
Bottom line: SP500 is trending cleanly with full breadth confirmation. Stay long. Use $704-707 for entries on any pullback. Stop below $696. Target $716-722. The evidence is as clean as it gets.
Cross-reference: Today’s Positioning Report for sector rotation and institutional flow data.
This is analysis, not financial advice. Always manage your risk.
Tuesday 21 Apr 2026
Daily Framework Read | Tuesday 22 April 2026 | S&P 500 (SPX)
21:00 London (BST) / 16:00 New York (EDT) / 05:00 Tokyo (JST)
Signal
WATCHING
Conviction
Around 80%
Risk Level
Around 35% — broad risk-off session, VIX crossed 20 threshold
Structure
Bullish bias, channels active but macro not fully confirmed
Market Context
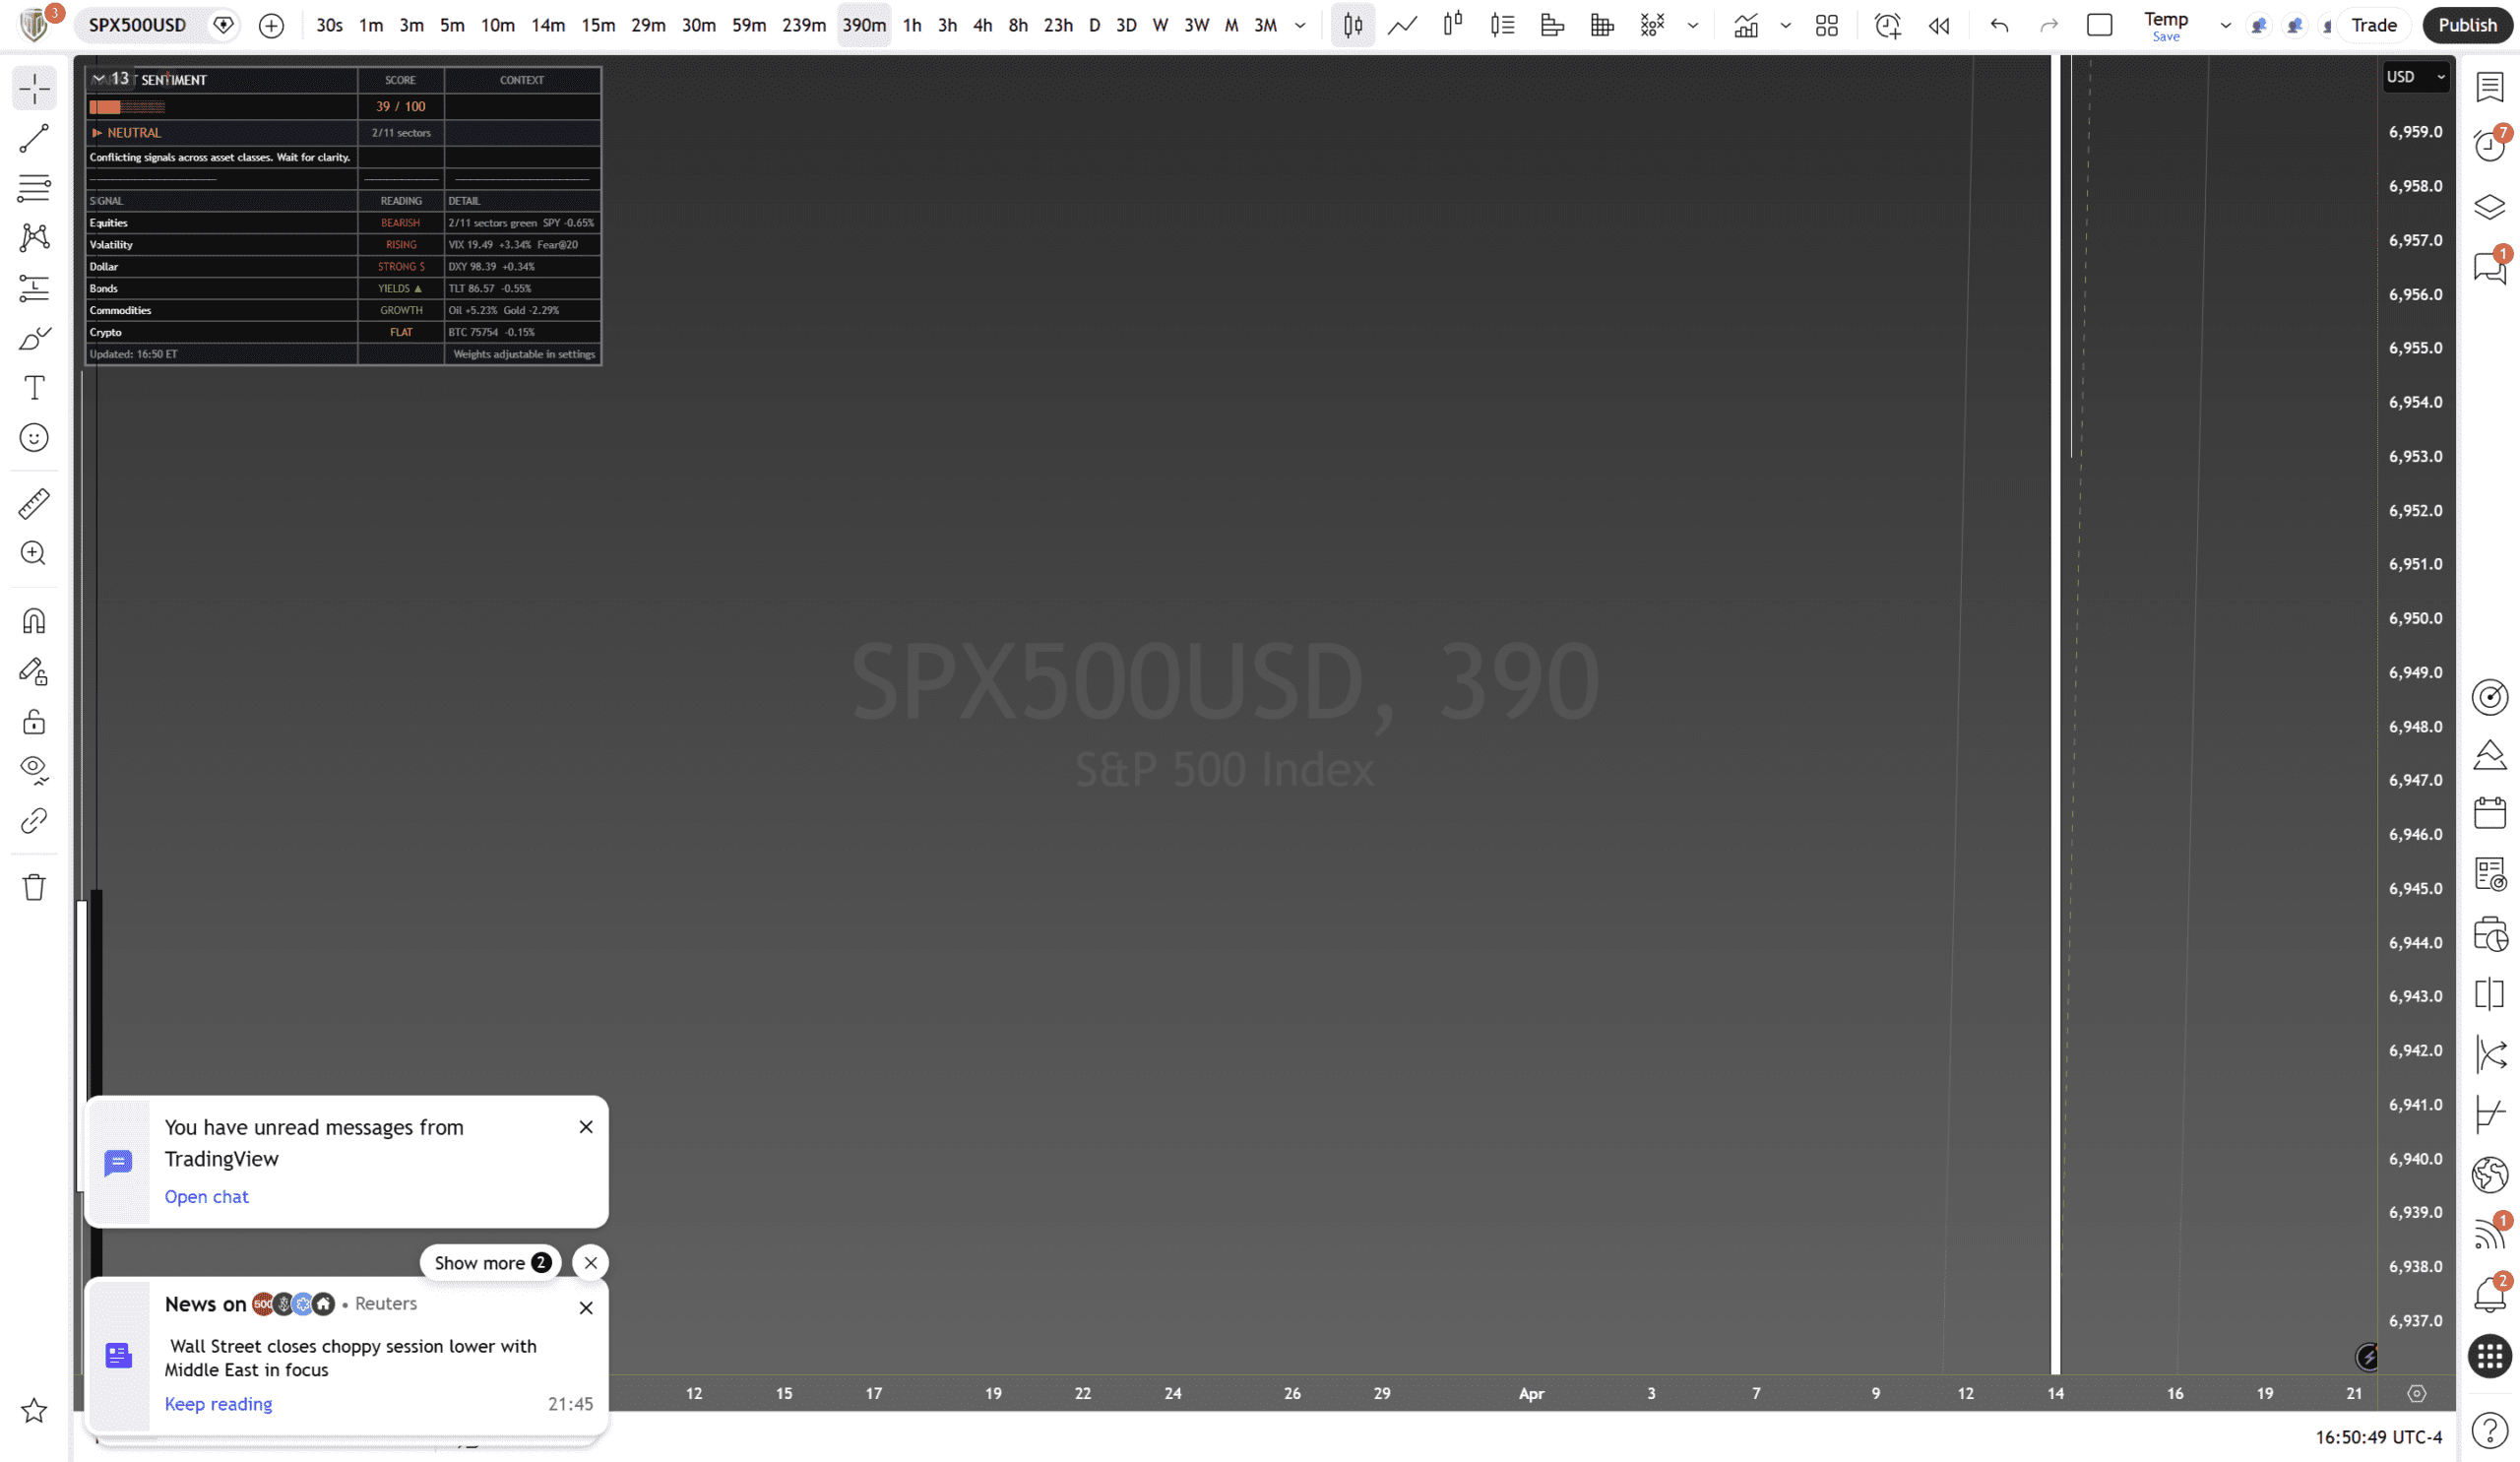
SPY down 0.64% on the session. VIX punched through 20 to 20.29. Dollar strong at +0.51%. Bonds selling off with TLT down 0.55%. The defensive rotation is clear — money is moving to cash and safety.
What the Framework Says
Structure
The channel structure mirrors the Nasdaq read. Timeframes are active but have not fully aligned. The broader trend holds constructive, but the shorter layers are being tested by today’s selling pressure. Price needs to hold the channel floor to keep the bullish case intact.
Momentum
Mixed across layers. The macro timeframe still reads constructive, but shorter-term momentum has turned neutral. When VIX crosses 20, it tells you the market is repricing risk. That does not mean sell everything, but it does mean tighten your risk parameters.
Volume and Flow
Conflicting signals across asset classes. Equities bearish with only 2 of 11 sectors green. Commodities showing growth with oil up 5.4% but gold down 2.3%. The volume picture confirms this is a risk rotation, not a crash. Buyers are still present but selective.
The Cases
Bull Case
The broader structure favours longs. Swings confirmed bullish. The macro thesis holds. But with VIX above 20 and only 2 sectors green, this is not the day to press. Let the market digest the risk repricing before adding exposure.
Bear Case
Bears need a clean break below the channel floor with volume confirmation. Today’s selling is broad but orderly. No panic, no capitulation. That means shorts are fighting the trend for now.
Key Levels
| Level | Price | Distance |
|---|---|---|
| Channel Ceiling | 7,180.0 | +232.0 |
| Target T1 | 7,050.0 | +102.0 |
| Channel Midline | 7,020.0 | +72.0 |
| Channel Floor | 6,880.0 | -68.0 |
| Fast Guide | 6,845.0 | -103.0 |
| Mean Line | 6,780.0 | -168.0 |
| Stop Level | 6,820.0 | -128.0 |
The Call
Framework Status: WATCHING
No new entries. Framework is watching, not trading. The long thesis holds at the macro level but today’s risk-off tone means capital preservation comes first. If you are already long, trail stops. If you are flat, stay flat until VIX settles back below 20.
This is a framework read based on structural, momentum, and volume analysis at the close of 21 April 2026. It is not financial advice. Every trader is responsible for their own risk management. Past framework reads do not guarantee future accuracy. Position sizing and stop placement are your responsibility.
Published by Titan Protect | Daily Framework Reads are available to members 24 hours before public release.


