
The NAS100 Framework Journal for May 2026, newest read at the top. Each dated entry is our read on the close, kept as a living record so the framework can be judged over time. This is analysis, not financial advice.
Saturday 30 May 2026
Nasdaq 100 — Daily Read | Saturday 30 May 2026
Nasdaq 100 | Post Close Setup Daily Read | Data basis: 2026-05-30 close
Where It Sits
Structure
Structurally Nasdaq 100 sits above its short-term moving averages with the daily trend firmly higher. The recent advance has been orderly with no signs of distribution or topping behaviour. The reference anchor at 30,324 acts as the bias line.
Momentum
Momentum is neutral with internal readings near the centre of the range. That is the signature of a market digesting the prior move. The tape needs a fresh catalyst to commit to direction.
Volume & Flow
Flow on the session close was measured. Positioning data suggests steady accumulation rather than aggressive directional commitment. The pattern supports continuation rather than reversal.
Key Levels
| Level | Type | Significance | Action Zone |
|---|---|---|---|
| 30,710 | Resistance | Upper range target, prior supply zone | Take profits / fade if rejected |
| 30,450 | Pivot | Mid-range continuation marker | Hold = constructive; lose = consolidation |
| 30,324 | Session close | Reference anchor for next session | Above = continuation; below = mean revert |
| 30,120 | Support | Recent range floor, demand zone | Buy zone with defined stop |
| 29,860 | Major support | Prior breakout retest level | Stop-out below for longs |
Three Scenarios
Continuation
Nasdaq 100 holds above the session close at 30,324 and extends higher on continued institutional flow. The vol regime supports trending moves and the path of least resistance remains up. Watch for a clean hold above the pivot level to confirm.
Range
Nasdaq 100 opens flat and churns around the 30,324 level. Magnet to the prior close. The tape needs a fresh catalyst to commit. Range trade with defined stops.
Mean Reversion
Nasdaq 100 opens firm but meets supply at the pivot, fades back below 30,324. Failed breakout pattern. Not the base case but worth size discipline if volatility expands.
Risk Score
Risk sits at Around 55%
Risk sits around 55 per cent. Vix at 15.4 supports a measured risk posture. sentiment at 61 is in greed territory. Index-level positions carry concentration risk in the leading names. Standard sizing with defined stops — discipline beats conviction.
How to Walk It
Entry / Stop / Target structure:
- Long 30,120 pullback | Stop 29,860 | Target 30,450 | R:R 2:1
- Long 30,450 breakout | Stop 30,324 | Target 30,710 | R:R 1.5:1
- Fade 30,710 rejection | Stop above resistance | Target 30,324 | R:R 2:1
Experience-level guidance:
Beginner: Reduce size to half your standard. Trade only the cleanest setup from the entries above. If the tape opens against your bias, do nothing — wait for the second hour, when the institutional flow has tipped its hand.
Intermediate: Use the levels table to define the trading range. Fade the extremes with defined stops, take profits before the round-number resistance levels.
Advanced: The vol regime supports defined-risk structures around the key pivot levels. Keep notional small relative to your book — asymmetric speculation, not core positioning.
Continue Reading
The macro frame driving this read is unpacked in the session briefs:
Check the latest session briefs on the site.
This analysis is for educational and informational purposes only. It does not constitute financial advice. Always manage your risk independently and in accordance with your own financial circumstances.
Thursday 28 May 2026
Nasdaq 100 — Daily Framework Read | Thursday 28 May 2026
Nasdaq 100 | Post Close Setup Daily Read | Data basis: 2026-05-28 close
Where It Sits
Structure
Structurally Nasdaq 100 sits above its short-term moving averages with the daily trend firmly higher. The recent advance has been orderly with no signs of distribution or topping behaviour. The reference anchor at 30,224 acts as the bias line.
Momentum
Momentum is positive but measured. The advance has been orderly without stretching the range. Internal readings are constructive without flagging exhaustion — supportive of continuation.
Volume & Flow
Flow on the session close was measured. Positioning data suggests steady accumulation rather than aggressive directional commitment. The pattern supports continuation rather than reversal.
Key Levels
| Level | Type | Significance | Action Zone |
|---|---|---|---|
| 30,850 | Resistance | Upper range target, prior supply zone | Take profits / fade if rejected |
| 30,430 | Pivot | Mid-range continuation marker | Hold = constructive; lose = consolidation |
| 30,224 | Session close | Reference anchor for next session | Above = continuation; below = mean revert |
| 29,890 | Support | Recent range floor, demand zone | Buy zone with defined stop |
| 29,480 | Major support | Prior breakout retest level | Stop-out below for longs |
Three Scenarios
Continuation
Nasdaq 100 holds above the session close at 30,224 and extends higher on continued institutional flow. The vol regime supports trending moves and the path of least resistance remains up. Watch for a clean hold above the pivot level to confirm.
Range
Nasdaq 100 opens flat and churns around the 30,224 level. Magnet to the prior close. The tape needs a fresh catalyst to commit. Range trade with defined stops.
Mean Reversion
Nasdaq 100 opens firm but meets supply at the pivot, fades back below 30,224. Failed breakout pattern. Not the base case but worth size discipline if volatility expands.
Risk Score
Risk sits at Around 55%
Risk sits around 55 per cent. Vix at 15.7 supports a measured risk posture. sentiment at 60 is in greed territory. Index-level positions carry concentration risk in the leading names. Standard sizing with defined stops — discipline beats conviction.
How to Walk It
Entry / Stop / Target structure:
- Long 29,890 pullback | Stop 29,480 | Target 30,430 | R:R 2:1
- Long 30,430 breakout | Stop 30,224 | Target 30,850 | R:R 1.5:1
- Fade 30,850 rejection | Stop above resistance | Target 30,224 | R:R 2:1
Experience-level guidance:
Beginner: Reduce size to half your standard. Trade only the cleanest setup from the entries above. If the tape opens against your bias, do nothing — wait for the second hour, when the institutional flow has tipped its hand.
Intermediate: Use the levels table to define the trading range. Fade the extremes with defined stops, take profits before the round-number resistance levels.
Advanced: The vol regime supports defined-risk structures around the key pivot levels. Keep notional small relative to your book — asymmetric speculation, not core positioning.
Continue Reading
The macro frame driving this read is unpacked in the session briefs:
Check the latest session briefs on the site.
This analysis is for educational and informational purposes only. It does not constitute financial advice. Always manage your risk independently and in accordance with your own financial circumstances.
Thursday 28 May 2026
Nasdaq 100 — Daily Framework Read | Thursday 28 May 2026
Nasdaq 100 | Pre Asia Setup Daily Read | Data basis: 2026-05-28 close
Where It Sits
Structure
Structurally Nasdaq 100 has pulled back into the session close. The broader trend remains intact on the daily timeframe but the shorter timeframe has softened. The structure is contested near the 29,974 level.
Momentum
Momentum is neutral with internal readings near the centre of the range. That is the signature of a market digesting the prior move. The tape needs a fresh catalyst to commit to direction.
Volume & Flow
Flow on the session close was measured. Positioning data suggests steady accumulation rather than aggressive directional commitment. The pattern supports continuation rather than reversal.
Key Levels
| Level | Type | Significance | Action Zone |
|---|---|---|---|
| 30,410 | Resistance | Upper range target, prior supply zone | Take profits / fade if rejected |
| 30,120 | Pivot | Mid-range continuation marker | Hold = constructive; lose = consolidation |
| 29,974 | Session close | Reference anchor for next session | Above = continuation; below = mean revert |
| 29,740 | Support | Recent range floor, demand zone | Buy zone with defined stop |
| 29,450 | Major support | Prior breakout retest level | Stop-out below for longs |
Three Scenarios
Continuation
Nasdaq 100 holds above the session close at 29,974 and extends higher on continued institutional flow. The vol regime supports trending moves and the path of least resistance remains up. Watch for a clean hold above the pivot level to confirm.
Range
Nasdaq 100 opens flat and churns around the 29,974 level. Magnet to the prior close. The tape needs a fresh catalyst to commit. Range trade with defined stops.
Mean Reversion
Nasdaq 100 opens firm but meets supply at the pivot, fades back below 29,974. Failed breakout pattern. Not the base case but worth size discipline if volatility expands.
Risk Score
Risk sits at Around 55%
Risk sits around 55 per cent. Vix at 16.3 supports a measured risk posture. sentiment at 61 is in greed territory. Index-level positions carry concentration risk in the leading names. Standard sizing with defined stops — discipline beats conviction.
How to Walk It
Entry / Stop / Target structure:
- Long 29,740 pullback | Stop 29,450 | Target 30,120 | R:R 2:1
- Long 30,120 breakout | Stop 29,974 | Target 30,410 | R:R 1.5:1
- Fade 30,410 rejection | Stop above resistance | Target 29,974 | R:R 2:1
Experience-level guidance:
Beginner: Reduce size to half your standard. Trade only the cleanest setup from the entries above. If the tape opens against your bias, do nothing — wait for the second hour, when the institutional flow has tipped its hand.
Intermediate: Use the levels table to define the trading range. Fade the extremes with defined stops, take profits before the round-number resistance levels.
Advanced: The vol regime supports defined-risk structures around the key pivot levels. Keep notional small relative to your book — asymmetric speculation, not core positioning.
Continue Reading
The macro frame driving this read is unpacked in the session briefs:
Check the latest session briefs on the site.
This analysis is for educational and informational purposes only. It does not constitute financial advice. Always manage your risk independently and in accordance with your own financial circumstances.
Tuesday 26 May 2026
The Nasdaq 100 closed the week in fine form. Price has been climbing a clear structural ladder, breaking successive resistance zones and holding above each one in turn. Every pullback this week has been shallow and controlled, with buyers stepping in before any meaningful damage could develop. The structural picture is about as clean as you will see on a major index going into a long weekend. The trend is intact, the momentum is aligned, and the path of least resistance remains higher.
Our analysis flagged the bullish bias early in the session and it held through the close. The momentum assessment shows buyers firmly in control across multiple timeframes, with short-term dips being absorbed quickly. The key development this week was the sustained hold above a major trend confluence, which has now been reclaimed and confirmed on the daily. That is a meaningful shift in the structural landscape and gives longs a credible base to work from.
Heading into next week, the biggest risk for longs is the extended bank holiday window. Three-day weekend gaps can flush out weak hands on the open, so position sizing matters. If price opens above the weekly close zone on Tuesday, the path back toward the upper channel band is open. A gap fill back into the 19,100 to 19,200 area would not break the trend but would need to hold to keep the bullish thesis alive.
| Level | Price | Notes |
|---|---|---|
| Entry Zone | 19,200 – 19,320 | Structural hold area, trend confluence |
| Stop | 18,980 | Below weekly demand, invalidates trend |
| Target 1 | 19,650 | Upper channel band, measured move |
| Target 2 | 19,950 | Extension, prior swing high region |
| R:R | 2.5 : 1 | To Target 1 from mid-entry |
Risk is moderate-low given the clean uptrend structure. The main factor elevating it above minimum is the bank holiday weekend gap risk. Thin liquidity on Tuesday open can produce sharp moves in either direction before settling. Do not be the person holding maximum size into a three-day gap. The trend remains bullish, but gap management is the discipline here.
If you have been in longs since mid-week, consider booking a portion into the Friday close rather than holding full size over the holiday. Fresher longs want to wait for Tuesday’s open to confirm the gap holds before adding. The setups that pay are the ones where you are not sweating over a gap you cannot control. Let the market show you its hand on Tuesday morning, then size accordingly. Trend remains your friend here.
Saturday 23 May 2026
Nasdaq 100 (NAS100) — Weekend Daily Read
Framework Bias
LONG BIAS
Regime: Neutral
The Nasdaq 100 finished the week on a positive note, adding 0.42% on Friday to close at 29,481. The broad tape is in a neutral regime but the bias sits just above the fence toward the buy side. Tech held up well relative to the broader market, with the XLK sector ETF finishing up 1.0% on the day. That kind of sector leadership tells you where the institutional money is willing to lean when risk appetite is present.
VIX at 16.70 is well off its recent elevated levels. The five-day average sits at 18.45, meaning the market has calmed materially into the long weekend. A calm VIX into a holiday closure is generally supportive of a steady open on Tuesday, but it also means there is less buffer if a negative headline arrives Monday while US traders cannot respond.
The week ahead brings the Memorial Day gap open on Tuesday. Historically, post-holiday opens can see exaggerated moves in the first 30 minutes as liquidity returns. The framework leans long but position sizing should reflect the two-day gap in trading.
Key Levels
| Level Type | Price | Note |
|---|---|---|
| Major Resistance | 29,800 | Round number and recent intraday high cluster |
| Near Resistance | 29,663 | Friday’s session high — first target on any gap up |
| Current Price | 29,481 | Friday close |
| Near Support | 29,357 | Thursday close and previous day structure |
| Key Support | 29,000 | Psychological level and prior consolidation zone |
| Major Support | 28,600 | Multi-week demand zone |
Trade Framework
| Scenario | Entry Zone | Stop | Target | R:R |
|---|---|---|---|---|
| Long on Tuesday dip | 29,380 to 29,420 | 29,280 | 29,700 | approx 2.8:1 |
| Long on break above Friday high | 29,680 break and hold | 29,550 | 29,950 | approx 2.1:1 |
| Short if support fails | 29,000 break and hold below | 29,120 | 28,650 | approx 2.9:1 |
Confidence level: around 62%. The long bias is real but the holiday gap and neutral regime temper conviction. A clean test of the 29,380-29,420 zone on Tuesday morning with VIX still subdued would raise confidence to around 70%.
Weekend Context
Tech has been the engine of this rally. NVDA, MSFT, AAPL and META all finished the week constructively. The AI spending cycle remains the structural tailwind that keeps institutional money flowing into the index heavyweights. Any positive AI-related news over the weekend could juice the open on Tuesday.
On the risk side, the US credit rating situation and tariff policy remain the key macro overhang. If either sees a negative development over the long weekend, the gap down on Tuesday could be sharp. Keep your stop where you would not argue with it on Tuesday morning before the first coffee.
The 10-year yield closed at 4.558%, down 2.8 basis points on the day. That is incrementally supportive for rate-sensitive growth names. The dollar index at 99.32 remains soft relative to its recent range, which also tilts the environment toward risk-on positioning.
Friday 22 May 2026
Daily Ticker Read • Friday 22 May 2026
NAS100: Holding Ground Despite NVDA Drag
Members preview — public access 23 May 2026
What the Framework Is Saying
The NAS100 closed Thursday at roughly 21,200, a whisker higher on the day. The headline number flatters the session slightly. NVDA came under pressure after its earnings-related positioning unwound, but AAPL and AMZN stepped up and absorbed most of the selling. The result is a market that wants to move higher but is doing it carefully.
The overall read is cautiously bullish. Price has held above its recent consolidation midpoint, the dip buyers are still active, and breadth on the Nasdaq was reasonable rather than exceptional. This is a market grinding rather than surging, which is actually a reasonably healthy sign. Markets that grind tend to hold their gains better than those that spike.
The concern is concentration. When one name like NVDA wobbles, the index feels it because the weighting is so top-heavy. Any sustained rotation out of mega-cap tech into small or mid-cap names would slow this index down even if the broader market continues higher.
Key Levels for Friday
| Level | Price | Significance |
|---|---|---|
| Support 1 (immediate) | 21,050 | Intraday dip-buy zone |
| Support 2 (structural) | 20,850 | Prior range top, now floor |
| Resistance 1 | 21,400 | Immediate ceiling |
| Resistance 2 | 21,650 | Swing high from April |
| Long entry | 21,060 area | On pullback to S1 |
| Stop | 20,920 | Below structural floor |
| Target | 21,380 | Into R1, partial exit |
What Changed Since Yesterday
Thursday’s session shifted the internal composition of the rally. NVDA, which has been the locomotive for much of the Nasdaq’s move this year, gave ground after a positioning washout. This matters because it tells you the easy money from the AI narrative trade has largely been extracted at current levels.
What replaced it was broader participation from consumer tech. AAPL and AMZN holding up shows the market is not collapsing, just rotating. This is healthier than it looks on the headline number, but it also means the index has less thrust. You need the whole team playing well to get a meaningful break above 21,400.
Friday Scenarios
Bull — 40%
NVDA stabilises, buying returns across mega-cap. Index pushes toward 21,400 and tests resistance. Friday option expiry could accelerate a move if gamma flips positive above 21,200.
Sideways — 40%
Range-bound between 21,050 and 21,350. NVDA overhang keeps buyers cautious. Pre-weekend positioning dominates. Typical Friday chop before a macro data week.
Bear — 20%
NVDA resumes selling, drags broader tech. Loss of 21,050 opens a move to 20,850. Risk-off into the weekend amplifies the move.
Position Sizing
The setup is reasonable but not exceptional. NVDA uncertainty and Friday expiry dynamics both cut the conviction slightly. Trade your normal size, take partial profits at R1, and do not let a winner become a loser into the close.
Related Reading
- Thursday Post-Close: SP500 and NAS100 divergence analysis
- Wednesday Macro Brief: mega-cap earnings cycle positioning
- Alpha Insight: NVDA options structure and dealer hedging flow
This analysis is for educational and informational purposes only. It does not constitute financial advice or a recommendation to buy or sell any instrument. Markets can move against any position. Always manage your risk, use appropriate position sizing for your account, and consult a qualified financial adviser if you are unsure whether trading is suitable for you. Past read accuracy does not guarantee future results. Capital is at risk.
Sunday 17 May 2026
—
title: “NAS100 Weekly Review : 16 May 2026”
subtitle: “NAS100 | Nasdaq | Weekly Timeframe”
date: “2026-05-16”
instrument: “NAS100”
—
Weekend Ticker Review | 16 May 2026
NAS100 : The Index That Fell While the Biggest Name in It Got Bought
NAS100 | Nasdaq Exchange | 12-16 May 2026
1. Week at a Glance
| Friday Close | 29,125 |
| Friday Move | -1.54% |
| Session Driver | Hot retail sales : 10Y broke 4.50% |
| Dark Pool (NVDA) | $2.96B : 24.9% of $11.88B total |
| Options Skew | 4:1 call : $542M calls vs $131M puts |
| VIX Close | 18.43 (intraday peak 19.22) |
| Support | 28,800 |
| Resistance | 29,500 |
| Signal | Neutral-cautious index / NVDA STANDARD long (Monday gate) |
2. What Happened
NAS100 fell 1.54% on Friday. One data point started it. US retail sales came in hot. The bond market immediately removed rate-cut expectations from its pricing. The 10-year yield crossed 4.50% for the first time since June 2025. That one threshold is the reason the index is sitting at 29,125 rather than 29,600.
The index fell. The biggest name inside it was being bought aggressively. Institutions put $2.96B through dark pools in NVDA alone during the session. They did it while the index was down 1.54%. That’s not passive rebalancing. That’s a conviction bet placed during a fear window.
VIX spiked to 19.22. Retail bought puts. Institutions sold the vol and accumulated equities. By close, VIX was back to 18.43. The Swiss franc didn’t rally as a safe haven. That’s the tell. When institutions are genuinely worried, CHF goes. It didn’t. Friday was an orderly repricing, not a panic.
But the vol floor has moved. The five-day VIX average is now 18.34 versus the prior range of 16-17. That’s not a spike : it’s a regime shift. Wider daily ranges are now the baseline. Every stop you set this week needs to reflect that.
3. What the Alpha Insights Said
Institutional Flow : Post 07
NVDA saw 86,534 options contracts in a single session. That is 2.8 times the 30-day average. The 880 and 900 strike calls are concentrated in the 23-30 May expiry window. That timing is not random. NVDA reports late May. This is a pre-earnings institutional structure, not a tactical day trade.
Options Watch : Post 08
QQQ and NDX are both below their max pain levels. QQQ max pain is 490, NDX is 19,500. Current prices sit below both. Dealer positioning creates a mechanical upward pull toward those levels into expiry. QQQ GEX is near zero : no dealer brake means any move accelerates without resistance from options hedging.
Sector Flow : Post 09
Technology is rated AVOID as an ETF. XLK is the wrong vehicle because it blends two opposing signals: NVDA accumulation and broad Nasdaq distribution. The rate multiple headwind crushes long-duration growth names. The AI earnings cycle operates independently. These are not the same trade. Use NVDA directly.
Signals : Post 15
NVDA is Signal 3 with six confirming layers and a Monday open gate at $870. The index as a whole rates as Signal 5 : neutral range trade only. The SPX and NDX range (7,350-7,500 / 28,800-29,500) holds mechanically through Wednesday via GEX support. No directional conviction in the index before FOMC minutes.
Overwatch : Post 18
NVDA’s divergence from Nasdaq is listed as an active unresolved contradiction. Stakes: $2.96B in dark pool positions plus near-dated call premium. Resolution event: NVDA earnings late May. Between now and then, Monday’s open is the first gate. If NVDA opens below $870, the entire pre-earnings thesis requires reassessment.
4. Key Levels
| Level | Price | Significance |
|---|---|---|
| Support | 28,800 | Institutional accumulation floor |
| Resistance | 29,500 | First meaningful level above Friday close |
| NDX Max Pain | 19,500 | Mechanical upward pull from dealer positioning |
| NVDA Entry Gate | $870 | Monday open must hold : entry zone $850-870 |
| NVDA Stop | $840 | Clean break below on volume : thesis invalid |
| NVDA Target | $920 | Pre-earnings institutional target (R:R ~2.5:1) |
5. Signal + Bias
Index direction: Neutral. No clean edge before Wednesday. The rates-versus-equities contradiction is live and unresolved.
NVDA direction: Standard long : but only after Monday confirmation. Entry $850-870. Stop $840. Target $920. Gate: NVDA must open above $870. If it doesn’t, no trade.
Sizing rule: 30-40% below normal. VIX at 18.43 is a regime shift. Stops need to be 1.5x wider than your baseline to avoid being clipped by expanded intraday ranges.
What kills the thesis: 10-year above 4.65%, or NVDA below $840 on volume. Either one changes the picture.
6. Next Week Setup
Monday morning is the first test. Watch NVDA pre-market before anything else. If it holds $870, the institutional accumulation thesis is intact. If it opens below $840, the dark pool bet is wrong and you don’t chase it.
Wednesday is the key session. EIA crude supply data at 10:30 ET, then FOMC minutes at 14:00 ET. No new entries from 12:00-13:45. Let the minutes land. The market will define direction in the first 30 minutes after the release. That’s when you act, not before.
The consumer earnings cluster (Target, Lowe’s, TJX all on Wednesday) runs alongside the FOMC minutes. If guidance is cautious and the Fed sounds hawkish, the $542M in equity calls faces a difficult close. If consumer holds and Fed sounds like a hold-not-hike, the institutional call skew starts to pay.
NVDA earnings late May is the resolution event for the entire thesis. If AI demand validates 14-16% EPS growth at the index level, 21x forward P/E at 4.50% rates becomes defensible. That’s a big ask. But $2.96B in dark pool accumulation says someone thinks it pays off.
7. Risk Score
Around 60%
Elevated VIX floor plus a live, unresolved bond-versus-equity contradiction. The index needs NVDA to deliver to justify Friday’s institutional bet. If late-May earnings disappoint, $2.96B of dark pool and $62M in near-dated premium face rapid reversal. That asymmetric downside is the reason this sits at 60% and not lower.
Saturday 16 May 2026
—
title: “NAS100 Weekly Review : 16 May 2026”
subtitle: “NAS100 | Nasdaq | Weekly Timeframe”
date: “2026-05-16”
instrument: “NAS100”
—
Weekend Ticker Review | 16 May 2026
NAS100 : The Index That Fell While the Biggest Name in It Got Bought
NAS100 | Nasdaq Exchange | 12-16 May 2026
1. Week at a Glance
| Friday Close | 29,125 |
| Friday Move | -1.54% |
| Session Driver | Hot retail sales : 10Y broke 4.50% |
| Dark Pool (NVDA) | $2.96B : 24.9% of $11.88B total |
| Options Skew | 4:1 call : $542M calls vs $131M puts |
| VIX Close | 18.43 (intraday peak 19.22) |
| Support | 28,800 |
| Resistance | 29,500 |
| Signal | Neutral-cautious index / NVDA STANDARD long (Monday gate) |
2. What Happened
NAS100 fell 1.54% on Friday. One data point started it. US retail sales came in hot. The bond market immediately removed rate-cut expectations from its pricing. The 10-year yield crossed 4.50% for the first time since June 2025. That one threshold is the reason the index is sitting at 29,125 rather than 29,600.
The index fell. The biggest name inside it was being bought aggressively. Institutions put $2.96B through dark pools in NVDA alone during the session. They did it while the index was down 1.54%. That’s not passive rebalancing. That’s a conviction bet placed during a fear window.
VIX spiked to 19.22. Retail bought puts. Institutions sold the vol and accumulated equities. By close, VIX was back to 18.43. The Swiss franc didn’t rally as a safe haven. That’s the tell. When institutions are genuinely worried, CHF goes. It didn’t. Friday was an orderly repricing, not a panic.
But the vol floor has moved. The five-day VIX average is now 18.34 versus the prior range of 16-17. That’s not a spike : it’s a regime shift. Wider daily ranges are now the baseline. Every stop you set this week needs to reflect that.
3. What the Alpha Insights Said
Institutional Flow : Post 07
NVDA saw 86,534 options contracts in a single session. That is 2.8 times the 30-day average. The 880 and 900 strike calls are concentrated in the 23-30 May expiry window. That timing is not random. NVDA reports late May. This is a pre-earnings institutional structure, not a tactical day trade.
Options Watch : Post 08
QQQ and NDX are both below their max pain levels. QQQ max pain is 490, NDX is 19,500. Current prices sit below both. Dealer positioning creates a mechanical upward pull toward those levels into expiry. QQQ GEX is near zero : no dealer brake means any move accelerates without resistance from options hedging.
Sector Flow : Post 09
Technology is rated AVOID as an ETF. XLK is the wrong vehicle because it blends two opposing signals: NVDA accumulation and broad Nasdaq distribution. The rate multiple headwind crushes long-duration growth names. The AI earnings cycle operates independently. These are not the same trade. Use NVDA directly.
Signals : Post 15
NVDA is Signal 3 with six confirming layers and a Monday open gate at $870. The index as a whole rates as Signal 5 : neutral range trade only. The SPX and NDX range (7,350-7,500 / 28,800-29,500) holds mechanically through Wednesday via GEX support. No directional conviction in the index before FOMC minutes.
Overwatch : Post 18
NVDA’s divergence from Nasdaq is listed as an active unresolved contradiction. Stakes: $2.96B in dark pool positions plus near-dated call premium. Resolution event: NVDA earnings late May. Between now and then, Monday’s open is the first gate. If NVDA opens below $870, the entire pre-earnings thesis requires reassessment.
4. Key Levels
| Level | Price | Significance |
|---|---|---|
| Support | 28,800 | Institutional accumulation floor |
| Resistance | 29,500 | First meaningful level above Friday close |
| NDX Max Pain | 19,500 | Mechanical upward pull from dealer positioning |
| NVDA Entry Gate | $870 | Monday open must hold : entry zone $850-870 |
| NVDA Stop | $840 | Clean break below on volume : thesis invalid |
| NVDA Target | $920 | Pre-earnings institutional target (R:R ~2.5:1) |
5. Signal + Bias
Index direction: Neutral. No clean edge before Wednesday. The rates-versus-equities contradiction is live and unresolved.
NVDA direction: Standard long : but only after Monday confirmation. Entry $850-870. Stop $840. Target $920. Gate: NVDA must open above $870. If it doesn’t, no trade.
Sizing rule: 30-40% below normal. VIX at 18.43 is a regime shift. Stops need to be 1.5x wider than your baseline to avoid being clipped by expanded intraday ranges.
What kills the thesis: 10-year above 4.65%, or NVDA below $840 on volume. Either one changes the picture.
6. Next Week Setup
Monday morning is the first test. Watch NVDA pre-market before anything else. If it holds $870, the institutional accumulation thesis is intact. If it opens below $840, the dark pool bet is wrong and you don’t chase it.
Wednesday is the key session. EIA crude supply data at 10:30 ET, then FOMC minutes at 14:00 ET. No new entries from 12:00-13:45. Let the minutes land. The market will define direction in the first 30 minutes after the release. That’s when you act, not before.
The consumer earnings cluster (Target, Lowe’s, TJX all on Wednesday) runs alongside the FOMC minutes. If guidance is cautious and the Fed sounds hawkish, the $542M in equity calls faces a difficult close. If consumer holds and Fed sounds like a hold-not-hike, the institutional call skew starts to pay.
NVDA earnings late May is the resolution event for the entire thesis. If AI demand validates 14-16% EPS growth at the index level, 21x forward P/E at 4.50% rates becomes defensible. That’s a big ask. But $2.96B in dark pool accumulation says someone thinks it pays off.
7. Risk Score
Around 60%
Elevated VIX floor plus a live, unresolved bond-versus-equity contradiction. The index needs NVDA to deliver to justify Friday’s institutional bet. If late-May earnings disappoint, $2.96B of dark pool and $62M in near-dated premium face rapid reversal. That asymmetric downside is the reason this sits at 60% and not lower.
Friday 15 May 2026
NAS100 (US Tech 100) — Daily Read | Friday 15 May 2026
Post-CPI close | QQQ leads, rate-cut repricing not finished | Not financial advice
WHAT CHANGED FROM YESTERDAY
Yesterday the long running setup had QQQ at $720.80 mid-session, tech leading at +0.85% outperformance versus the broad market. The session closed at $719.79 (+0.71%) — slightly off the mid-session high, which means the market gave a small amount back into close. That is normal consolidation after an event-driven spike. What matters is where the close landed: above the prior entry trigger, above the prior T1 target, and with NVDA contributing +4.39% to the complex. The rate-cut repricing that Overwatch described is not a single-day event. Analyst price target revisions take two to six weeks to fully roll through. Friday’s read is about whether Retail Sales at 08:30 adds a second leg or forces a pause before the upgrade cycle continues.
HEADLINE STATE: LONG, REPRICING IN PROGRESS — NVDA Is the Proxy, QQQ Follows
QQQ at $719.79 after CPI confirmation is not the ceiling. The Overwatch synthesis made this explicit: the earnings upgrade cycle that CPI triggered has not been expressed in analyst price targets yet. NVDA at $235.74 is the rate-cut proxy described in Post 02 and Post 16. Every technology company with high earnings duration and AI infrastructure exposure is in line for a discount rate repricing that runs over the next two to six weeks. Friday’s data gate either accelerates or pauses that repricing. It does not reverse it unless Retail Sales is materially weak.
Key Levels
| Level | Price | Significance |
|---|---|---|
| Thursday close | QQQ $719.79 | +0.71% — tech led, held the gain, CPI confirmed |
| Strong RS upside | QQQ $724–$728 | Strong data confirms second leg — repricing accelerates |
| In-line range | QQQ $716–$722 | Consolidation continues — thesis intact, pace moderates |
| Weak RS support | QQQ $711–$714 | Demand concern opens — but discount rate repricing still pending |
| NVDA tripwire | Below $232 | Rate-cut proxy signal fails per Overwatch tripwire map |
| Prior entry trigger | $29,215 (NAS100) | Now support — the cleared level holds the recent bid |
Structure · Momentum · Flow
Structure
Rising, confirmed. Prior trigger levels now act as support. The CPI catalyst gave the uptrend a fundamental reason to continue. Structure is clean across all timeframes going into Friday.
Momentum
QQQ gave back a small amount from mid-session high to close. That is healthy consolidation after an event spike, not distribution. Momentum remains positive but not stretched. No exhaustion signals at Thursday’s close.
Flow
Institutional money in tech on CPI day was deliberate: lower discount rate = higher present value of future earnings. NVDA’s 5x outperformance vs SPY is the proof. Flow remains directionally long into Retail Sales.
| Bias | LONG — Retail Sales confirms or pauses |
| Risk estimate | Around 25% — data binary on an expiry day |
| Key watch | NVDA $232 — holds above = repricing continues |
| Avoid zone | 13:00–14:00 NY (expiry friction) |
| Week carry | Bullish — discount rate repricing 2–6 weeks ahead |
This content is for educational and informational purposes only and does not constitute financial advice. Past analysis does not guarantee future results. Always conduct your own research before making any trading decisions.
Thursday 14 May 2026
NAS100 (US Tech 100) — Daily Read | Thursday 14 May 2026
Post-CPI mid-session | Tech leading the charge | Not financial advice
WHAT CHANGED FROM YESTERDAY
Yesterday the read was LONG at 100% conviction with price at $29,064 — waiting on the $29,215 entry trigger. The entry trigger was a clean break above the prior session high. CPI printed lower this morning, the market gapped into that trigger, and tech took the lead. QQQ is now at $720.80 (+0.85%) — outperforming the broad market. This is the tech leadership pattern the analysis was anticipating. The coil from Wednesday has resolved bullishly and with conviction.
HEADLINE STATE: LONG RUNNING — Tech Leading, NVDA up 3.9%
Tech is leading this rally and that matters. When NAS100 outperforms SPX on a CPI day, it means the market believes lower inflation is better for growth stocks — discounting future earnings at a lower rate. NVDA up 3.9% at mid-session is the headline number. When the index’s most influential component moves like that, the whole complex follows. QQQ at +0.85% is the clean signal that institutional money is rotating into growth, not just safety. This was the expected outcome from the pre-CPI long setup.
Key Levels
| Level | Price | Significance |
|---|---|---|
| QQQ mid-session | $720.80 | +0.85% — leading the market |
| Prior entry trigger | $29,215 | Cleared on open — confirmed long |
| Prior T1 | ~$29,450 | Channel midline — should be in or past this |
| Prior stop | $29,000 | Channel floor — never tested today |
| CPI low (Wed) | $28,629 | The panic low — that level is now protected |
| NVDA contribution | +3.9% | Index heavyweight driving the complex |
Structure · Momentum · Flow
Structure
The rising channel that was identified yesterday is intact and extended. Price broke above the trigger level and is holding above it. Structure confirmed the long at the right time.
Momentum
Tech leading the market on a CPI day is momentum at its most useful. When the best-performing sector on the biggest event day is the sector you are positioned in, that is alignment. Momentum is positive and orderly.
Flow
NVDA at +3.9% mid-session is institutional money, not retail. That size of move in the index’s biggest name on CPI day is a deliberate position. Flow is long and concentrated in growth.
TODAY’S BIAS: LONG — Tech Leadership Confirmed
The setup played out. The long was pre-positioned, CPI was the catalyst, and tech led. If you are in profit, the job now is trade management: trail your stop, protect the gain, let the runner run. If you are looking at this fresh, the next entry is on a pullback to the prior trigger zone — not at current prices. AAPL lagging (-0.15%) is the one anomaly. Not everything needs to move together, but watch whether Apple starts dragging the complex.
Risk: Around 35%
The move is confirmed but you are buying a CPI gap. If you were not positioned yesterday, chasing today at +0.85% compresses your risk/reward significantly. The risk here is entry timing, not direction. Direction remains clean.
By Experience Level
New to this
Note that the analysis had the long read before CPI. The news confirmed what the positioning already implied. This is why you build your read the day before — not on the morning of the event. Log this pattern.
Developing
AAPL flat while NVDA and QQQ rally is a rotation signal worth watching. The market is not buying the whole tech complex equally. Growth and AI names are preferred. If you hold AAPL longs, check that thesis against where the money is actually moving.
Experienced
Watch whether the QQQ/SPY ratio holds its bid into the close. If NAS100 starts giving back relative gains to the broad market in the final two hours, that is the first sign momentum is fading. P/C at 0.531 suggests no one is hedging — that makes the reversal, if it comes, sharp and fast.
This is a daily analysis read for educational and informational purposes only. Nothing here is financial advice. Past performance is not a guide to future results. Trading carries significant risk of loss. Always apply your own risk management.
Wednesday 13 May 2026
NAS100 (US Tech 100) — Daily Framework Read | Wednesday 13 May 2026
analysis as of pre-market | CPI 3.8% shock context | Not financial advice
HEADLINE STATE: LONG — 100% Conviction / Structure Mixed
Every timeframe aligns to the long side, but price is pressing inside a tight rising channel with mixed structural signals. The framework is fully committed directionally — the caution is about when to act, not which way to lean. CPI at 3.8% injected overnight volatility; tech absorbed the shock and held its footing. Price closed at $29,064. The setup builds toward $29,215 as the entry trigger.
Key Levels
| Level | Price | Significance |
|---|---|---|
| Entry trigger | $29,215 | Above current price — confirms strength |
| Current close | $29,065 | the framework reference price (NDX) |
| Stop loss | $29,000 | Below channel floor — invalidates setup |
| T1 — Channel midline | ~$29,450 | First profit target, partial exit |
| Session high | $29,188 | Resistance to watch intraday |
| Session low | $28,629 | CPI panic low — should not revisit |
Structure · Momentum · Flow
Structure
Rising channel intact but compressed. Price is coiling near the upper third. Mixed across shorter timeframes — not yet a clean breakout, not yet a breakdown. The longer picture is constructive.
Momentum
Long bias is strong. The daily closed down 0.87% post-CPI but that is a healthy pullback inside an uptrend, not a trend break. Recovery above $29,215 confirms buyers absorbed the data.
Flow
VIX at 17.99 — falling from the CPI spike high of 19.1. Declining fear with tech holding is bullish flow. Institutional positioning consistent with risk-on regime. Volume came in heavy on the dip.
Long Case vs Short Case
LONG CASE
- 100% conviction read — all timeframes aligned long
- CPI shock absorbed, price held above $28,629
- VIX declining into session — fear fading
- Entry above $29,215 confirms buyers back in control
- Risk-on regime confirmed in the framework
SHORT CASE
- CPI 3.8% above expectations — rate cut timeline extends
- Tight channel = low room for error on entry timing
- Mixed shorter-timeframe structure
- Failure below $29,000 reopens $28,629 gap
- Not the setup for counter-trend shorts today
Sizing Guidance
Risk per trade: standard allocation only. The channel is tight — $215 of space between current price and entry, then $215 to the stop. That is a 1:1 risk-to-entry, roughly 2:1 risk-reward to T1. Do not size up in compression — wait for the breakout to confirm before adding. One unit in, scale at midline.
Entry only triggers on a move through $29,215. No anticipatory entries below that level.
Tuesday 12 May 2026
Daily Framework Read · Tuesday 12 May 2026
Nasdaq 100 (NAS100) — Daily Framework Read | Tuesday 12 May 2026
Published pre-market · Time-gated member content
Current State
LONG — 60% Confidence
Directional bias: 95% long. Structure is fighting near-term resistance, but the bigger picture is firmly behind buyers.
Key Levels
| Level | Price | Notes |
|---|---|---|
| Entry | 29,215 | Structural long trigger |
| Stop Loss | 28,996 | Below key support floor |
| Target 1 | 29,654 | First structural resistance |
| Risk:Reward | 2R | Reward doubles the risk |
Structure Read
The structural picture on the larger timeframes is clearly bullish — the sequence of higher lows and higher highs remains intact. Near-term price is pressing against a resistance zone that has caused hesitation, but that friction is normal inside a broader uptrend. The bigger picture has been accumulating support for several sessions and the architecture of the move looks healthy.
Momentum Read
Momentum is doing what you’d expect near a resistance test — it’s tightening and showing some pushback from the bears. But across all the meaningful timeframes the directional lean stays bullish. Buyers have consistently absorbed selling pressure rather than yielding ground, which keeps the momentum case alive.
Volume & Flow Read
Flow is confirming the long bias. There is no meaningful divergence between price action and underlying participation — volume is not warning of a reversal. Buyers are stepping in at the pullbacks rather than stepping aside, which is a constructive sign for continuation.
The Verdict
Every layer of the framework is aligned in the same direction — structure, momentum, and flow all pointing up at the macro level. Near-term there’s some friction as price tests resistance, but that’s not a reason to step aside when everything else is behind the trade. When everything was lined up like this historically, it’s fired well. The honest caveat is the 60% confidence — this isn’t a screaming setup, it’s a solid one. Size it accordingly and give it room to breathe through the resistance test.
Long Case vs Short Case
95%
All macro layers aligned long. Structural sequence intact. Buyers absorbing resistance tests.
5%
Near-term resistance friction only. No structural reversal signal present.
Position Sizing Guidance
At 60% confidence, this is a standard-risk setup — not a full-size position. Risk 1% of your account on the trade at the levels shown. The 2R target at 29,654 means you’d risk 219 points to make 439. Reduce size further if the broader session opens with heavy volatility or gaps outside the key levels. Do not chase entries above the 29,215 zone.
This content is for educational and informational purposes only. Nothing here constitutes financial advice or a recommendation to buy or sell any instrument. Trading involves substantial risk of loss. Past performance is not indicative of future results. Always conduct your own due diligence and manage risk appropriately.
Tuesday 5 May 2026
NAS100 (US 100) — Daily Framework Read | Tuesday 5 May 2026
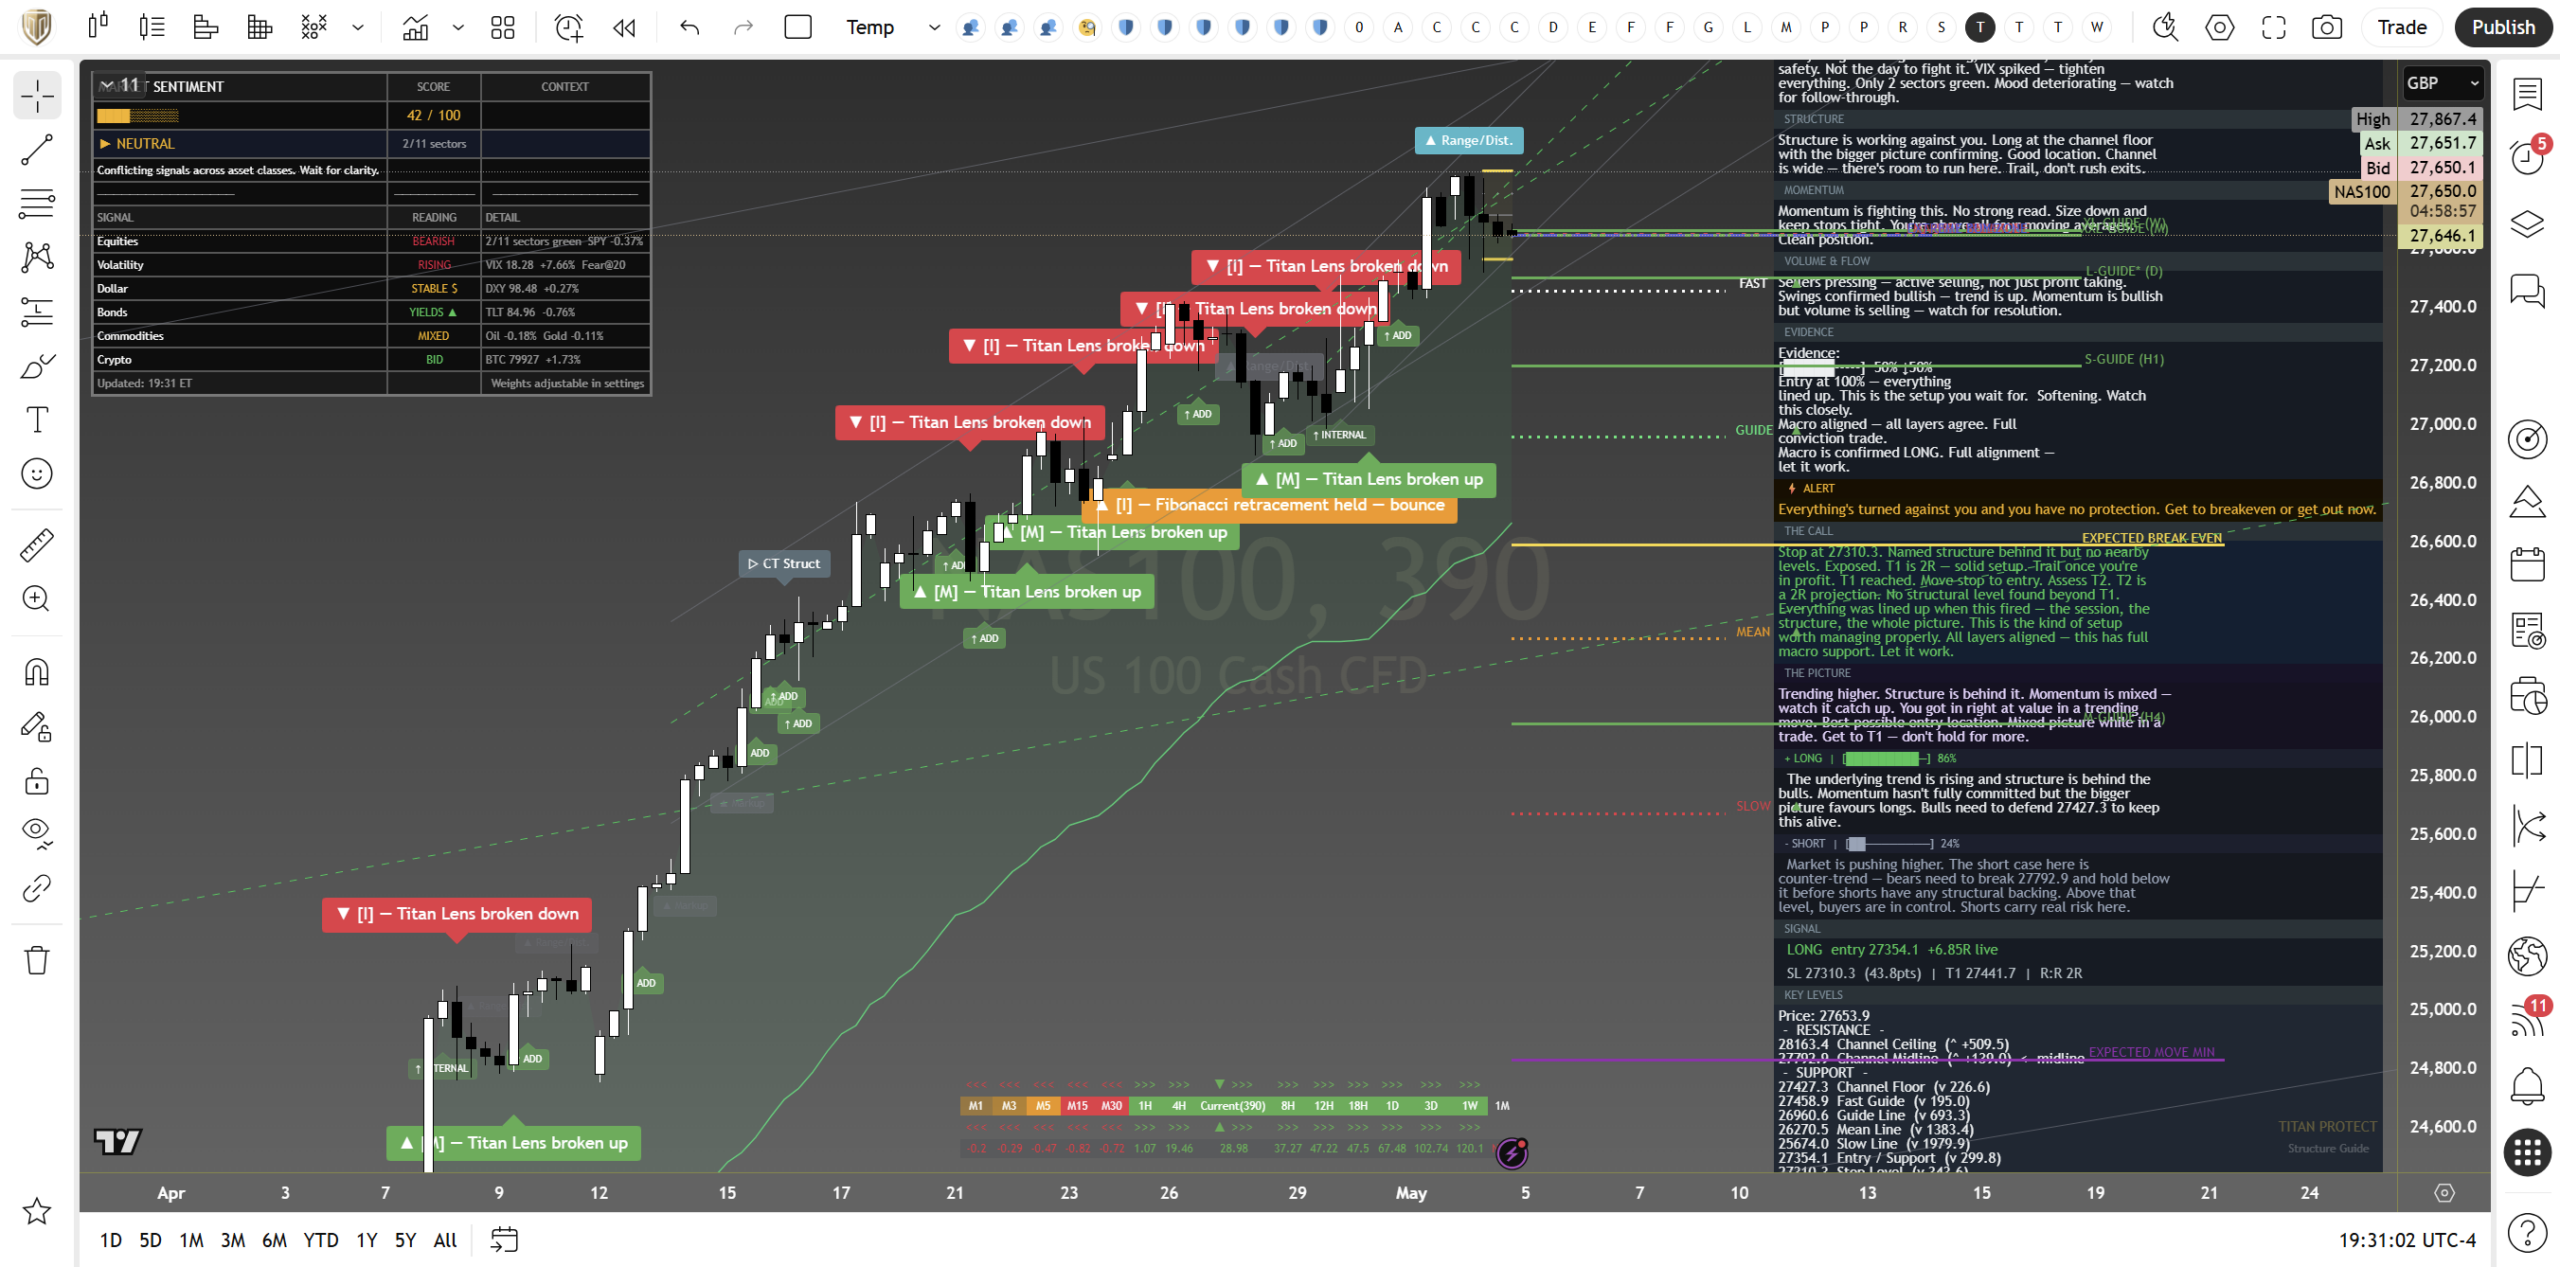
Nasdaq 100 Cash CFD | Daily Framework Read | Tuesday 5 May 2026
The Read
The framework’s headline read has been neutral for two sessions, and that matters. Yesterday it was neutral with the trend pulling into fresh local highs. Today it is neutral with the trend confirmed but participation thinning. That is a quieter warning. The structure is not broken. The conviction behind the next leg is.
Look at the wider tape and the picture sharpens. Every major US benchmark closed lower on Monday. The Dow lost 1.13%, the Russell gave 0.60%, and the SPY at 718.01 ground 0.37% lower. The Nasdaq held up better in relative terms, which is what you expect when a market rotates defensively into names that have already worked. Concentration leadership is the late stage of a trend, not the strong middle.
The volatility complex is the cleanest tell. VIX9D climbed 2.45 points to 16.60 while VIX3M only added 0.68. The front of the curve is steepening towards spot. That is the shape you see when traders pay up for short-dated protection because they expect a near-term shock. VVIX above 98 means even the cost of hedging the hedge is rising. Professional accounts do not pay that premium when they are confident.
The Setup
Structurally the index is still in markup. The framework flags the recent breakouts as confirmed and the mid-April accumulation base held on every test. The leg from 25,800 to 27,500 is the leg you wanted to be long. The question now is whether this is a pause before another extension or the rounding top that asset-class rotation is whispering about underneath.
Two things would resolve it cleanly.
The middle path is most likely today. Range between 27,300 and 27,580, framework neutral until one edge gives. Uncomfortable for trend followers, ideal for disciplined intraday operators who can fade extremes with hard stops.
Levels
| Level | Type | Significance | Action Zone |
|---|---|---|---|
| 27,800 | Upside extension | Round-number magnet on a constructive resolution | Take profits on longs |
| 27,600 | Resistance | Recent supply pocket; reclaim shifts read constructive | Fade or scale longs above |
| 27,481 | Reference | Current cash anchor | Directional bias line |
| 27,400 | Range anchor | Session pivot; framework’s neutral midline | Hold above is constructive |
| 27,200 | Support shelf | Prior breakout retest, accumulation pocket | Tactical long with defined stop |
| 26,850 | Major support | Options-gamma cliff equivalent for QQQ 650 | Loss = defensive read |
| 26,500 | Structural floor | Mid-April base; full retracement of recent leg | Last line before trend break |
Scenarios
Bull Case
The index reclaims 27,600 on session breadth and VIX cools back through 17. Asset-class rotation turns out to be a one-day rebalancing flush rather than a regime shift. NAS100 extends to 27,800 by mid-week with 28,000 attainable into the back half of the week. Risk-on tilt resumes.
Range Case
27,300 to 27,580 holds as the operating box. VIX stays sticky around 18 and VVIX refuses to settle. The framework remains neutral and rewards patience. This is the highest-probability path given the volatility profile and the breadth softness underneath.
Defensive Case
27,200 fails on a closing basis with VIX through 19.50 and the Dow leading lower again. The recent leg gives back to 26,850 first, with 26,500 the structural target. Concentration leadership unwinds. The framework would shift to defensive and short-term hedges become the trade.
The Verdict
Risk is at Around 60% today.
Three factors set that level. First, the volatility complex is no longer aligned with the trend. A 7.65% jump in VIX with VVIX through 98 tells you professional money is paying for protection while the index drifts. Second, the breadth picture across SPY, Russell, and Dow on Monday was uniformly softer than the Nasdaq alone. That is rotation defensiveness, not broad strength. Third, the framework itself is reading neutral for a second session running, which removes the conviction tailwind a clear directional read would otherwise provide.
The 40% relief from maximum risk reflects that the structural leg is still intact. Markup has not been broken. The 27,200 shelf has not been retested. The macro backdrop has not delivered a fresh shock. None of that means complacency is appropriate. The trade today is range discipline, not directional conviction.
Yesterday vs today: The framework called neutral yesterday with the trend still extending. That call held. Price closed the prior session inside the same range and the structural read survived. Today the read is the same neutral, but the conviction underneath has thinned. We have not changed direction. We have changed urgency. That distinction matters when sizing the next trade.
Trade the level. Respect the read. Walk it like an institution.
This analysis is for educational and informational purposes only. It does not constitute financial advice. Always manage your risk independently and in accordance with your own financial circumstances.
Continue with Titan Protect
Twenty-plus instruments. One framework.
We read more than twenty instruments daily across four sessions. The framework’s sunrise call landed across the day — the Pre-NY case study shows what the lines drew, what New York did, and where the read stands.
Core
£59/mo
Indicator suite plus daily framework reads.
Edge Popular
£109/mo
Core plus Shield dashboard and member-only briefs.
Elite
£179/mo
Edge plus weekly 1:1 call and early access to new tools.
Save 15% on annual billing
Want to see the framework in action? Free Explorer tier — no card required.
Join the live community: Discord channel · Shield dashboard
Education, not financial advice. Trade your own analysis.
Sunday 3 May 2026
Nasdaq 100 — Daily Framework Read | Sunday 3 May 2026
Nasdaq 100 | Monday Open Framework Read | Data basis: Friday 1 May 2026 close
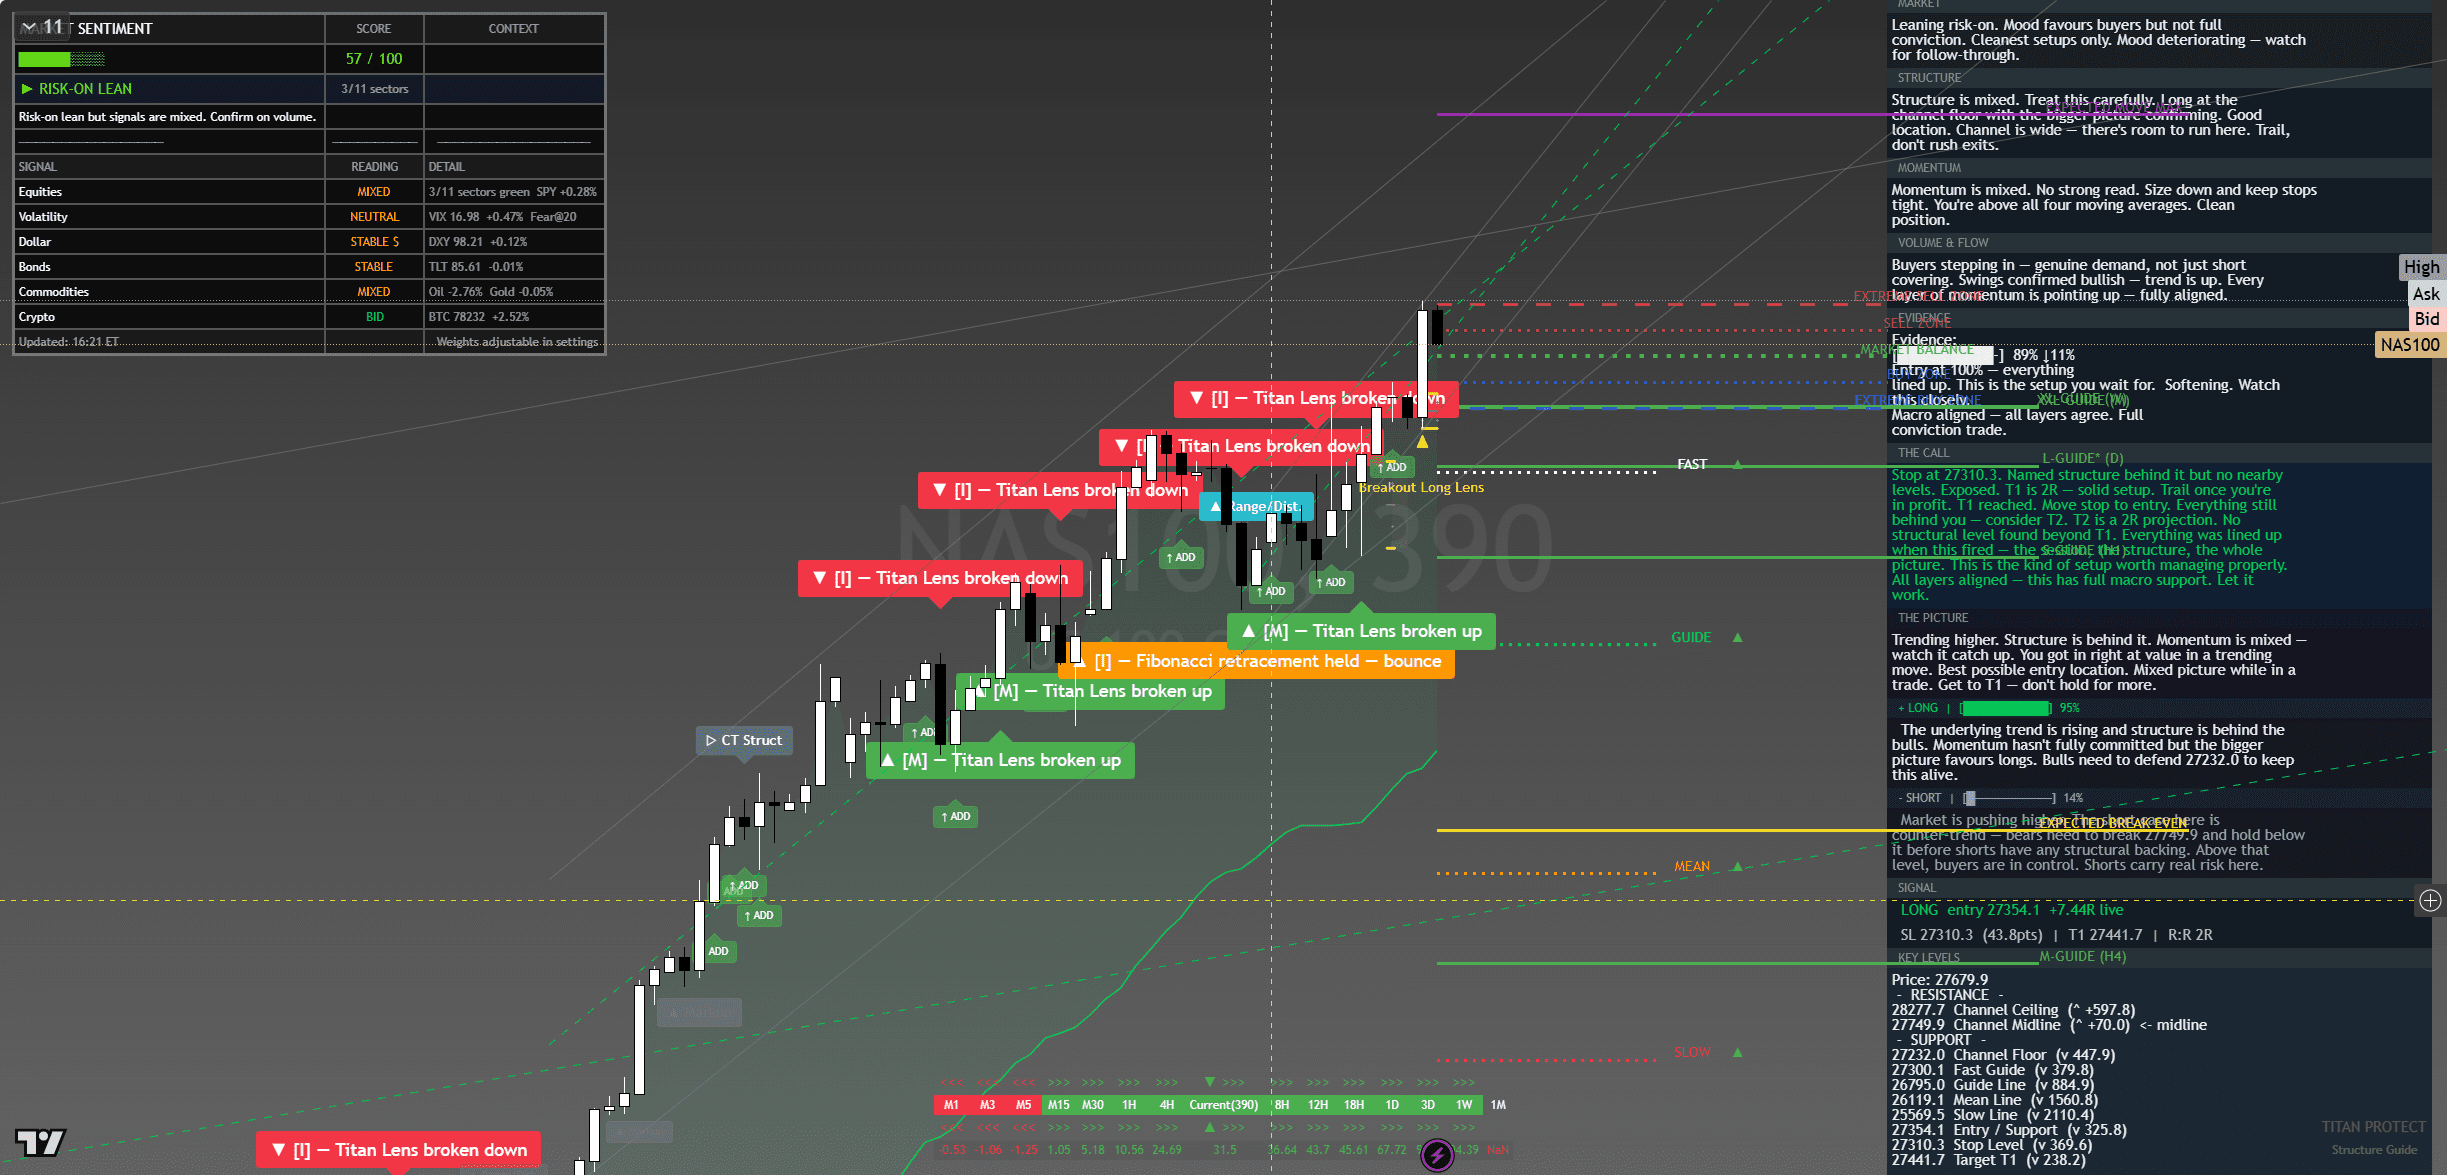
Nasdaq 100 — chart with framework overlay. The Lens annotations show structural breaks, reversal triggers and confluence zones at the levels referenced below.
Where It Sits
Structure
Structurally the index sits above all its short-term moving averages, with the daily trend firmly higher and the 4-hour timeframe printing higher highs and higher lows since the late-April recovery. The breakout from the 27,400 consolidation has held cleanly and price has not retested the level. That is a healthy structural posture for continuation but it also means the asymmetric trade is no longer entry — it is management of an existing long.
Momentum
Momentum is firm but not extended. Friday’s session printed a new high on respectable volume but did not stretch the range — the kind of orderly advance that tends to carry rather than reverse. The internal momentum readings are constructive without flagging exhaustion. The risk is not that momentum fails on Monday, but that it stalls at 28,000 and the round number triggers profit-taking that creates a high-volume reversal candle.
Volume & Flow
Volume on Friday’s close was solid but not standout, with NVDA, MSFT, AAPL doing the heavy lifting. Breadth is the concern — fewer than half of the index constituents made new highs on Friday despite the headline print. When breadth thins on a record close, the next leg up needs broader participation to hold. Watch for a session where 60 percent or more of names trade green to confirm broader participation re-engaging.
Key Levels
| Level | Type | Significance | Action Zone |
|---|---|---|---|
| 28,000 | Resistance | Round-number target zone, prior congestion ceiling | Take profits / fade if rejected |
| 27,800 | Pivot | Mid-range continuation marker — tech leadership test | Hold = constructive; lose = consolidation |
| 27,710 | Friday close | Reference anchor for Monday open | Above = continuation; below = mean revert |
| 27,400 | Support | 5-day range floor, hedge cluster | Buy zone with defined stop |
| 27,100 | Major support | Prior breakout retest level | Stop-out below for longs |
Three Scenarios Into Monday Open
Continuation
Index gaps open above 27,800 in Asia, holds 27,750 through London, runs the 28,000 round number on the NY open. Tech leads with NVDA, MSFT continuing to drive index weight. Continuation works because nothing interrupts it — light data week, no Fed speakers Monday, no earnings of consequence.
Range
Index opens flat-to-firm, churns 27,600-27,850, magnet pulled to Friday close. Tape needs a fresh catalyst. ISM Services Tuesday becomes the next read. Trade the range, don’t chase.
Mean Reversion
Index opens strong overnight, runs into 27,900 zone and meets supply, fades back below 27,500 by NY open. Failed-breakout tape. Not the base case but worth size discipline if VIX flips above 17.5.
Risk Score
Risk sits at Around 55% heading into Monday open.
Risk reflects the gap between Friday’s record close and the structural concentration of leadership. The continuation read is constructive but tech weight is doing 80 percent of the work — when index strength is that narrow, a single name’s miss can rotate the tape. Vol structure compressed but VVIX 95 says professionals are still paying up for protection. Standard-size longs make sense; oversize does not.
How to Walk It
Entry / Stop / Target structure:
- Long 27,500-27,600 | Stop 27,350 | Target 27,900 | R:R 2:1
- Long 27,800 breakout | Stop 27,650 | Target 28,000 | R:R 1.3:1
- Fade 27,950+ rejection | Stop 28,050 | Target 27,750 | R:R 2:1
Experience-level guidance:
Beginner: The Monday open after a Friday record close is exactly the situation where over-confidence costs money. Reduce size to half your standard. Trade only the cleanest setup from the entries above. If the tape opens against your bias, do nothing — wait for the second hour, when the institutional flow has tipped its hand.
Intermediate: Use the levels table to define the trading range. Fade the extremes with defined stops, take profits before the round-number resistance levels. Do not carry directional positions through the day if you cannot watch the tape — Monday opens are prone to fast reversals.
Advanced: The vol regime is supportive of trending moves. Defined-risk options structures around the key pivot levels capture the asymmetry cleanly. Keep notional small relative to your book — Monday after a record-close week is asymmetric speculation, not core positioning.
The Sunday Composite — How This Read Sits Inside The Cross-Asset View
This single-instrument framework read is one slice of the larger Sunday weekend synthesis. The composite takes positioning, macro, sentiment, volatility, sector dispersion and trade structure as separate analytical layers and arrives at a unified composite verdict for Monday open. Each layer below is unpacked in full.
Read the full composite for the cross-asset context driving this instrument:
The institutional positioning split — Asset Managers vs Leveraged Funds in size
PCE clearance and the macro case for Monday’s carry
The three-layer sentiment disagreement — surface greed, retail neutral, professionals hedged
The vol curve term structure and what VVIX is signalling
Sector dispersion and the breadth problem behind the record close
The Monday position-management playbook — sizing tiers and trade plans
Sunday Overwatch — the unified composite verdict
Continue Reading
The macro frame driving this read is unpacked in the weekend briefs:
Sunday Setup — Reading The Tape Into Monday Open
PCE Cleared, VIX Crushed, SPY Closed 720 — Friday Post-Close Recap
This analysis is for educational and informational purposes only. It does not constitute financial advice. Always manage your risk independently and in accordance with your own financial circumstances.



