
The NAS100 Framework Journal for April 2026, newest read at the top. Each dated entry is our read on the close, kept as a living record so the framework can be judged over time. This is analysis, not financial advice.
Thursday 30 Apr 2026
The Nasdaq 100 sits at 27,179 after Wednesday’s Mag 7 earnings gauntlet left the scoreboard mixed. GOOGL delivered and rallied. META and AMZN beat on numbers and sold off hard anyway. That divergence tells you everything about how this market is positioned: institutional money is using good news to reduce exposure, not add to it. AAPL reports tonight at 21:00 BST and is the last anchor point of the quarter. Futures are holding 27,389 in the pre-market but the range above is contested and the floor below at 27,100 is where the real decision gets made.
NAS100 is in a sell-the-news regime. Three of the four large-cap tech names that matter for this index have printed: two rallied on beats, two sold hard. AAPL carries a different risk profile as a consumer hardware and services story rather than pure AI spend. The market’s reaction to AAPL will set the tone into PCE Friday. Analysis reads current positioning as cautious — the hedge book is freshly reloaded and large blocks of downside protection remain in place. Trade the range today and let AAPL decide whether the next directional leg begins.
“Institutional money is using good news to reduce exposure, not add to it.”
Where It Sits Today
NQ futures closed Wednesday at 27,325 and edged up 64 points overnight to 27,389 — the cash index had settled around 27,179 through the session. The five-day picture is broadly flat: the index recovered most of the tariff-shock sell-off but has found no fresh catalyst to drive it materially above the 27,400 zone.
The cost of hedging volatility itself jumped sharply, meaning professional accounts are paying up to protect against a sudden spike. While spot VIX has cooled from 19 to 18.14, that is not what a clean bull flag looks like.
Wednesday’s session pattern was instructive. GOOGL +5% after hours translated into an overnight NQ bid that faded through the European session. META -7% and AMZN -6% created the opposing drag. The net result was an index that churned. Breadth was mixed with technology the relative leader, but QQQ underperformed the sector ETF — that weight differential matters for index direction.
What the Framework Reads
The composite picture heading into Thursday’s US session is one of contested territory. The macro structure points to a market that reclaimed its footing after the tariff-driven dislocation but lacks the clean positioning to sustain a new advance. Large-cap accounts are long with a covered structure — they participate in upside but are protected against a 5–8% flush. That type of positioning produces slow grinds and sudden drops, not clean trending moves.
The volatility structure adds weight to this view. VIX at 18.14 is below the crisis threshold but well above the complacency zone that would signal institutional confidence. The VIX term structure shows the back end is bid — traders expect more turbulence in 90 days than today. When the curve is shaped that way, short-term dips can look like buying opportunities but the medium-term environment favours smaller position sizes and defined-risk structures.
NQ is above its 20-day moving average. The recovery from the April 9 lows has been orderly. GOOGL’s strong print confirms at least one pillar of the AI spend narrative remains credible. If AAPL guides in-line or better on services revenue, the index has room to retest 27,600.
Institutional accounts sold META and AMZN hard on beats. That is the defining pattern of the week. The market is reducing gross exposure into strength, not adding. AAPL would need to materially exceed on services margins and maintain iPhone guidance to shift that behaviour. The risk is asymmetric: a beat gets sold, a miss gets hammered.
Key Levels
Three Scenarios Into the AAPL Print Tonight
AAPL beats on services revenue with margin expansion and maintains iPhone unit guidance. Market interprets this as selective not wholesale selling. NQ extends above 27,600 in overnight trade, opens Friday above 27,500, with 28,000 as the Q2 target entering PCE.
AAPL beats modestly but softens iPhone guidance or flags China supply uncertainty. Market holds 27,100–27,600 as the range. PCE Friday becomes the real directional catalyst. Most probable given this week’s earnings pattern.
AAPL misses on iPhone units or cuts guidance materially. Market follows the META/AMZN template and sells aggressively. NQ breaks 27,100 overnight, tests 26,850 before PCE. Worst possible setup entering Friday’s inflation print.
Risk Score
MAX
Three factors drive this elevated reading. First, tonight’s AAPL earnings creates binary risk for the index’s second-largest constituent. Second, the sell-the-beat pattern established by META and AMZN this week means even a positive print carries downside risk if guidance disappoints. Third, the elevated cost of hedging volatility confirms that institutional accounts are buying protection aggressively — when that happens, crowd positioning is frequently on the wrong side. The 15% relief from maximum risk reflects GOOGL’s constructive beat and the index holding above key support.
How to Walk It
No maximum positions ahead of AAPL. Binary risk with oversized index consequence.
Range trades within 27,100–27,600. Hard stops. No overnight unhedged longs.
Preferred approach for most traders today. Tight stops. Intraday only.
After AAPL reports, reassess the scenario. First reaction is often wrong. Wait 30min for the dust to settle.
Today is not the day to learn how to trade earnings reactions. The gap risk overnight is real. If you are holding NQ overnight, reduce size to the minimum and set a hard stop. A 200-point NQ gap is entirely possible on either side. Watch what happens, take notes, and trade tomorrow with a clearer picture.
The intraday range between 27,100 and 27,600 is well-defined. Fade the extremes with tight stops and take profits before the AAPL print at 21:00 BST. Do not sit through the earnings reaction unless you are specifically a volatility trader and understand the risk profile.
The elevated cost of hedging volatility creates a case for short-dated put spreads or zero-day options structures around the AAPL print. A straddle on QQQ near the 271 level captures the binary outcome cleanly. Keep the notional small relative to your book — this is asymmetric speculation, not a core position.
For the broader context driving NAS100 today, these briefs from Wednesday 29 April build the full picture:
This analysis is for educational and informational purposes only. It does not constitute financial advice. Always manage your risk independently and in accordance with your own financial circumstances.
Sunday 26 Apr 2026
NAS100 Daily Ticker Read: The Mag 7 Index Walks Into Earnings Week At Record Highs
Daily Ticker Read | Sunday 26 April 2026
Nasdaq 100 closed Friday at 27,303, fresh records after a 1.95 percent session. Five Mag 7 names report Wednesday and Thursday. Structural read says long. Volatility says hedges are still paid for. Both readings coexist for five more sessions, then the prints decide.
Where The Index Sits
NAS100 (the US 100 Cash CFD tracking the Nasdaq 100 index) closed Friday at 27,303, up 521 points or 1.95 percent. Five-day plus 2.0 percent, twenty-day plus 3.4 percent, hundred-day plus 11 percent. No panic numbers, no exhaustion numbers.
The index sits at the top of its twenty-day range, near the top of its fifty-day, and at the absolute high of its two-hundred-day range. That is a triple-confirmation high. The structural read shows price holding above the rising structure in control since early March, with Friday’s leg breaking out cleanly. Directional bias reads long. Structure is behind price, not above it.
Three Levels That Decide The Week
Support: 26,780. Where the rising structure sits and where Friday’s session began before the breakout. A daily close back below breaks the continuation read and rotates back into the prior range. Until then, this level holds for the long thesis to stay intact.
Decision: 27,000. The round number just below Friday’s close, the pivot for intraday work. Reclaim on any pullback keeps the breakout valid. Lose it on volume and the window opens down to support proper.
Resistance: 27,500 to 27,600. No historical resistance above Friday’s close, so the ceiling is measured by extension. 27,500 is the first magnet, 27,600 the upper edge of the breakout impulse. Through the upper band on a daily close opens a measured move toward 28,000.
Long Bias Setup
Continuation Long: Buy The Pullback Into 27,000
Risk score: around 55%
Entry: 27,000 to 27,050 on a controlled pullback. Stop: 26,770 (below support and below the rising structure). Target one: 27,500. Target two: 27,800. Risk to reward: roughly 1:2 to first target, 1:3.5 to second target.
Why it works: Clean breakout with sector tech leading at plus 2.81 percent. Directional bias reads long. Structural confirmation is behind price. The trade reuses the breakout level as support and lets earnings volatility carry the move. Kill condition: daily close back below 26,780.
Short Bias Setup
Earnings-Reversal Short: Fade The Failed Push Above 27,600
Risk score: around 60%
Entry: 27,600 to 27,650 on a wick rejection candle that prints into an earnings miss or a guidance disappointment from one of the Wednesday-to-Thursday names. Stop: 27,820 (above the impulse extension). Target one: 27,000. Target two: 26,780. Risk to reward: roughly 1:2.7 to first target, 1:3.7 to second target.
Why it works: Bullish individual investor sentiment jumped 14.3 points to 46 percent, first time above the historical average in ten weeks. That is the contrarian flag that earnings disappointments weaponise. The trade only triggers on a failed push, the rejection wick paired with a poor outlook read. Kill condition: two clean closes above 27,650.
Time Horizons
Intraday (zero to one day): The 27,000 pivot dominates. Above it, path of least resistance points to 27,400 to 27,500. Below it, next magnet is 26,900 then 26,800. Most of the day sits between 26,950 and 27,300.
Swing (two to ten days): Mag 7 prints Wednesday and Thursday. The week is binary at the index level because the Mag 7 IS the Nasdaq. Clean sweep takes the index to 27,800 to 28,000. Miss with cut outlook on two of the five takes it back to 26,500. Resolves Wednesday after-hours through Thursday after-hours.
Positional (two to eight weeks): Hundred-day uptrend intact, structure not violated since early March. A monthly close above 27,500 confirms the next leg with a measured target near 28,800. A monthly close back below 26,400 invalidates the positional uptrend and resets the bias.
Risk Score
Index risk score: around 65 percent.
- Plus 25 percent for five Mag 7 earnings prints compressed into two trading sessions
- Plus 15 percent for individual investor bullishness jumping 14.3 points to a ten-week high (contrarian flag)
- Plus 15 percent for VIX at 18.71 with VVIX still at 97.18, meaning the hedge bid is real even into a record close
- Plus 10 percent for crypto refusing to confirm the equity rally (BTC soft at 77,900 while NDX prints highs)
- Minus 10 percent because the structural read confirms the long bias and the tech sector ETF leads at plus 2.81 percent
Binary-event week, not a trend-extension week. Size accordingly. Kill conditions are non-negotiable.
The Catalyst That Owns The Week
Apple, Microsoft, Nvidia, Amazon, and Meta together carry a heavy chunk of Nasdaq 100 weight. The index is the Mag 7 index in everything but name. A clean print sweep with sustained AI-capex outlook pushes price toward 27,800 to 28,000 by Friday’s close. A guidance reset from any two of the five reverses the structural read and opens 26,400 as the downside magnet. The Powell press conference lands midweek; a dovish tilt adds a discount-rate tailwind, a hawkish hold pressures the multiples.
Long bias is the base case. Short bias is the hedge that activates only on confirmation of disappointment. Both carry kill conditions. The job is to be sized correctly for either outcome and let the levels decide entry.
What We Called vs What Happened
Wednesday 22 April we called Nasdaq long with high conviction off the channel-floor bounce, with QQQ closing $655.11 that day. Four sessions later the index sits at 27,303, with QQQ trading above the prior swing high. The trend call paid. The pullback entry zone never filled because the bid never came back that low.
| Call (22 Apr) | Outcome (by 26 Apr) | Verdict |
|---|---|---|
| Direction LONG, high conviction | QQQ rallied through the week. Index printed fresh records into Friday close at 27,303 | Confirmed |
| Target $660.50 (prior swing high) | Cleared during the run; QQQ broke above and held | Confirmed |
| Channel ceiling target $670 | QQQ tagged the zone but the cleaner read sits in NDX index points now at 27,303 with the breakout still extending | Partially |
| Pullback entry zone $648-652 | The bid never came back that low. Buyers stayed in control through every test | Missed |
| Stop zone $640 (kill condition) | Never tested. Channel floor held throughout | Confirmed |
Track record: 3 of 5 calls confirmed over the four-session window. The trend read paid in full. The pullback fill missed because the dip never came.
This is analysis, not financial advice. Always manage your risk.
Thursday 23 Apr 2026
Daily Framework Read | Thursday 23 April 2026 | Published 22:00 London / 17:00 New York / 07:00 Tokyo
QQQ $651.42 -0.56%
The Nasdaq gave back yesterday’s gains with a measured pullback. QQQ dropped half a percent as tech names rotated lower across the board. MSFT led the decline at nearly 4%, while TSLA shed 3.5%. This was not panic selling. This was profit-taking after a strong rally day. The character of the pullback matters more than the magnitude.
Framework Read
| Layer | Reading | Interpretation |
|---|---|---|
| Direction | CAUTIOUS LONG | Trend intact but momentum fading on the session |
| Structure | Pullback within trend | Higher lows holding. No structural damage yet |
| Momentum | Slowing | Short-term momentum rolled over. Medium-term still positive |
| Flow | Mixed | Some rotation out of mega-cap tech into value. Not outright distribution |
| Evidence | Cautious bullish | Pullback is normal after yesterday’s move. Watch for follow-through |
Yesterday vs Today
Yesterday was a strong rally with QQQ gaining 1.67%. Tech led, breadth was strong, and the move had conviction. Today reversed that enthusiasm. MSFT dropped nearly 4% which dragged the index. NVDA and TSLA also weighed. The pattern is classic: strong rally, next-day digestion. The question is whether this is a one-day pause or the start of a deeper rotation out of growth.
The Read
The pullback was orderly. Volume was below yesterday’s rally volume, which tells you the sellers lacked conviction. MSFT’s drop looks earnings-positioning related rather than fundamental deterioration. AAPL held flat, showing selective rotation rather than blanket selling. When the strongest names hold while the stretched names correct, that is healthy.
The call: stay cautiously long. The trend structure is intact. Use the pullback for selective entries. If QQQ holds above $645, the rally resumes. Below $640, reassess.
Key Levels
| Level | Price | Significance |
|---|---|---|
| Target 2 | $668.00 | Measured move on breakout continuation |
| Target 1 | $660.00 | Prior swing high and resistance cluster |
| Entry Zone | $645-650 | Pullback zone where buyers stepped in |
| Support 1 | $640.00 | Structural support from last week’s breakout |
| Stop Zone | $635.00 | Below here the rally thesis fails |
| Support 2 | $628.00 | Deep support. Gap fill from prior week |
What We Called vs What Happened
Yesterday we said stay long with $655 QQQ as the floor. Today’s pullback brought us to $651, slightly below that level. The move was orderly and within the expected digestion range. The broader framework remains intact. Those who stayed long are still in profit from the week’s move.
Risk Assessment
Domain risk: Around 40% (moderate)
Pullback after a strong rally is normal but VIX ticked higher by 2%. MSFT dropping nearly 4% is notable and could signal broader tech rotation if it continues. Risk is elevated versus yesterday but not alarming. The structure holds unless $640 breaks on QQQ.
Bottom line: NAS100 pulled back on profit-taking after yesterday’s strong rally. The move is orderly and within trend. Stay cautiously long above $645 QQQ. MSFT weakness is the watch point. If it stabilises, the rally resumes. If it deepens, expect broader tech rotation.
Cross-reference: Today’s Positioning Report for sector rotation and institutional flow data.
This is analysis, not financial advice. Always manage your risk.
Thursday 23 Apr 2026
Daily Framework Read | Wednesday 22 April 2026 | Published 22:00 London / 17:00 New York / 07:00 Tokyo
QQQ $655.11 +1.67%
The Nasdaq bounced hard off the channel floor and did not look back. QQQ gained 1.67% in a session where buyers stepped in early and held all day. The framework says LONG with high conviction. The structure held exactly where it needed to, and the follow-through was decisive. This is not a tentative bid. This is institutions putting money back to work.
Framework Read
| Layer | Reading | Interpretation |
|---|---|---|
| Direction | LONG | High conviction. All layers pointing higher. The framework is committed |
| Structure | Channel floor bounce | Held the bottom of the rising channel. Classic institutional entry zone |
| Momentum | Accelerating | Momentum confirmed the turn. Short-term and medium-term aligned bullish |
| Flow | Buyers dominant | Volume confirmed the bid. This was real demand, not a short squeeze. Institutional footprint visible |
| Evidence | Aligned bullish | All layers agree. High conviction long. This is what clean alignment looks like |
Yesterday vs Today
Yesterday was hesitation. Sellers tested the bid and there was no immediate response. The market drifted lower and the mood was cautious. Today was the answer. Buyers defended the channel floor and the move was sustained, not a spike that faded. That shift from hesitation to conviction is the signature of institutional accumulation completing and the mark-up phase beginning.
The Read
The channel floor held. That is the entire story. When the structure holds after a test, the next move tends to be in the direction of the larger trend. The bounce was backed by volume, backed by momentum, and backed by breadth. Tech led the rally with mega-caps all participating. That is not a narrow move you can dismiss. That is broad conviction.
The call is simple: above the channel floor, stay long. The trend is intact, momentum has confirmed, and the flow says institutions are buying. Any pullback into the $645-650 zone is a gift for those who missed the bounce.
Key Levels
| Level | Price | Significance |
|---|---|---|
| Resistance 2 | $670.00 | Channel ceiling. Next measured target on continuation |
| Resistance 1 | $660.50 | Prior swing high. First test on the way up |
| Entry Zone | $648-652 | Pullback entry zone. Where the bid sat today |
| Support 1 | $644.30 | Channel floor. The line in the sand for bulls |
| Stop Zone | $640.00 | Below this, the bounce has failed and the picture changes |
| Support 2 | $632.00 | Deep structural support. Only relevant if the channel breaks |
What We Called vs What Happened
Yesterday the framework was watching. The hesitation was real and the evidence was split. We said wait for confirmation. Today confirmed. The channel floor held, the layers aligned, and the framework moved to LONG. Patience paid. Those who waited for confirmation got a cleaner entry than those who guessed.
Risk Assessment
Domain risk: Around 30% (low-moderate)
The channel held. Momentum confirmed. Flow is institutional. The risk here is low relative to the opportunity because structure and momentum agree. The main risk factor is overnight macro events or a reversal in equity inflows. But the evidence stack favours continuation.
Bottom line: NAS100 is in go mode. The channel floor held, the bounce was real, and the framework is fully aligned long. Stay with the trend. Use pullbacks to $648-652 for entries. Stop below $640. Target the channel ceiling at $670. This is what conviction looks like.
Cross-reference: Today’s Positioning Report for full macro context and sector flow.
This is analysis, not financial advice. Always manage your risk.
Tuesday 21 Apr 2026
Daily Framework Read | Tuesday 22 April 2026 | Nasdaq 100 (NAS100)
21:00 London (BST) / 16:00 New York (EDT) / 05:00 Tokyo (JST)
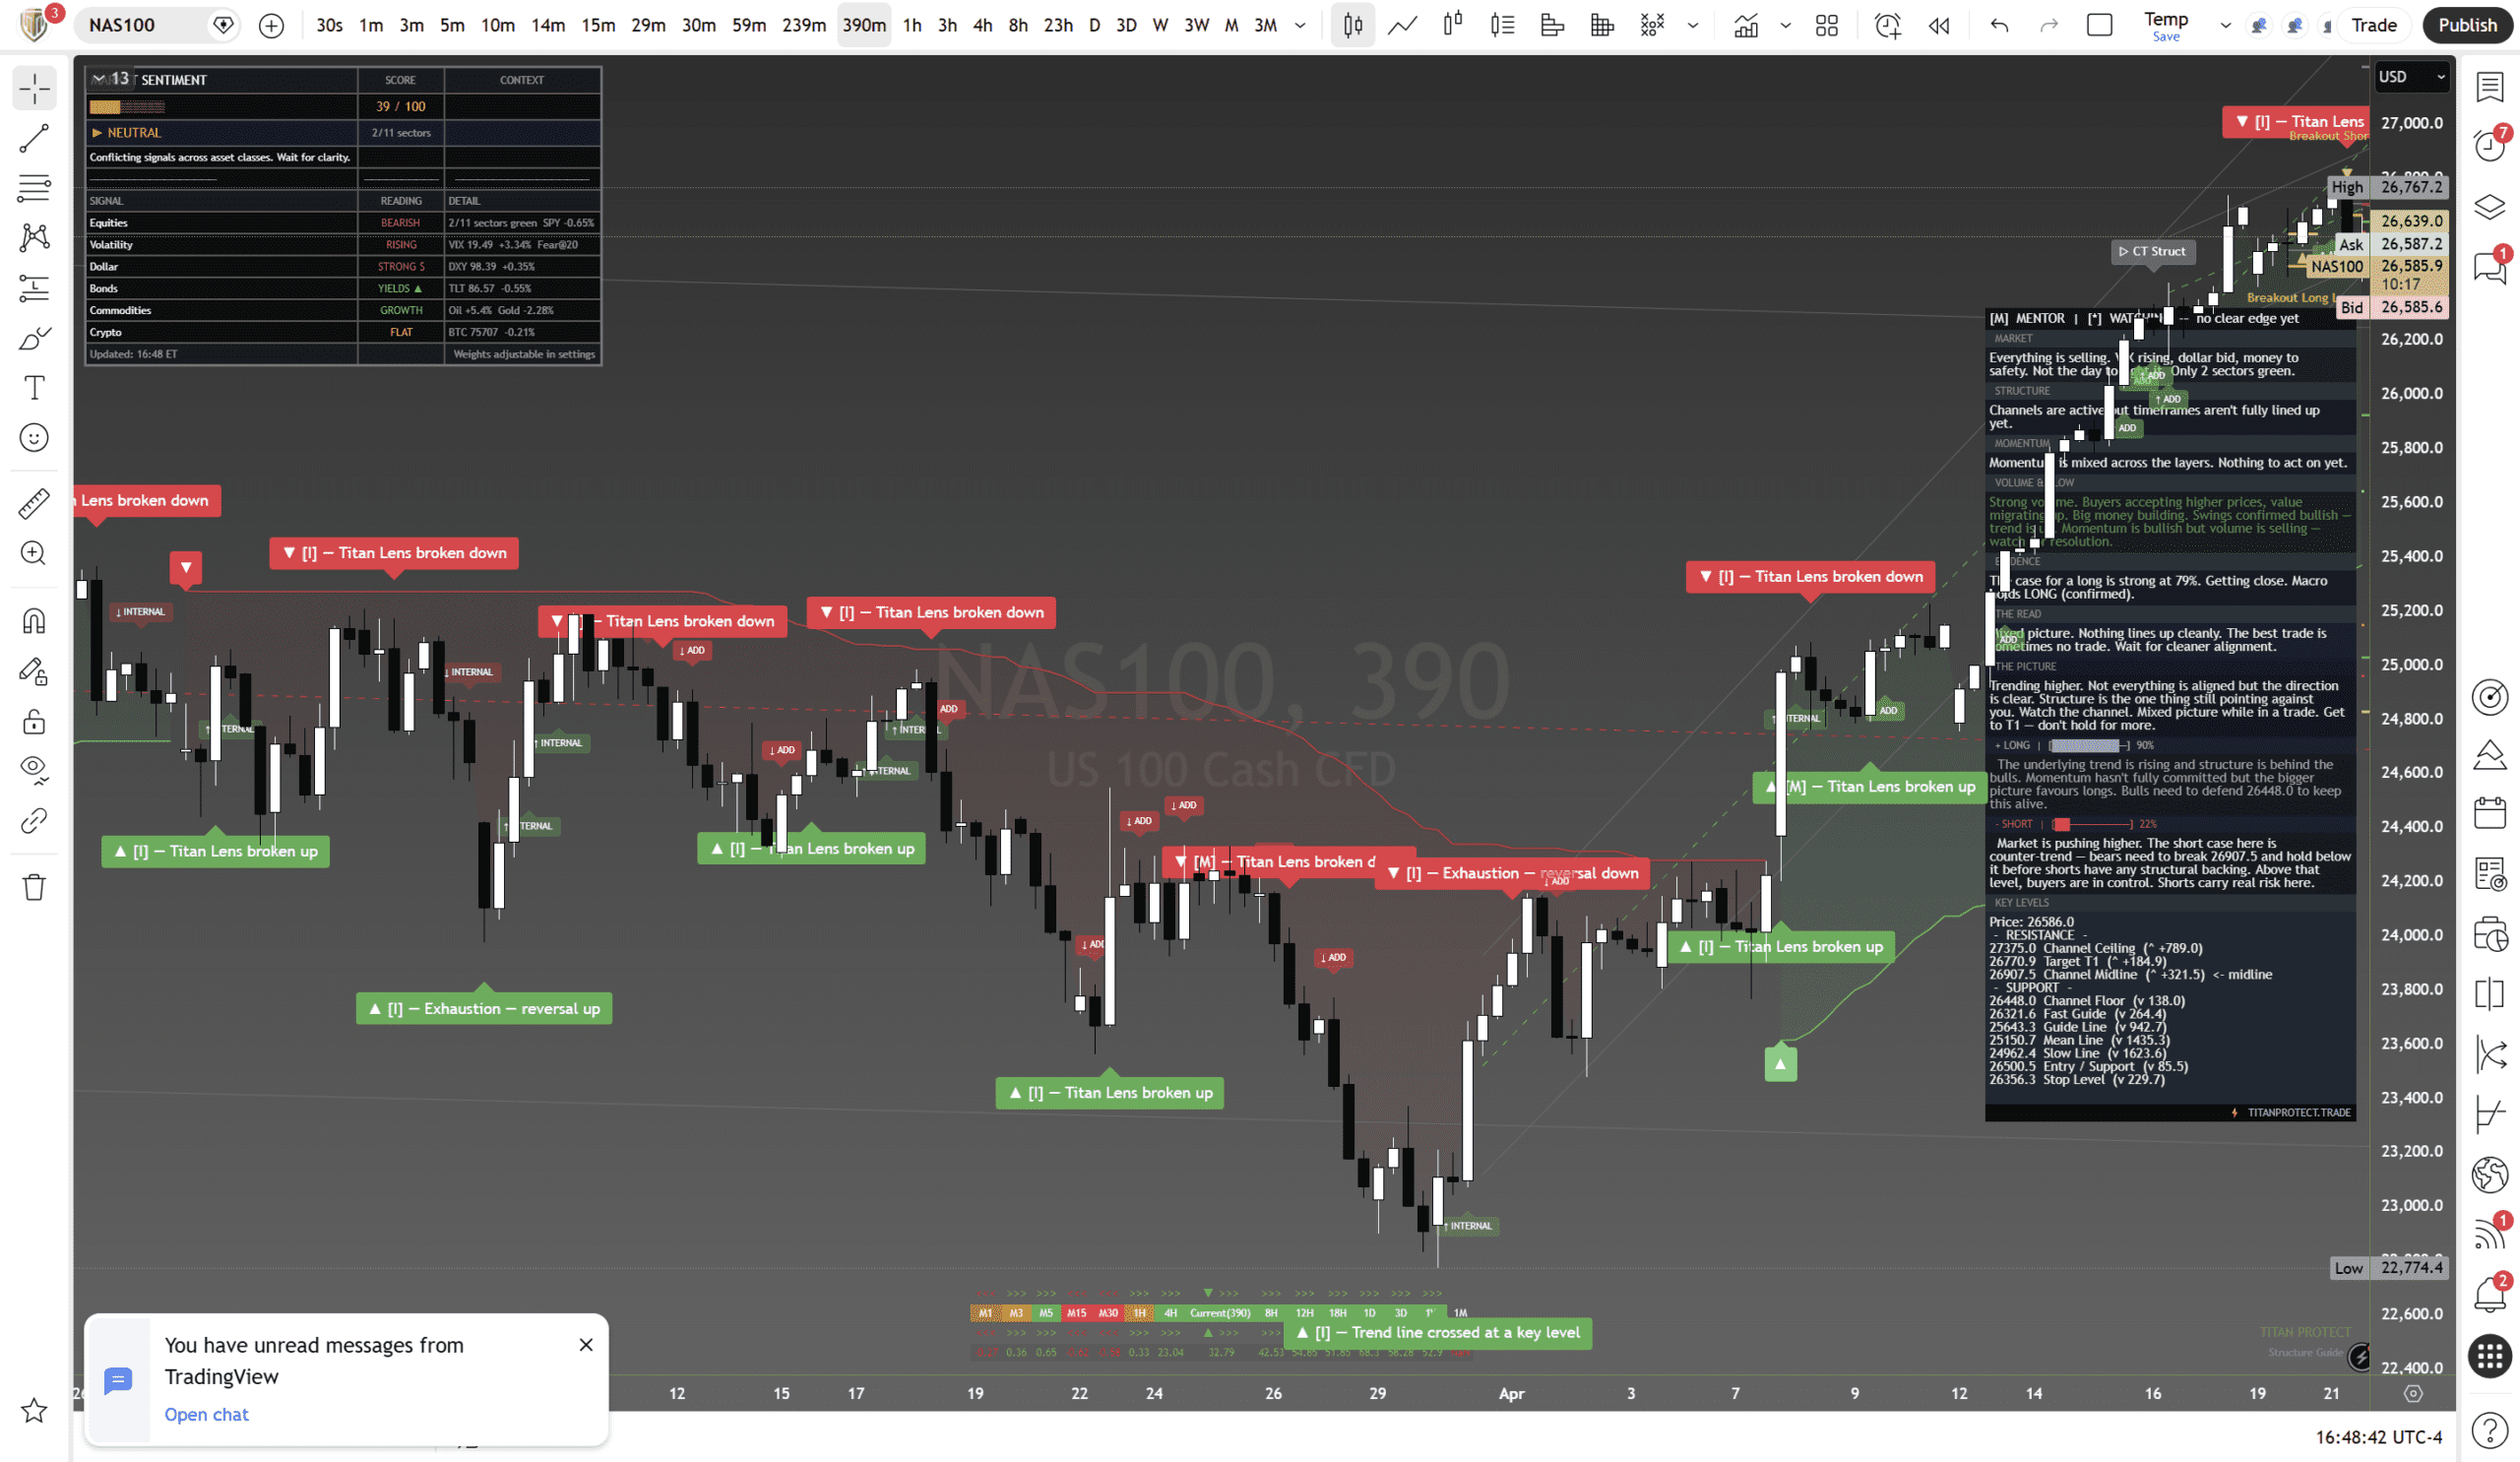
Signal
WATCHING
Conviction
Around 80%
Risk Level
Around 35% — mixed momentum and VIX above 20 add uncertainty
Structure
Bullish bias, channels active but timeframes not fully aligned
Market Context
Everything is selling. VIX rising, dollar bid, money moving to safety. Only 2 of 11 sectors green. This is not the day to fight the tape.
What the Framework Says
Structure
Channels are active but timeframes have not fully lined up yet. The macro structure holds long, but the shorter layers are still catching up. Price is trading inside the channel with room to move in either direction. The channel floor sits at 26,448 and needs defending.
Momentum
Momentum is mixed across the layers. Nothing to act on yet. The underlying trend is rising and structure is behind the bulls, but momentum has not fully committed. The bigger picture favours longs, but you need 26,448 to hold for that to stay alive.
Volume and Flow
Strong volume profile. Buyers accepting higher prices, value migrating up. Big money building. Swings confirmed bullish — trend is up. Momentum is bullish but volume is selling, which means the resolution has not arrived yet.
The Cases
Bull Case
The case for a long is strong at 79%. Getting close. Macro holds LONG (confirmed). The underlying trend is rising and structure is behind the bulls. Bulls need to defend 26,448 to keep this alive.
Bear Case
Market is pushing higher. The short case here is counter-trend — bears need to break 26,007 and hold below it before shorts have any structural backing. Above that level, buyers are in control. Shorts carry real risk here.
Key Levels
| Level | Price | Distance |
|---|---|---|
| Channel Ceiling | 27,375.0 | +789.0 |
| Target T1 | 26,770.9 | +184.9 |
| Channel Midline | 26,907.0 | +321.5 |
| Channel Floor | 26,448.0 | -138.0 |
| Fast Guide | 26,321.6 | -264.4 |
| Golden Line | 25,643.5 | -942.5 |
| Mean Line | 25,150.7 | -1,435.3 |
| Stop Level | 26,356.3 | -229.7 |
The Call
Framework Status: WATCHING
No trade yet. The framework sees the long setup building but nothing lines up cleanly. The best trade is sometimes no trade. Wait for cleaner alignment before committing capital.
This is a framework read based on structural, momentum, and volume analysis at the close of 21 April 2026. It is not financial advice. Every trader is responsible for their own risk management. Past framework reads do not guarantee future accuracy. Position sizing and stop placement are your responsibility.
Published by Titan Protect | Daily Framework Reads are available to members 24 hours before public release.



