Volatility Snapshot and Immediate Readings
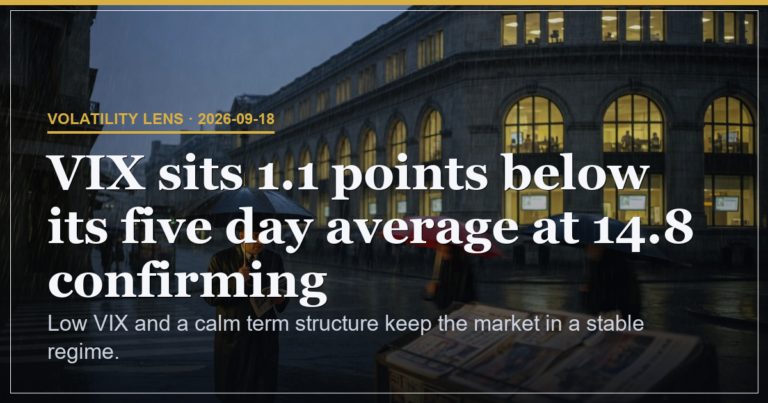
VIX prints at 17.2 after a 0.4 point retreat from yesterday while sitting 0.5 above the five day average of 16.7. The range between 16.8 and 18.0 keeps spot near the middle and leaves realised moves contained. This level sits in a zone where equity desks have historically seen limited forced hedging yet still carry enough premium to absorb modest headline shocks. Building on the Positioning Pressure note that bullish call flow in NVDA META MSFT AMD and AMZN outweighs absent dark pool prints the volatility surface shows no sign of that flow turning defensive. The result is a regime where risk assets can grind without an immediate volatility tax yet any break above 18.0 would quickly lift gamma costs across index books.
Term Structure and What the Curve Prices
VIX9D at 17.21 versus spot at 17.2 creates an almost perfectly flat profile while VVIX at 94.9 signals low demand for volatility of volatility. A flat curve at these levels shows the market is pricing calm rather than fear as our key fact states. Front month futures therefore offer little carry advantage for short volatility positions and the absence of backwardation removes the usual buffer that cushions downside equity moves. Cross referencing the Macro Pulse pod the dollar strength and mixed China data align with this flat structure because they cap risk appetite without triggering outright hedging. The practical outcome is that any equity rally stays supported by dealer rebalancing while a sudden risk off event would meet thin protection layers.
| Metric | Level | Tactical Insight |
|---|---|---|
| VIX Spot | 17.2 | Neutral zone allows equity drift higher on call flow without volatility spike unless 18.0 breaks |
| VIX9D | 17.21 | Flat profile removes front month carry edge and keeps short vol strategies range bound |
| VVIX | 94.9 | Low vol of vol suggests limited tail demand so large moves stay expensive to insure |
Positioning and Flow Overlays
The Positioning Pressure read highlights average put call ratio at 0.739 with heavy call buying in mega cap names that dominate index gamma. This flow supports the neutral volatility stance because dealer long gamma from those calls favours upside pinning near the 761 SPX max pain level noted in Option Watch. As the Institutional Insight pod confirms the same tech bias feeds positive equity sentiment overall. The empty dark pool slate removes one confirmation layer yet does not override the options signal so price action stays tethered to levels where call holders can force rebalancing. The Hot Zones observation of broad selling in small caps sits in contrast yet the contained VIX prevents that weakness from cascading into index protection buying.
Scenario Probabilities and Risk Budget
Base case calm continuation carries 55 percent probability with volatility staying inside 16.5 to 18.0 on steady options flow. A volatility compression scenario into sub 16 prints holds 25 percent odds if equity futures hold above 7690 as Setup Radar suggests. An upside volatility spike above 19 receives 20 percent weight should macro data or FX moves from the FX Focus pod accelerate dollar strength into risk off flows. Risk sits at 25 percent driven primarily by the flat term structure leaving little cushion if pinning at SPY max pain fails into the expiry.
| Scenario | Probability | Key Trigger | Desk Response |
|---|---|---|---|
| Calm Continuation | 55% | Options flow holds and futures stay above 7690 | Maintain neutral gamma hedges and scale into dips only on confirmed support |
| Compression | 25% | Further call buying pins price near 761 | Reduce short vol size and watch for carry erosion |
| Spike | 20% | Dollar or China data break the flat curve | Exit short dated premium and shift to longer dated protection |
Experience Level Guidance
Beginner traders should focus on the flat curve as a signal to avoid aggressive short volatility positions until the range expands beyond 18.0. Intermediate desks can use the 16.8 to 18.0 bounds for mean reversion trades in VIX futures while monitoring the 761 SPY pin. Advanced participants may overlay the bullish mega cap call flow against the flat term structure to construct ratio spreads that collect premium while capping tail exposure. All levels benefit from the 25 percent risk budget that keeps position size modest ahead of further macro prints.
Desk Synthesis
Moderate and flat volatility leaves risk assets in a stable regime with limited immediate threat. The one line bias is to stay neutral on volatility with a slight lean toward compression if call flow persists. This is analysis, not financial advice. Always manage your risk.