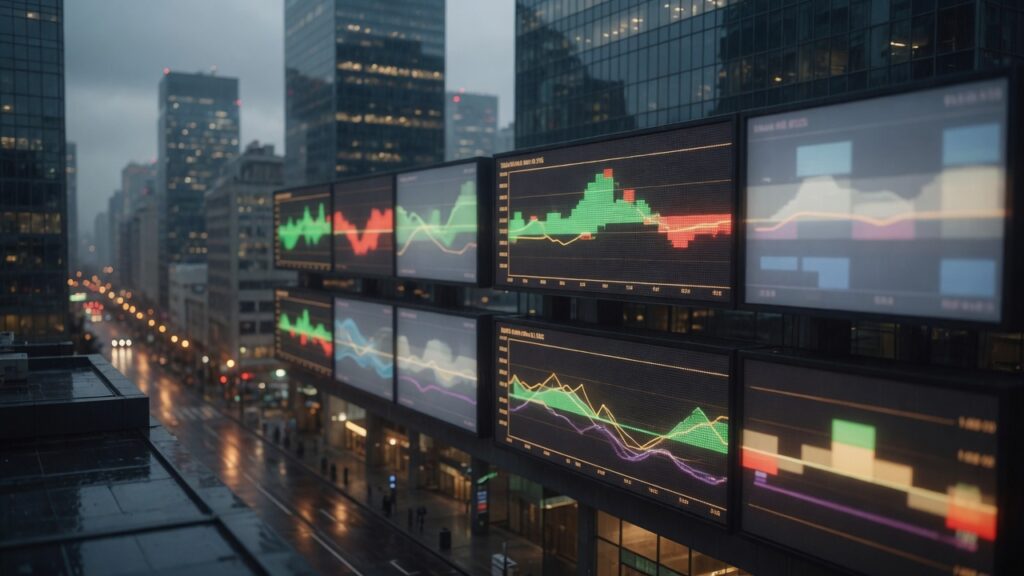
Term Structure Remains Blank
The futures array stands empty once more, so no basis or carry readings can be extracted from the curve. Without those levels desks lose the usual window into real-money positioning and rolling pressure. Spot indices closed modestly lower, SPX at 7499 and NDX at 28998, each off less than one percent, yet the move lacks the futures counterpart that would confirm whether selling reflects outright supply or simple absence of support. This gap keeps conviction readings muted at the two level already flagged in the pod summary.
Options Flow Steps Forward as Proxy
Building on yesterday’s view in our Positioning Pressure read notes, the concentrated call interest in AAPL, NVDA, META, MSFT, AMD and AMZN continues to dominate. The put-call ratio sits at 0.775, confirming leveraged upside demand from real-money accounts that now prefer derivatives over spot accumulation. As our Institutional Insight pod notes, this flow remains the primary live footprint once dark-pool prints went dark. The same mega-cap names that carry heavy index weight keep pressure pointed toward the SPY 748 max pain strike, just above the 747.41 cash print.
| Strike Cluster | Current Distance | Tactical Insight |
|---|---|---|
| SPY 748 max pain | 0.6 points above cash | Dealer gamma exposure stays balanced, limiting forced hedging and supporting the neutral drift observed in spot. |
| Zero-day open interest | Concentrated near 748 | Minimal rebalancing required, reducing intraday volatility even as small-cap and tech names lag the broader tape. |
Spot Action Versus Missing Curve
Yesterday the market posted solid gains with SPX at 7509 and NDX at 29155. Today that advance gave ground without decisive follow-through, leaving the tape in a quiet neutral regime. As our Volatility Lens pod observes, the curve prices calm conditions ahead, which aligns with the narrow gap between spot and max pain. The absence of futures data means desks cannot judge whether the modest downside reflects genuine distribution or simply the lack of rolling bids that would normally appear in the term structure.
Cross-Market Context and Sector Drag
Hot Zones notes small caps and tech underperforming while Global Grid records contained weakness with no decisive global follow-through. Raw Materials Radar shows haven flows into gold and energy, hinting at slower growth expectations that sit alongside the missing futures signals. FX Focus adds a mixed dollar tone that leaves risk currencies soft, further muting any clear directional cue from the equity complex.
| Index | Daily Change | Volume Context | Tactical Insight |
|---|---|---|---|
| SPY | -0.12 percent | 32 million shares | Light participation keeps the 746 to 750 range intact until fresh futures data returns. |
| QQQ | -0.51 percent | 23 million shares | Tech lag aligns with the options-driven support rather than outright selling pressure. |
| IWM | -0.93 percent | 19 million shares | Small-cap underperformance highlights the narrow breadth that futures would normally quantify via basis. |
Scenarios and Risk Calibration
Three forward paths emerge from the current data gap. A 45 percent probability sees continued pinning around 748 with options flow absorbing modest spot pressure. A 35 percent probability allows a clean break lower once earnings clusters arrive later in the week. A 20 percent probability sees an upside extension if real-money accounts rotate from calls into spot once futures liquidity returns. Risk sits at 40 percent, driven primarily by the empty term structure that leaves carry and conviction unreadable. Beginners should stay on the sidelines and observe max-pain mechanics. Intermediate traders can monitor the 746 to 750 band for entry timing. Advanced desks may use the options footprint as a temporary proxy while awaiting futures restoration.
Forward View
The view has evolved from yesterday’s clean spot advance against an empty curve to today’s modest downside that still lacks any futures calibration. Without those signals the market remains in a neutral regime where options flow provides the only visible anchor. This is analysis, not financial advice. Always manage your risk.
Neutral bias persists until futures data returns.