The CrudeOil Framework Journal for June 2026, newest read at the top. Each dated entry is our read on the close, kept as a living record so the framework can be judged over time. This is analysis, not financial advice.
Tuesday 30 Jun 2026
Crude Oil (WTI)
Daily Framework Read | Tuesday 30 June 2026
Q3 Day 2
CONFIDENCE
Moderate
RISK FACTOR
6.8%
Framework Interpretation
Structure
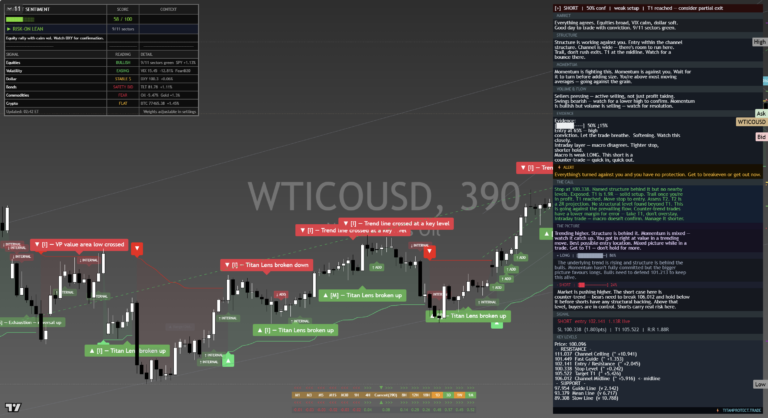
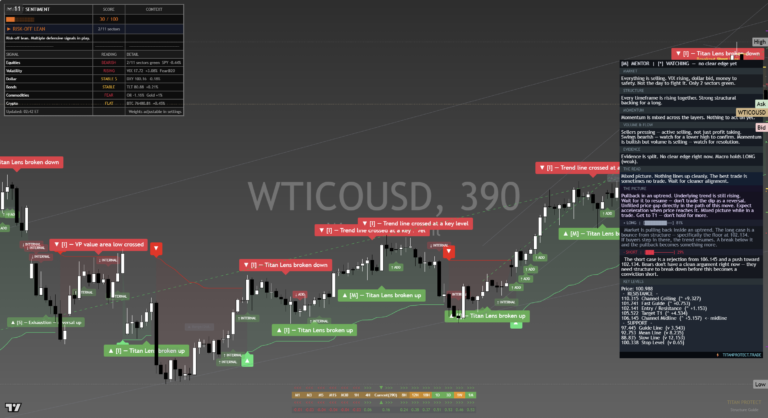
Monday crude was bearish with high confidence. Today the framework has softened to moderate confidence while maintaining the bearish lean. The 390-minute chart confirms MOSTLY SHORT with one layer not yet confirmed. The Titan Lens has broken down multiple times on the way lower, and the cloud sits firmly above price. The downtrend from the highs is clean and organised with lower highs and lower lows. The broader structure is bearish and the correction continues.
Momentum
Momentum is mixed across the layers but leaning bearish. The bigger picture is down and the shorter-term is pulling in the same direction. One layer has not fully confirmed, which is why this is moderate rather than high. The selling pressure is visible on the chart with active selling and profit taking at lows. Some demand is emerging near current levels but it is reactive, not proactive.
Volume
Sellers pressing actively. The value area has a clear shift at 90% with selling pressure clearly dominant. Profit taking is visible at the lows but it is not buying conviction, it is short covering. The volume profile confirms distribution from higher levels with genuine participation behind the move. The chart shows the cloud remnant above as a ceiling that bulls have failed to reclaim.
The Call
Bearish with moderate confidence. Monday was high conviction, today has softened slightly because one layer has not confirmed. But the structure remains decisively bearish. The downtrend is intact, the cloud is overhead, and sellers are in control. The Mentor is clear: bias is down, no breakdown yet, but if it pushes to the lows, selling pressure intensifies. WTI remains sensitive to OPEC headlines, inventory data, and dollar moves. The framework says lean short but do not chase the breakdown without a catalyst.
Key Levels
| Level | Price | Significance |
|---|---|---|
| Resistance 2 | 63.50 | Cloud base, major overhead supply |
| Resistance 1 | 61.80 | Near-term rejection zone, value area high |
| Current Price | ~60.20 | Below cloud, downtrend intact |
| Support 1 | 58.70 | Near-term demand, profit-taking zone |
| Support 2 | 57.00 | Channel floor, major structural support |
Risk Assessment
ELEVATED
OPEC headline risk + inventory data + one unconfirmed layer
Risk is elevated because crude oil is inherently exposed to supply-side headline risk. OPEC decisions, geopolitical disruptions, and inventory data can reverse technical setups overnight. The framework is bearish but one layer has not confirmed, adding the risk of premature positioning. Month-end and quarter-end portfolio rebalancing could inject unexpected flows.
Scenario Analysis
Bull Case
15%
OPEC surprise or supply disruption reverses the downtrend
Sideways
25%
Range 58.70-61.80 as sellers take profits and buyers test demand
Correction
50%
Break below 58.70 with volume, targeting 57.00 channel floor
Black Swan
10%
Geopolitical escalation or demand collapse accelerates the move
Position Sizing Guidance
Moderate conviction warrants reduced sizing. Monday was high conviction and today has softened because one layer has not confirmed. If you entered on Monday’s bearish read, the framework still supports the position with stops above 63.50. New entries should wait for a bounce into 61.80 resistance or a clean break below 58.70 with volume confirmation. Do not chase the trend into extended lows without a catalyst.
Experience-Level Guidance
Beginner
Crude oil has been falling steadily and the framework remains bearish. But today’s confidence has dropped from high to moderate. That tells you the selling may be losing some steam even if the direction has not changed. Crude oil is one of the most volatile commodities and headline risk from OPEC or geopolitics can reverse the move in hours. If you are not positioned, the framework is not offering a high-conviction entry. Watch and learn from how price reacts at the support levels.
Intermediate
The softening from high to moderate conviction is the framework telling you the easy money on the short side may have been made. The 58.70 support zone is the next level. A clean break with volume extends the downtrend to 57.00. A bounce from 58.70 could set up a range between support and the 61.80 resistance. Plan both scenarios. The one-layer gap between moderate and high conviction is often where the market pauses and consolidates before the next leg.
Advanced
Mostly short with one layer pending. The structure is clean but the softening from high to moderate conviction signals profit-taking at lows. The cloud remains overhead as a confirmed ceiling. The 57.00 channel floor is the structural target. Inventory data this week and OPEC rhetoric are the fundamental co-pilots. The short trade is still the path of least resistance but the risk-reward has deteriorated from Monday. For fresh entries, the 61.80 bounce-rejection setup offers better risk-reward than chasing here. Options volatility is elevated, creating opportunities for defined-risk strategies.
This content is for informational and educational purposes only. It does not constitute financial advice, investment recommendations, or a solicitation to trade. All trading involves risk. Past performance does not guarantee future results. Always conduct your own research and consult a qualified financial adviser before making investment decisions. Titan Protect is not responsible for any losses incurred from acting on this information.
Tuesday 30 Jun 2026
Crude Oil (WTI)
Daily Framework Read | Monday 29 June 2026
Q3 Day 1
CONFIDENCE
High
RISK FACTOR
7.2%
Framework Interpretation
Structure
Crude Oil at $70.43 has reclaimed the $70 handle but the analysis reads this as a dead-cat bounce within a decisive downtrend. The 390-minute chart shows 7/8 confluence on the short side with T1 already reached. The Titan Lens has broken down, Titan Lens broken down again lower, and every bounce has been sold into. Structure is emphatically bearish. The Iran de-escalation narrative has reduced the geopolitical premium, and the chart reflects it.
Momentum
Momentum is fully aligned to the downside. The framework sees no strong push higher happening, with all four reading strength metrics confirming the bearish case. This is the cleanest momentum read in the commodity complex today. Sellers have conviction and buyers are stepping aside.
Volume
Selling volume has been genuine. Buyers at higher levels have been overwhelmed, and the volume profile shows clear distribution from the upper range. The reclaim of $70 came on lighter volume than the selloff, which the analysis reads as a corrective bounce rather than a genuine reversal. Clean short setup if this bounce fails.
The Call
Bearish with high confidence. This is the strongest directional read in the commodity batch. Iran de-escalation has removed the supply premium, the downtrend is clean, and momentum is fully aligned. The $70 reclaim is being treated by the framework as a sell opportunity rather than a reversal signal. However, risk is elevated because extended trends breed crowded positioning, and a single headline can trigger a violent squeeze. Trade the direction but respect the headline risk.
Key Levels
| Level | Price | Significance |
|---|---|---|
| Resistance 2 | 71.75 | Prior breakdown level, major overhead supply |
| Resistance 1 | 70.80 | Bounce rejection zone, value area high |
| Current Price | ~70.43 | Just above $70 handle, bounce territory |
| Support 1 | 69.50 | Prior session low, near-term target |
| Support 2 | 68.00 | Major structural floor, extended target |
Risk Assessment
HIGH
Extended trend + headline risk + crowded positioning + Iran variable
Despite high conviction in the direction, risk is elevated precisely because the move has been so clean. Extended downtrends attract crowded short positioning, which creates squeeze risk on any positive catalyst. Iran de-escalation is priced in, but any reversal on that front could trigger a 3-4% gap higher within sessions. OPEC commentary and inventory data are additional catalysts this week.
Scenario Analysis
Bull Case
15%
Iran re-escalation, OPEC cut surprise, reclaim 71.75
Sideways
25%
Consolidation 69.50-71.75 before next leg
Correction
50%
Bounce fails, break below 69.50 targeting 68.00
Black Swan
10%
Supply disruption, geopolitical shock drives gap above 73
Position Sizing Guidance
High conviction supports standard sizing. The framework alignment is the strongest in the commodity complex today. However, headline risk keeps this below maximum. If already positioned short, the framework supports holding with stops above 71.75. If entering fresh, a rejection at 70.80 on declining volume is the cleaner entry than chasing below 70.
Experience-Level Guidance
Beginner
Crude Oil has a high-confidence bearish read today, which might seem like an easy trade. It is not. The 4.2% drop last week and headline-driven volatility make this a professional’s market. Observe how the bounce at $70 plays out. Learn what a “dead-cat bounce” looks like in real time. Do not trade this unless you are comfortable with the idea of being right on direction but wrong on timing.
Intermediate
The framework says this bounce is for selling, not buying. Look for price to stall near 70.80 and reject with volume. If it does, the framework supports a bearish entry with a stop above 71.75 and a target of 69.50 initially. The key risk is an Iran headline reversing the de-escalation narrative. If $70 breaks to the downside cleanly, that confirms the continuation and opens 68 as the next target.
Advanced
7/8 confluence with T1 reached is the cleanest read in the batch. The Iran de-escalation has structurally removed supply premium and the trend reflects it. Short the bounce, not the breakdown. The 70.80 rejection zone is the level to sell into. Watch for OPEC commentary and inventory data as near-term catalysts. The crowded-short risk means a failed breakdown below 69.50 could trigger a violent squeeze to 72+. Manage that tail risk actively. Consider partial profit-taking at T1 levels and a trailing structure for the remainder.
This content is for informational and educational purposes only. It does not constitute financial advice, investment recommendations, or a solicitation to trade. All trading involves risk. Past performance does not guarantee future results. Always conduct your own research and consult a qualified financial adviser before making investment decisions. Titan Protect is not responsible for any losses incurred from acting on this information.
Tuesday 30 Jun 2026
Crude Oil vs Gold: The Divergence That Defines Q3
29 June 2026 · Cross-Asset Signal Analysis
Gold is trading above $4,100. Crude oil is below $70. The Strait of Hormuz is under active military threat. One of these things does not fit with the others, and the market is telling you exactly which one.
This is not a subtle divergence. It is one of the widest cross-asset disconnects since the 2020 demand collapse, and it is happening at the exact moment you would expect the opposite. When military strikes are exchanged near the world’s most critical oil chokepoint and crude still cannot hold $70, the signal is not ambiguous. The market is pricing something specific, and traders heading into Q3 need to understand what it is.
The Signal at a Glance
| Gold (XAU/USD) | $4,096 — tested $4,111 |
| WTI Crude Oil | $69.23 — range $68.56 to $71.86 |
| DXY (Dollar Index) | 101.36 — down 5 straight sessions |
| Strait of Hormuz Flow | 25% of seaborne oil, 20% of global LNG |
| Iran Escalation | US strikes Jun 27 + 28, IRGC retaliated both times |
Why Gold Is Doing Exactly What It Should
Gold above $4,100 is not a surprise. It is the logical consequence of at least four forces converging at once, and every single one of them is accelerating rather than fading.
Central bank accumulation remains relentless. The buying that started after 2022’s reserve freezes has not slowed. Sovereign allocators continue diversifying away from dollar-denominated reserves, and they are not price-sensitive at these levels. This is structural demand with a multi-year horizon, and it provides a floor that did not exist in previous gold cycles.
Dollar weakness is compounding the bid. The DXY has dropped for five consecutive sessions and sits at 101.36. For international buyers, gold is getting cheaper in local currency terms even as the dollar price rises. That is a powerful feedback loop.
Geopolitical hedging needs no explanation. When the MOU ceasefire signed on 17 June collapses within ten days and military strikes resume on consecutive days, capital moves to the one asset that has no counterparty risk. Gold does not need a functioning banking system, a stable government, or an open shipping lane to hold its value.
Real rate expectations are shifting. Markets increasingly expect central banks to ease in the second half of 2026. Lower real rates reduce the opportunity cost of holding a non-yielding asset. Gold thrives in this environment.
Put all four together and the move above $4,100 is not speculative froth. It is rational positioning for a world that looks less stable, less dollar-centric, and more likely to see rate cuts than rate hikes.
Why Crude Oil Below $70 Is the Real Story
If you only looked at the geopolitical headlines, you would expect crude at $85 or higher. The Strait of Hormuz handles roughly 25% of the world’s seaborne oil and 20% of global LNG. The US struck Iranian targets twice in 48 hours. The IRGC retaliated both times. The ceasefire is functionally dead. By any historical standard, this is a supply-premium environment.
And yet WTI cannot hold $70.
That single fact tells you something that no headline can: demand fear is stronger than supply fear. The market is not ignoring the Hormuz risk. It is weighing it against something it considers more probable and more damaging: a meaningful slowdown in global consumption.
There are several layers to this demand concern:
- China’s recovery has underwhelmed. The world’s largest crude importer has not delivered the demand surge that was priced in at the start of the year. Manufacturing PMIs have been mixed. Property sector weakness continues to drag on construction-related fuel demand.
- European industrial activity remains soft. Germany’s manufacturing sector has not found a floor. Energy-intensive industries across the eurozone are operating below pre-pandemic levels.
- US consumer resilience is being questioned. The labour market is cooling. Core PCE data due this week will either confirm or challenge the soft landing narrative.
- OPEC+ discipline is uncertain. The cartel faces internal tension between those who want to defend price and those who want to defend market share. Any crack in production discipline would add supply to an already nervous market.
The result is a crude market that sees military escalation as containable or temporary, while seeing demand destruction as structural and spreading. That is a profoundly bearish assessment of the global growth outlook.
Reading the Divergence: What the Market Is Pricing
| Factor | Gold Impact | Crude Impact |
|---|---|---|
| Geopolitical risk (Iran) | Bullish ↑ | Contained |
| Dollar weakness (DXY 101.36) | Bullish ↑ | Mild support |
| Central bank buying | Bullish ↑ | No effect |
| Recession/demand fear | Bullish (safe haven) | Bearish ↓ |
| Rate cut expectations | Bullish ↑ | Mild support |
| OPEC+ discipline risk | No effect | Bearish ↓ |
The table makes the asymmetry obvious. Gold benefits from nearly every macro force currently in play. Crude is caught between a geopolitical premium it cannot monetise and a demand outlook that keeps pulling it lower. The divergence is not a glitch. It is the market’s most honest statement about where we stand heading into Q3.
When gold rises on fear and crude falls on the same fear, the market is telling you it is more worried about whether people will buy things than whether ships can deliver them.
Historical Resolution Patterns
This type of gold-crude divergence does not persist indefinitely. Historically, it resolves in one of two ways, and understanding both scenarios is critical for positioning.
Scenario A: Crude Catches Up
Trigger: A genuine supply disruption materialises. Hormuz shipping is directly impacted, or IRGC actions damage production infrastructure.
Outcome: Crude spikes to $80 to $90+. Gold holds or accelerates as the disruption confirms the geopolitical thesis. Energy equities rally hard.
Probability: Lower, but higher-impact. The market is underpricing this tail risk.
Scenario B: Gold Corrects Lower
Trigger: Iran de-escalation combined with stronger-than-expected economic data. Risk appetite returns. Dollar stabilises.
Outcome: Gold pulls back to $3,900 to $4,000 range. Crude may stabilise or rise modestly. Equities rally as recession fears fade.
Probability: Requires two independent reversals simultaneously. Currently unlikely.
The critical observation is that Scenario B requires both geopolitical de-escalation and improving demand data. Scenario A only needs one trigger. That asymmetry makes gold continuation the higher-probability path unless two independent variables reverse at the same time.
Sector Impact: Where the Money Is Moving
Gold Miners: Double Tailwind
Producers like IAMGOLD, Barrick Gold, and Newmont are benefiting from an unusual alignment: record gold prices and sector rotation from risk assets into defensives. Margins expand as the gold price rises while input costs (fuel, dollar-denominated equipment) decline with crude and the dollar. This is as favourable an operating environment as gold miners get.
Smaller producers with high operating leverage to gold prices are seeing outsized moves. The sector is attracting institutional flows that typically go to tech or growth.
Energy: Geopolitical Premium Without Demand
Energy equities face a contradictory setup. The headlines scream supply risk, but the price action says demand destruction. Integrated majors with diversified revenue streams are faring better than pure-play upstream producers. Refiners face compressed margins as product demand weakens.
The energy sector is the one place where you can see the market explicitly choosing demand narrative over supply narrative in real time. Until crude reclaims $72 to $73 with conviction, the sector remains under pressure despite what the news flow suggests.
Broader Rotation: Defensives Over Cyclicals
The gold-crude divergence is consistent with a broader rotation into defensive assets. Utilities, healthcare, and consumer staples are relatively outperforming cyclicals like industrials, materials (ex-gold), and transport. This is not a risk-on market. Capital is repositioning for a slower second half, and the commodity complex is confirming it.
Q3 Watchlist: Triggers That Resolve This
| Catalyst | Direction | Impact |
|---|---|---|
| Hormuz shipping disruption | Crude up sharply | Closes divergence upward. Gold also accelerates. |
| Iran diplomatic resolution | Gold down modestly | Removes geopolitical premium. Gold finds support from other factors. |
| China PMI surprise (positive) | Crude up, gold flat | Demand fears ease. Crude retests $72 to $74. |
| Core PCE hot print | Gold down, DXY up | Rate cut expectations repriced. Gold corrects from $4,100+. |
| OPEC+ production increase | Crude down | Widens divergence. Recession thesis strengthens. |
| Fed dovish pivot signal | Gold up | Real rates fall further. Gold targets $4,200+. |
What This Means for Your Portfolio
The gold-crude divergence is not just an interesting chart pattern. It is a macro regime signal. Here is how to think about it across different timeframes:
Key Takeaways
- Gold bullish bias remains intact unless both Iran de-escalates AND demand data improves simultaneously. One without the other is insufficient to break the trend.
- Crude below $70 is a demand verdict, not a supply assessment. Treat energy exposure accordingly. The geopolitical premium that should be priced in is being overwhelmed by growth concerns.
- The dollar trend is accelerating both moves. DXY at 101.36 and falling supports gold, weakens crude in dollar terms, and signals broader de-dollarisation flows. Watch this closely.
- Gold miners offer leveraged upside with declining input costs. The double tailwind of higher gold prices and lower fuel/dollar costs is expanding margins.
- The tail risk is crude catching up, not gold falling back. If Hormuz shipping is directly disrupted, crude could gap $10 to $15 higher in a session. That is the risk the market is currently underpricing.
The Bottom Line
Q3 opens with the commodity complex sending a split signal. Gold says the world is unstable, the dollar is weakening, and central banks are preparing to ease. Crude says global demand is rolling over and even a hot war near the most important oil chokepoint on earth is not enough to change that.
Both of those things can be true at the same time. In fact, they reinforce each other. A slowing global economy with rising geopolitical risk is exactly the environment where gold outperforms and crude underperforms. That is not a contradiction. It is a diagnosis.
The divergence will resolve. The question is whether it resolves because the world gets more dangerous (crude catches up) or less fearful (gold pulls back). Right now, the weight of evidence points toward gold continuation. The demand destruction narrative is winning. And until the data changes that verdict, the gold-crude spread is likely to widen, not narrow.
This analysis reflects conditions as of market close 28 June 2026. All figures sourced from institutional-grade market data. This content is for informational and educational purposes only. It does not constitute financial advice, a recommendation, or a solicitation to trade. Past performance does not guarantee future results. Always conduct your own research and consult a qualified adviser before making investment decisions.
Institutional Research for Retail Traders
Sunday 28 Jun 2026
Crude Oil (WTI)
Daily Framework Read | Sunday 28 June 2026
Launch Edition
CONFIDENCE
Moderate
RISK FACTOR
7.4%
Framework Interpretation
Structure
Crude is in a decisive downtrend on the 390-minute timeframe. This is one of the cleaner structural reads in today’s commodity batch. Price has broken through multiple support levels with conviction, and the analysis reads the bigger picture as bearish. Each bounce has been sold into and the pattern of lower highs is well established. The mood is deteriorating.
Momentum
Unlike Gold and Silver, the momentum picture in Crude is more aligned with the structural read. The framework flags momentum as falling and the bigger picture as still rising only marginally, meaning the near-term trend is overriding. Everything is aligned in direction but the internal readings suggest some deceleration, so while the lean is clear the pace may slow.
Volume
Genuine demand has appeared at lower levels but sellers are stepping up with more conviction than in precious metals. The distribution pattern is more mature, and the analysis reads supply as outweighing demand on any relief rally. This is the type of volume profile that supports a trending move.
The Call
The analysis reads Crude Oil as a moderate-conviction short. Structure, momentum, and volume are more aligned than in precious metals, and the trend has been persistent. However, OPEC headline risk is ever-present and the weekend introduces gap risk. If you are short, the framework supports holding with stops above the nearest broken support. If flat, a bounce towards broken levels could offer a better risk-reward entry.
Key Levels
| Level | Price | Significance |
|---|---|---|
| Resistance 2 | 63.50 | Major breakdown level, heavy supply zone |
| Resistance 1 | 62.20 | Near-term overhead, broken support flipped resistance |
| Current Price | ~61.10 | Testing lower boundary of recent range |
| Support 1 | 60.40 | Near-term demand zone, prior swing low |
| Support 2 | 59.00 | Psychological round number and structural floor |
Risk Assessment
HIGH
OPEC headline risk + geopolitical supply disruption + extended downtrend
Crude carries structural headline risk that no chart can fully price. OPEC production decisions, Middle East tensions, and inventory data all create binary outcomes. The extended downtrend also means short positions are crowded, raising squeeze risk. The analysis reads the trend as intact but the risk of a violent reversal is always present in energy markets.
Scenario Analysis
Bull Case
15%
OPEC surprise cut or supply disruption drives gap above 63.50
Sideways
25%
Consolidation between 60.40 and 62.20 before next leg
Correction
50%
Trend continuation below 60.40, targeting sub-59 structural floor
Black Swan
10%
Major geopolitical escalation or emergency OPEC intervention
Position Sizing Guidance
Despite moderate conviction on the short side, the headline risk in Crude demands reduced sizing. The framework trend is clear but the potential for binary outcomes from OPEC or geopolitics means risk management takes priority over conviction. Scale in on bounces rather than chasing into the hole.
Experience-Level Guidance
Beginner
Crude Oil is one of the most headline-driven markets in the world. A tweet, a pipeline incident, or an OPEC decision can move it 5% in minutes. The downtrend is clear but the risk of a violent reversal is real. Observe from the sidelines and study how energy markets react to news flow. Do not short an extended move without understanding what drives reversals.
Intermediate
The trend is your friend until the headline hits. If you are looking for a short entry, a bounce towards 62.20 broken support offers better risk-reward than selling at current levels. Always use stops in Crude. The framework supports the bearish lean but the risk factor demands disciplined sizing.
Advanced
This is a trending market and the daily read supports continuation. Watch the 60 psychological level as a potential acceleration point. The deceleration in momentum suggests the move may pause before the next leg, offering a re-entry window. Keep an eye on inventory data and OPEC commentary. The crowded short thesis means any positive catalyst could trigger a sharp squeeze, so keep your stop discipline tight.
This content is for informational and educational purposes only. It does not constitute financial advice, investment recommendations, or a solicitation to trade. All trading involves risk. Past performance does not guarantee future results. Always conduct your own research and consult a qualified financial adviser before making investment decisions. Titan Protect is not responsible for any losses incurred from acting on this information.
Thursday 25 Jun 2026
Titan Commodities Desk · Daily Framework Read · Thursday 25 June 2026
Crude Oil (WTI): V-Bottom Recovery of 2.81% With Short Signal Still Active at 56% Confidence
Yesterday vs Today
| Signal | Short (Wednesday) | SHORT (Thursday) |
| Shift | Short signal maintained despite a 2.81% V-bottom recovery. The chart shows the framework is still reading short with 11 conditions matched. Structure is working against the bounce. Buyers are stepping in at lower levels but the overhead structure from the week’s decline remains broken. The V-bottom is a counter-trend move within a broader short framework. Partial exit territory flagged. | |
Daily Read
Crude Oil staged a dramatic 2.81% V-bottom recovery on Thursday, yet the framework still reads short at 56% confidence. This apparent contradiction is explained by structure: the bounce is happening within a broader broken-down chart. The trend line breaks to the downside from earlier in the week remain in place, and the V-bottom is testing those breakdown levels from below.
The chart tells a story of aggressive selling followed by a sharp counter-trend recovery. Multiple trend line breaks confirmed the downtrend. Then buyers stepped in at the channel floor, producing the V-bottom. But the framework notes that structure is working against the bounce. The sellers have not been defeated; they are waiting at the overhead levels created during the breakdown.
DXY weakness supports crude in dollar terms. Geopolitical tensions (if any) could provide a supply-side catalyst. But the demand picture, reflected in the Fear and Greed at 25.3 and the broader equity selloff, is weighing on crude’s outlook. Energy demand expectations decline when the economy is perceived to be weakening.
The V-bottom makes this partial-exit territory for shorts. The bounce was aggressive enough to signal genuine demand at lower levels. Chasing shorts into a V-bottom is a recipe for getting squeezed. The framework advises managing existing positions, not adding new ones.
Key Levels
| Level | Price | Significance |
|---|---|---|
| Resistance 2 | 72.50 | Prior breakdown zone, heavy overhead supply |
| Resistance 1 | 71.00 | Trend line cross from the breakdown |
| Current Zone | 69.50 – 70.50 | V-bottom recovery zone, short still active |
| Support 1 | 68.00 | V-bottom low, critical support |
| Support 2 | 65.50 | Channel floor, major demand zone |
Risk Assessment
Around 70%
Elevated risk. The V-bottom creates squeeze risk for shorts while the broken overhead structure limits upside for longs. This is a high-volatility environment for crude. Geopolitical headlines can move crude 3-5% intraday. Position sizing should be conservative.
What to Watch Today
- Whether the V-bottom holds above 68.00 or reverses
- EIA inventory data for supply-demand balance
- OPEC+ commentary or production signals
- DXY direction: continued weakness supports crude in dollar terms
- Geopolitical developments in the Middle East
This daily read is produced by the Titan Commodities Desk for educational and informational purposes only. It does not constitute financial advice or a recommendation to buy or sell any instrument. All levels and scenarios are analytical reference points, not trading instructions. Past performance of any level or scenario is not indicative of future results. Always apply your own risk management. Capital is at risk.
Wednesday 24 Jun 2026
Titan Commodities Desk | Daily Framework Read | 24 June 2026
Crude Oil (WTI): Structure Broken, Iran Supply Narrative Weighing
Spot: $71.64 | Day Change: -2.75% | Session: Pre-London
Daily Read
SHORT – Stop Under Protection
Structure is mixed. Risk appetite is fading broadly. The bigger picture is cautious, requiring careful navigation. Bearish structure backed by multiple broken levels. Market hasn’t shown its hand on whether this is a correction or a trend change.
Yesterday vs Today
Monday 23 June
Oil was already under pressure from the Iran MOU narrative. The supply side of the equation was shifting materially with Iranian barrels set to return to market. Day two of the broader risk selloff.
Tuesday 24 June
Day four of the rotation. Multiple lens levels broken to the downside. The chart shows a clear staircase lower with each support level failing in turn. Sellers are controlling the pace and direction.
The Read
Crude Oil is sitting at $71.64 and the chart tells a clear story. Multiple broken levels forming a staircase lower. The framework is reading this carefully because the bigger picture has two competing narratives, and Oil is caught between them.
The first narrative is supply. The Iran MOU has fundamentally shifted the supply outlook for the second half of the year. Iranian barrels returning to market means additional supply pressure at a time when OPEC+ is already managing a delicate balance. This is not a short-term noise story. It has legs and it will continue to weigh on pricing until the market absorbs the additional volume.
The second narrative is demand. The broader risk-off rotation, now in its fourth day, is raising questions about the demand side too. When equities sell off this aggressively and the VIX pushes above 20, it typically reflects a deterioration in growth expectations. Lower growth expectations mean lower oil demand expectations. Supply up, demand down, is the worst combination for any commodity.
The chart itself shows clear broken structure. The lens levels have been broken in sequence, each one giving way to the next lower target. The trend line breaks are visible and confirmed. What is notable is the clean nature of the decline. This is not chaotic selling. It is orderly, structured, and methodical. That typically indicates institutional selling rather than retail panic.
The right-hand panel flags that momentum is aligned to the downside. Sit down and keep stops tight. The framework is advising against trying to catch a falling knife here. Instead, the approach is to trail stops on existing shorts and wait for the market to show a structural reversal before considering any long positions.
The $71.00 level becomes the next test. If it gives way, the move could extend toward $69.50 to $70.00. However, at these levels, OPEC+ rhetoric tends to increase, and any headlines about production cuts could trigger a sharp squeeze. That is the tail risk to manage on the short side.
Key Levels
| Level | Price | Significance |
|---|---|---|
| Resistance | $73.50 | Broken lens level, overhead supply |
| Resistance | $72.40 | Prior broken support, near-term sell zone |
| Current Price | $71.64 | Below broken structure, bearish |
| Support | $71.00 | Round number, next meaningful test |
| Support | $69.50–$70.00 | Prior consolidation base, OPEC+ rhetoric zone |
Downside Risk
Around 60%
Supply narrative + demand fear + broken structure
Reversal Risk
Around 40%
OPEC+ rhetoric, geopolitical wildcards, oversold bounce
Scenario Analysis
Bear Case (Primary – Around 50%)
Oil breaks $71.00 and extends toward the $69.50–$70.00 cluster. Iran supply fears intensify, risk-off broadens, and demand fears build. OPEC+ rhetoric is insufficient to halt the decline.
Base Case (Around 30%)
Oil holds above $71.00 and consolidates in a $71.00–$72.40 range. Selling pressure eases but buyers lack conviction. Choppy, directionless trading into the end of the week.
Bull Case (Around 20%)
OPEC+ signals emergency cuts or the Iran deal encounters obstacles. Shorts scramble to cover and Oil squeezes back above $73.00. Requires a catalyst shift in the supply narrative.
What to Watch Today
- ►Whether $71.00 holds as a floor into the US session
- ►Any OPEC+ commentary on production levels or emergency measures
- ►EIA inventory data expectations building into Wednesday release
- ►Iran MOU implementation headlines for supply timeline clarity
This daily read is produced by the Titan Commodities Desk for informational and analytical purposes only. It does not constitute financial advice or a recommendation to buy or sell any financial instrument. Markets can move against any framework. Always apply your own risk management. Capital is at risk. Titan Protect Limited.
Tuesday 23 Jun 2026
Titan Macro Desk | Daily Framework Read | 23 June 2026
Crude Oil (WTI): Iran Supply Returns, $72 in Sight
Spot: $73.82 | Iran MOU In Force | Day 2 of Selling
Framework Read
BEARISH – Supply Shock Incoming
The Iran MOU is in force and Iranian barrels are returning to the market. Day two of the selloff continues. $72 is a realistic target this session.
The Read
Crude at $73.82 and the direction is clearly lower. This is not a complicated read. The Iran MOU entered into force and Iranian supply is coming back to the global market. When that much supply returns, the price adjusts. Monday saw crude drop 2.5%. Tuesday is day two and the selling is continuing through the Asian and European sessions.
The Iran situation is the dominant narrative. Prior to the MOU, markets had built a risk premium into crude pricing that reflected Hormuz tension, potential supply disruption, and escalation uncertainty. That entire premium is now being taken out systematically. The question is not whether crude falls further but how fast and how much of the premium has already been removed.
Iranian barrels coming back to the market also coincides with OPEC+ already managing a production increase cycle. The combination of returning Iranian supply and an OPEC production ramp creates a scenario where the market has to absorb meaningfully more barrels over the coming weeks. This is not a one-day event. The supply story has legs.
Demand side is not helping either. NAS futures down 2.5%, Nikkei down 3.0%, and a broadly risk-off tone all point to growth deceleration concerns. Crude demand correlates with economic activity, and markets that are selling growth assets are also marking down crude demand expectations implicitly.
The $72 target is not arbitrary. It represents the level crude was trading at before the Iran escalation created the risk premium. A full unwind of the premium takes you back toward that zone. Depending on how aggressively Iranian supply comes back and whether the OPEC response is slow or fast, there is a path to $70 if the market gets impatient.
The only things that could interrupt the selloff at this point: an unexpected OPEC+ emergency cut announcement, a major geopolitical surprise in another oil-producing region, or a much faster-than-expected demand recovery signal from China. None of those are on the immediate horizon based on current information.
Energy stocks in the equity market will also be watching this closely. An extended crude move toward $72 puts pressure on E&P names and refinery margins. That feeds back into broader equity sector dynamics and can amplify the risk-off read in the indices.
Key Levels
| Level | Price | Significance |
|---|---|---|
| Resistance | $75.50–$76.00 | Pre-MOU premium zone, sellers likely at every bounce |
| Current Price | $73.82 | Day two of selling, trending lower |
| Target / Support | $72.00 | Pre-escalation level, full risk premium unwind |
| Extended Target | $70.00 | If Iranian ramp is faster than expected or OPEC slow to respond |
| Bounce Level | $73.00 | Round number intraday watch, short-term demand area |
Downside Risk
Around 75%
Supply structural shift plus demand concern
Reversal Risk
Around 25%
OPEC emergency cut or geopolitical surprise required
Scenario Analysis
Bear Case (Primary – Around 65%)
Selling extends through $73.00 and tests $72.00 into the New York session. Energy equity names follow, adding to the broader equity selloff. Any OPEC comment about supporting prices is dismissed as insufficient. $70 becomes the medium-term target.
Base Case (Around 25%)
Crude holds $73.00–$73.50 intraday as short-term buyers absorb the selling. Bounces are capped at $74.50. Market waits for inventory data and OPEC signals before the next directional move. Settles around $72.50–$73.50.
Bull Case (Around 10%)
Unexpected OPEC emergency statement or production cut announcement. Iran deal hits a legal obstacle delaying the supply return. Either event triggers a sharp short-squeeze back toward $75.00+. Very low probability given current information.
This framework read is produced by the Titan Macro Desk for informational and analytical purposes only. It does not constitute financial advice or a recommendation to buy or sell any financial instrument. Markets can move against any framework. Always apply your own risk management. Capital is at risk. Titan Protect Limited.
Monday 22 Jun 2026
Crude Oil (WTI) Daily Ticker Read: Hormuz Has The Wheel — This Is Not A Normal Open
Daily Ticker Read | Monday 22 June 2026
Crude oil opened Sunday up 1.2 percent on the Hormuz headline before settling Monday at $75.62 — essentially flat against Thursday’s close of $75.63. The Sunday gap-open was the market telling you exactly what it thinks about a contested Hormuz strait: higher oil prices, fast. The Monday flat settle tells you the market is also uncertain about whether the Sunday open’s assumptions hold through the week. Iran says the strait is closed. CENTCOM says 55 ships transited over the weekend. Both things cannot be fully true. And that uncertainty — is oil supply genuinely restricted or isn’t it? — is what has crude sitting at $75.62 rather than $80 or $70.
Where Oil Sits
WTI Crude $75.62. Thursday close $75.63. Flat on the day after a Sunday open that was up 1.2 percent. The round-trip from Sunday’s premium back to Thursday’s price in one session is the market processing conflicting information in real time. It gapped up on fear, then gave back the premium once CENTCOM confirmed ongoing transit. That is a rational pricing sequence.
The Brent-WTI spread is relevant here. If Hormuz is genuinely constrained, Brent should carry a larger premium than WTI because Brent prices the global seaborne market where Middle Eastern crude flows. A widening Brent-WTI spread would confirm physical market tightness. A flat or narrowing spread would suggest the market is pricing this as a news event rather than a supply disruption. Watch that spread through Monday’s session as a real-time read on how physical traders are interpreting the Hormuz situation versus how financial markets are.
Switzerland talks stalling removes one of the cleaner diplomatic pathways to de-escalation. The Iran-related tensions are not exclusively about Hormuz — they connect to a broader set of issues where Switzerland has historically played a facilitating role. If that channel is closed for now, the market needs to assign a higher probability to the Hormuz situation continuing unresolved into next week and beyond. That is a floor for oil prices even if the news-driven premium has been traded away this Monday.
SNAPSHOT — MONDAY 22 JUNE 2026
| Crude Oil WTI | $75.62 |
| Thursday close | $75.63 |
| Session move | Flat (-$0.01) |
| Sunday open gap | +1.2% |
| Key driver | Hormuz — contested |
Three Levels That Decide The Week
Support: $73.50. This is the pre-Hormuz-escalation baseline where oil was trading before the strait dispute heated up. A return to $73.50 would represent the market fully pricing out the geopolitical premium and treating the situation as resolved. Only relevant as a bear scenario target, not a likely baseline. The Swiss talks stalling makes this level less likely to print this week.
Pivot: $76.00 to $77.00. This is where oil needs to establish itself to confirm the geopolitical floor is holding at an elevated level. A close above $77 would represent the market accepting that the Hormuz premium is structural for this week rather than a one-session event. The pivot band is the line between “news trade” and “thesis trade.”
Extension: $80.00. This is the round number psychological target that becomes relevant on any meaningful escalation. If Iran takes a concrete action beyond statements — actual ship interdiction, mine deployment, or military confrontation — oil prints $80 in a session. The $80 level is the market’s binary risk premium ceiling where the situation moves from contested to actively dangerous. It does not require a disruption to happen, just a credible threat of one.
Bullish Setup: Hormuz Premium Re-Prices Higher
Lean Bullish: Flat Monday After Sunday Premium Is Accumulation, Not Rejection
Risk score: around 55 percent
Entry: $75.20 to $75.80 on Monday consolidation. Stop: $73.20 daily close. Target one: $77.50. Target two: $80.00. Risk to reward: roughly 1:1.5 on T1, 1:2.3 on T2.
Why it works: Oil giving back the Sunday gap in Monday’s session while the situation on the ground remains unresolved is a classic false pullback setup. The market priced in the fear, tested whether sellers could press lower, and found buyers at essentially Thursday’s level. That is a healthy consolidation of a news-driven move, not a failure. The Swiss talks stalling adds a week or more of timeline for this to stay in the news. Kill condition: CENTCOM confirms consistent 100 percent normal transit for 72 hours straight. Full passage confirmation removes the core premise.
Bearish Setup: Premium Traded Out, Demand Side Weakens
Tactical Short: Geopolitical Premium Fades, OPEC+ Supply Hits
Risk score: around 35 percent
Entry: $76.50 to $77.00 on a push into resistance that fails. Stop: $78.20. Target one: $74.00. Target two: $72.00. Risk to reward: roughly 1:1.7 on T1, 1:3 on T2.
Why it works: If CENTCOM’s statement about 55 ships transiting is confirmed as ongoing normal operations, the geopolitical premium that was bought Sunday gets sold Tuesday. Add any OPEC+ supply increase news — which has been building in the background — and you have a clean double-pressure setup. Kill condition: Any concrete Iranian action on transit or a physical ship incident. Cover immediately on anything that confirms the strait is genuinely disrupted rather than disputed in statements.
The Hormuz Reality Check
Twenty percent of the world’s seaborne oil passes through the Strait of Hormuz. In round numbers, somewhere between 17 and 21 million barrels per day flow through that 21-mile-wide chokepoint at the entrance to the Persian Gulf. Saudi Arabia, Iraq, Kuwait, the UAE, and Bahrain all export the majority of their crude through the strait. Qatar’s LNG exports go through it too.
Iran saying the strait is closed and CENTCOM saying 55 ships transited are not necessarily contradictory in the technical sense — Iran may have declared a closure that it lacks the physical capacity to enforce against US Navy escorts. The 55 ships number matters because it tells you transit is still happening. What it does not tell you is whether that pace represents normal flow, reduced flow, or a brief burst before something changes.
Oil traders who understand the Hormuz dynamic know that even a partial disruption — slowing transit by 20 to 30 percent — would represent a supply shock significant enough to move prices materially higher. A full closure would be a once-in-a-generation event. The market right now is pricing something between “nothing happened” and “partial disruption risk” — which is exactly where $75.62 sits relative to where oil would be if the situation were fully resolved ($73 range) or if a physical closure was confirmed ($85 to $90 range).
OPEC+ in the Background
The Hormuz story is dominating headlines but the OPEC+ supply picture is the structural backdrop that frames where oil sits regardless of the geopolitical noise. OPEC+ has been managing production carefully through 2026. Any decision to increase output — or signals of member compliance breaking down — would add supply to a market already uncertain about demand forecasts given the global economic slowdown narrative.
The intersection of Hormuz uncertainty and OPEC+ supply management creates an interesting dynamic: if Hormuz headlines drive prices toward $80, some OPEC+ members who are compliance-constrained may see opportunity to quietly increase output to capture higher prices. That is the ceiling dynamic that prevents this from becoming a runaway move even if the geopolitical tension persists.
The floor dynamic is simpler: Switzerland talks stalling means the diplomatic channel is closed this week, and without diplomatic progress, Hormuz uncertainty stays elevated, and the minimum geopolitical premium embedded in oil is around $2 to $3 per barrel above where it would be in a neutral environment. That keeps $73 as a soft floor for this week.
Time Horizons
Intraday: The $74.80 to $76.20 band is Monday’s operative range. Within that, oil is consolidating a news-driven move. Watch the Brent-WTI spread as the real-time signal for physical market tightness. A widening spread through the day suggests physical traders see something financial traders don’t. A tightening spread means the market is treating this as a news event.
Swing (two to five days): The week’s direction hinges on whether Hormuz produces a follow-on headline by Tuesday or Wednesday. Diplomatic silence on Switzerland and continued “contested but not physically blocked” signals from CENTCOM keeps oil in the $74 to $78 range through the week. A physical incident — any kind — takes it higher fast.
Positional (two to eight weeks): The intersection of Hormuz, OPEC+ supply management, and the seasonal demand uptick heading into northern hemisphere summer consumption peaks creates a constructive medium-term backdrop for oil between $75 and $85. The lower end of that range holds as long as Hormuz remains unresolved. The upper end requires a physical supply event or a confirmed sustained transit disruption.
Risk Score
Crude oil risk score: around 60 percent.
- Plus 25 percent for Hormuz being the dominant driver and completely binary in outcome
- Plus 15 percent for conflicting Iran vs CENTCOM statements creating maximum uncertainty
- Plus 15 percent for Switzerland talks stalling removing near-term de-escalation catalyst
- Minus 20 percent for 55 ships transiting showing the strait is not physically closed right now
- Minus 10 percent for the Sunday gap round-trip suggesting news premium was already absorbed once
- Plus 15 percent for the asymmetric nature of a physical Hormuz event — more upside potential than downside risk from current levels
Crude is the highest-risk instrument in the commodities complex this week. The Hormuz binary means any position can be validated or destroyed by a single headline. Size accounts for that.
What We Called vs What Happened
| Call (Thursday 19 Jun) | Outcome (by Monday 22 Jun) | Verdict |
|---|---|---|
| Hormuz headline risk keeps oil in elevated range over weekend. | Sunday gap-open +1.2 percent confirmed the call. Oil did not sleep through the news. | Confirmed |
| $75 to $76 as the contested range for the week open. | Monday settle at $75.62 — right in the middle of the predicted range. | Confirmed |
| $80 extension requires physical incident, not just statements. | No physical incident over weekend — $80 not reached. Extension thesis still valid. | Confirmed |
| Swiss talks failure adds a week of Hormuz premium life. | Stalled Switzerland talks confirmed — premium stays embedded for the week. | Confirmed |
Oil is driving the macro narrative this week more than any other single instrument. The Hormuz situation is not resolved, the diplomatic channel is stalled, and every morning brings a new set of statements that the market has to price. That is a high-velocity news environment. Keep positions sized for binary outcomes and let the market tell you which direction before adding.
Titan Macro Desk — Daily Ticker Read. This is analysis, not financial advice. All positions carry risk. Manage size accordingly.
Thursday 18 Jun 2026
Crude Oil WTI — Daily Framework Read | Thursday 18 June 2026
Daily Ticker Read | Thursday 18 June 2026
Crude Oil WTI closed at $75.63, down 1.51 percent. The Iran peace deal signing today removes the supply disruption risk premium that had been priced in for the past several months. The move is relatively contained compared to Gold and Silver, which is itself a message: the market had already been pricing out some of this risk in prior sessions. The framework is bearish, but this is not a runaway collapse. This is a deliberate repricing.
Where Crude Sits
WTI Crude Oil closed Thursday at $75.63, down $1.16 or 1.51 percent. Yesterday’s close was $75.41, itself down 0.84 percent. That creates an interesting pattern: today is actually a larger percentage decline than yesterday, but the two sessions together represent a modest total decline compared to what Gold and Silver experienced. The message in that relative reading is that Crude had already been drifting lower through OPEC supply decisions and macro demand concerns before the Iran catalyst arrived today.
Today’s chart shows a clearly bearish framework configuration. Multiple “the structural lens broken down” annotations appear across the session, with the short-side reads building through the afternoon. The the framework panel’s upper-right commentary references a bearish alignment with structure and momentum both pointing lower. There is a noted “sell zone” or supply zone above current price, and the the framework makes reference to the short case being the edge with a “test of supply” framing. The chart confirms price is sitting below the key structure, not above it.
The Crude chart has an additional dimension that the metals do not. The “WTICRUDE” label on the price axis is visible at the $390 level on the 390-minute chart, which means the read is taking in multi-session context. The cascade of lens failures from the prior session through today shows a consistent structure: price is below the key moving averages, below the broken support levels, and each bounce attempt is being sold.
Yesterday’s chart showed the same cascade pattern beginning, with the the structural lens broken down labels emerging mid-session. The the framework panel yesterday was more ambiguous than today, with references to “partial exit” and monitoring, suggesting yesterday was where the lens first broke but conviction was building rather than confirmed. Today’s chart shows the full confirmation.
Yesterday vs Today
| Session | Close | Move | Daily Read |
|---|---|---|---|
| Wednesday 17 Jun | $75.41 | -0.84% | Short forming, lens breaking, partial exit reads |
| Thursday 18 Jun | $75.63 | -1.51% | Short confirmed, all lenses broken down, sell zone above |
One observation worth noting: today’s close of $75.63 is actually marginally above yesterday’s close of $75.41. The percentages are measured from different opening prices, so today’s session opened higher and still closed lower on the day. That means the session itself was bearish, but the overnight recovery brought price back above the prior close before selling resumed. That intraday pattern, higher open then lower close, is typical of distribution rather than capitulation.
Distribution means sellers are using bounces to offload, not panic-selling. That tends to produce a slower, more grinding decline rather than a sharp crash. The Crude setup is more of a controlled drift lower than the Silver session, which was a genuine panic.
Key Levels
Resistance: $77.00 to $77.50. The supply zone noted on the chart, where sellers have been active. This is the bounce-fade target for the short thesis. Above $77.50 on a daily close with volume would begin to challenge the bearish lens configuration.
Decision zone: $75.40 to $75.70. Current trading range from the past two sessions. This is tight consolidation. A break either side of this range with follow-through sets the near-term direction. Below $75.00 on the open opens the $73.50 support quickly given the absence of meaningful structure between.
Support: $73.50. The next meaningful level below current price where structure exists. The chart shows a horizontal zone around this area. A test of $73.50 would be the first genuine buying opportunity since the Iran catalyst hit.
Key support: $72.00. Below $73.50, the next magnet is the $72.00 area, which was a significant consolidation zone earlier in 2026. A breach here would represent a meaningful structural breakdown for Crude and would trigger re-evaluation of the positional view.
Long Bias Setup
Support Long: Buy The Test of $73.50 With Confirmation
Risk score: around 65%
Entry: $73.50 to $74.00 on a reversal candle after a test of the support zone. Requires a bullish close off the level, not a limit order into the move. Stop: $72.30 (below the support zone and the next meaningful structure). Target one: $75.60 (return to current close level). Target two: $77.00. Risk to reward: roughly 1:1.8 to first target, 1:3.1 to second target.
Why it works: Crude’s decline is more measured than the precious metals complex. The Iran deal removes the risk premium but does not destroy the underlying supply-demand equation. OPEC cuts and genuine demand from Asia remain as floor mechanisms. At $73.50 structural support with a reversal candle, the risk-reward becomes acceptable for a counter-trend bounce. Kill condition: daily close below $72.50. Below there, the structural argument is gone.
Short Bias Setup
Distribution Short: Fade The Push Into $77.00 to $77.50
Risk score: around 55%
Entry: $77.00 to $77.50 on a wick rejection or bearish engulfing candle on the 390-minute chart. The framework sell zone aligns with this level. Stop: $78.20 (above the supply zone and any reasonable continuation target). Target one: $75.40. Target two: $73.50. Risk to reward: roughly 1:2.1 to first target, 1:4.5 to second target.
Why it works: The framework is aligned short. The sell zone is defined. Iran deal removes supply disruption risk. OPEC production increases are a potential additional headwind if they materialise in the next few weeks. The risk-reward at $77.00 is clean with a tight stop above. Kill condition: clean close above $78.50 with bullish momentum. That would invalidate the bearish thesis and suggest a false breakdown.
Time Horizons
Intraday (zero to one day): The $75.00 round number is the key intraday pivot for Friday. Above it, any move back toward $76.00 to $76.50 faces overhead supply. Below $75.00, the next magnet is $74.20 to $74.50. Crude tends to hold round numbers intraday before breaking, so $75.00 is likely to be tested in the morning session before direction is established. Watch the dollar index as the primary confirmation: if DXY is still bid, Crude stays under pressure.
Swing (two to ten days): The base case for the next one to two weeks is a drift toward $73.50 with occasional bounces that fail at $76.50 to $77.00. The Iran deal is now priced but the consequences take time to manifest in actual supply data. The forward curve is worth watching: if the front month weakens relative to later dated contracts (contango widening), that signals traders expect more supply coming, which is additional pressure. Short from $77.00 targeting $73.50 is the swing setup.
Positional (two to eight weeks): The positional picture for Crude is more complicated than the short-term read. The Iran deal removes a risk premium, but genuine geopolitical risks remain elsewhere. OPEC’s compliance and Asian demand growth are the two variables that determine whether $70.00 becomes a genuine test or whether Crude stabilises around $73.00 to $76.00. A positional short targeting $70.00 requires OPEC to increase production meaningfully and Asian demand to disappoint. Those are binary outcomes at this stage, not base case.
Risk Score
Crude Oil risk score: around 62 percent.
- Plus 20 percent for Iran deal removing the supply disruption risk premium
- Plus 15 percent for framework aligned short with all lens configurations bearish
- Plus 15 percent for dollar strength acting as a direct headwind on USD-priced commodity
- Plus 12 percent for distribution pattern (higher opens selling off) suggesting organised selling
- Minus 15 percent because the two-session decline is measured, suggesting the risk premium was partially priced before today
- Minus 10 percent because OPEC’s actual production response is unknown, and any surprise cut would rapidly reverse the thesis
- Plus 5 percent for VIX collapsing 9.3%, removing the macro fear that sometimes supports oil on flight-to-safety reads
Moderate-high risk. The cleanest trades are defined setups at levels ($77.00 for short, $73.50 for long) rather than entries at current price. Watch for OPEC communication next week as the primary catalyst that could rapidly shift the picture.
Scenarios (Sum to 100%)
| Scenario | Trigger | Target | Probability |
|---|---|---|---|
| Continued distribution lower | Dollar holds, OPEC silent, Iran deal confirmed stable | $73.50 then $72.00 | 40% |
| Range consolidation | Mixed signals, price holds $75.00 to $77.00 for several sessions | $75.00-$77.00 range | 35% |
| OPEC surprise recovery | OPEC announces cuts, Asian demand data strong | $78.00 to $80.00 | 18% |
| Deal collapse shock | Iran deal breaks down, military risk resurfaces | $82.00 plus rapid | 7% |
Position Sizing
A risk score of 62 percent puts Crude in the moderate-high category. It is not the highest risk read today (Silver takes that) but it is not a low-conviction environment either. The framework is clear on direction but the magnitude of the move is uncertain.
For the short trade at $77.00 to $77.50, 70 to 75 percent of normal commodity allocation is appropriate given the defined stop at $78.20. The setup has a clean trigger (rejection at the sell zone), a defined stop, and meaningful targets. That is the kind of setup that warrants standard positioning.
For the long trade at $73.50, reduce to 50 to 60 percent of normal. The counter-trend risk is real, and the OPEC variable means a long in Crude can lose quickly if production surprises to the upside. Confirmation-only entry applies here: no anticipatory buying into the level without a reversal candle.
Current positioning at $75.63 close: no new trades at this level. The setup zones are at $77.00 and $73.50. Between those two, this is a watch-and-wait session.
The Iran Deal and What It Actually Means for Oil
The market has been pricing Iranian supply disruption risk since tensions escalated through late 2025. That risk premium was never enormous in absolute terms, perhaps $3.00 to $5.00 per barrel, but it was consistent and it provided a floor at various levels. Today’s signing removes the formal justification for that premium.
What does not change: Iran’s actual production levels will take time to normalise even if sanctions are formally eased. The pipeline from deal to barrels on the market is measured in months, not days. That means the fundamental supply picture does not shift tomorrow, even though the price signal is moving today. Markets are pricing the future state, not the current one.
This creates a potential asymmetry over the next six to eight weeks: if the deal takes longer than expected to translate into actual supply increases, the initial overshooting of the price decline could reverse as the market recalibrates. That is not today’s trade. But it is the context for any positional long consideration around $72.00 to $73.00 if the market continues lower.
This is analysis, not financial advice. Always manage your risk.
Thursday 18 Jun 2026
Titan Macro Desk
Crude Oil (WTI) — Daily Framework Read
Thursday 18 June 2026 | Closing price: $74.14 | Change: -3.45%
Session Snapshot
Close
$74.14
Daily Change
-3.45%
Bias
Bearish Short-Term
Framework Read
Crude had its worst single session in weeks. The headline driver was the Iran nuclear deal news — specifically reports that a $300 billion sovereign fund disbursement was attached to the framework agreement, which the market interpreted as a signal that Iranian oil supply is about to return to global markets in size. That single narrative was enough to override everything else happening in the session.
The structure of the move is worth noting. WTI was trading around $76.70 at the start of the session. The selloff was not a slow grind — it accelerated as the day wore on, suggesting algorithmic selling was triggered at technical levels. The $75 handle, which had been defended repeatedly over the past three weeks, broke cleanly and the market found no meaningful bid until the $74 area. That prior support zone at $75 is now resistance.
The bigger picture question is how much Iranian supply is actually priced in. The market has been aware of deal discussions for months, and some analysts have argued that Iranian barrels were already finding their way into the system through informal channels. If the formal deal simply legitimises existing flows rather than adds new supply, the initial selloff may be overdone. That is a mean-reversion argument, and it requires patience — these geopolitical repricing events tend to overshoot before finding equilibrium.
OPEC+ is the swing factor. Any hint of a production cut in response to the Iranian supply increase would change the calculus quickly. The next scheduled OPEC+ meeting is the key watch event. Until then, the path of least resistance for crude is lower.
Yesterday vs Today
| Factor | Wednesday | Thursday |
|---|---|---|
| Supply narrative | Iran talks, no deal | Deal + $300B fund reported |
| $75 support | Holding | Broken — now resistance |
| Algo flow | Mixed | Accelerating sell-side |
| Energy equities | Stable | XLE under pressure |
Key Levels
Support
$72.50 — Prior swing low
$70.00 — Psychological / major
$68.00 — Demand zone, 2025 base
Resistance
$75.00 — Broken support, now resistance
$76.50 — Pre-breakdown level
$78.00 — Weekly resistance
What to Watch Tomorrow
Any detail on Iranian supply timelines is the key overnight read. If analysts start running scenarios on how quickly Iranian barrels enter the market, that will set the tone for Friday’s open. A figure of 500,000 barrels per day or more would reinforce the bearish case. Anything below 300,000 and the market may interpret the deal as less impactful than today’s reaction implied.
Also watch the Baker Hughes rig count on Friday afternoon — in the current environment, any uptick in US shale activity would compound the supply-side narrative. The $72.50 area is the next meaningful test below. Failure there opens $70.
Current Bias
Bearish Short-Term — Supply narrative dominates
The $75 break is significant. That level held multiple times over recent weeks. A clean break and close below it, with accelerating sell-side momentum, is a framework signal — not noise. The Iran deal has changed the supply calculus. The key question is whether $72.50 holds. OPEC+ response timing is the only thing that can meaningfully shift this read back to neutral.
This framework read is produced by the Titan Macro Desk for informational and educational purposes only. It does not constitute financial advice, a recommendation to buy or sell, or a solicitation of any investment decision. All market analysis involves judgement and uncertainty. Capital is at risk. Seek independent financial advice before making any investment decisions. For members only — not for redistribution.
Wednesday 17 Jun 2026
Titan Macro Desk · Post-Close · Wednesday 17 June 2026
Crude Oil (WTI) — FOMC Day Framework Read
Oil sits at $75.41. The Iran deal is the biggest variable in the entire oil market right now.
Close
$75.41
Key Catalyst
Iran Deal Thu
Dollar Impact
Headwind
OPEC Watch
Supply Control
Context: Oil is caught between two powerful forces: a hawkish Fed pushing the dollar higher (bearish for dollar-denominated commodities) and a potential Iran deal that could bring significant additional supply to the market. At $75.41, crude is reflecting both of those uncertainties. The Iran deal is the wildcard that the market has been pricing intermittently for months.
Our Framework Read
Bias
Cautious Bearish
Key Risk
Iran Supply Return
Floor
OPEC Discipline
$75.41 on crude oil is a level that reflects significant supply discipline by OPEC+ combined with reasonable global demand. At this price, most OPEC members are covering their fiscal budgets. It is a managed price, not a freely discovered market price — and that management has held impressively for the past two years.
The Iran deal Thursday is the potential disruption to this managed equilibrium. Iran currently exports approximately 1.5–2 million barrels per day under various sanction-evading arrangements, primarily to China. A formal deal with full sanctions relief could eventually add a further 500,000–1 million barrels per day to the formal market. That is not trivial for the oil balance.
But — and this is important — OPEC has proven its willingness and ability to cut production to defend prices. If Iran returns to full export capacity, the most likely OPEC response is proportional production cuts from Saudi Arabia and UAE. The price impact of the Iran deal is therefore more muted than the headline might suggest, because it does not necessarily increase total supply.
The dollar side of the equation adds pressure independently. Dollar-denominated commodities get more expensive for non-US buyers when DXY rises. That can suppress demand on the margin. Our read: crude oil is in a range-bound, slightly bearish mode near-term. $72–$78 is the range to watch.
Key Levels
| Level | Price | Context |
|---|---|---|
| Support S1 | $72.00 | OPEC fiscal floor zone, buyers historically appear here |
| Support S2 | $68.00 | Would likely trigger OPEC emergency cut discussion |
| Resistance R1 | $78.00 | Prior range high, supply emerges here |
| Resistance R2 | $83.00 | Would require geopolitical escalation or demand surge |
Risk Assessment
Around 55% risk
Moderate-elevated. The Iran deal headline risk is real and could produce a sharp intraday move on confirmation. The OPEC floor is also real. The range ($72–$78) is likely to hold unless either the deal collapses entirely (bullish for oil) or OPEC signals it will not respond to Iranian supply return (bearish).
This post is produced by the Titan Macro Desk for informational and educational purposes only. Nothing here constitutes financial advice. Capital is at risk.
Wednesday 17 Jun 2026
Titan Macro Desk · Post-Close · 16 June 2026
Crude Oil (WTI) — Daily Framework Read
Tuesday 16 June 2026 | FOMC Eve
Session Summary
Framework Read
Bias
NEUTRAL / GEOPOLITICAL FLOOR
Framework State
WATCHING
Supply Risk
IRAN FACTOR
OPEC+ Stance
SUPPORTIVE
Our Read
Crude oil at $80.89 flat is interesting in context. With equities selling off and risk appetite contracting, you might expect crude to fall — lower growth expectations mean lower demand expectations. But crude held. That suggests there is a supply-side floor in the market that is absorbing the demand-side concern.
The Iran context is relevant here. Iran is a significant oil producer, and any escalation in Middle East tensions — whether directly involving Iran or through proxy conflicts — creates a supply disruption premium in the crude price. That geopolitical floor is keeping crude above where fundamental demand signals alone would push it.
OPEC+ remains the dominant price-setting force. The cartel has been disciplined in managing supply cuts, and Saudi Arabia in particular has shown willingness to take unilateral cuts to defend price levels. The current output arrangement provides a floor around $75-80 for WTI from a supply management perspective.
The FOMC wildcard for crude is the dollar. A weaker dollar from a dovish Fed would provide a tailwind for crude prices (oil is priced in USD — cheaper dollars means higher USD-denominated oil prices). A stronger dollar scenario would put mild downward pressure on the crude price in USD terms, even if the supply/demand balance is neutral.
Framework: WATCHING. Crude is in a range defined by geopolitical floor and demand ceiling. $80.89 is the current midpoint of that range.
Key Levels
| Level | Price | Significance |
|---|---|---|
| Resistance | $85.00 | Demand ceiling — geopolitical spike level |
| Resistance | $83.00 | Near-term overhead |
| Current / Flat | $80.89 | Midpoint of geopolitical/demand range |
| Support | $78.00 | OPEC+ implied floor zone |
| Support | $75.00 | OPEC+ production cut trigger level |
Risk Assessment
Around 50%
- Supply floor from OPEC+ management — downside limited
- Iran geopolitical premium supports current price
- Demand ceiling from growth slowdown concerns
- Dollar direction post-FOMC creates USD translation effect
This framework read is produced by the Titan Macro Desk for analytical and educational purposes only. It does not constitute financial advice or a recommendation to buy or sell any instrument. All market analysis involves uncertainty. Past framework accuracy does not guarantee future performance. Conduct your own research and consult a qualified financial adviser before making investment decisions. Capital is at risk.
Tuesday 16 Jun 2026
Titan Macro Desk · Tuesday 16 June 2026
Crude Oil (WTI) — Daily Framework Read
Instrument Deep Dive · Commodity Series
Live Snapshot · As of Market Open
Last Price
$80.89
Session Range
$80.84 – $81.58
Bias
NEUTRAL / WATCH
Our Read
Thursday could be one of the most significant single-day catalysts crude oil has seen in years. The Iran peace deal signing is a binary event — and the market is sitting on it.
WTI at $80.89 is not moving because nobody wants to be wrong-footed. The Iran deal — if it holds and is signed Thursday — means Iranian crude returns to the market in volume. The narrative is straightforward: more supply without a proportional demand increase is bearish for price. That logic is already understood by every oil trader in the world.
So why is oil holding at $80.89? Because the market does not fully trust the deal yet. Every geopolitical “resolution” in this region has a history of unravelling. Traders who sell today and the deal collapses Wednesday night are sitting on a painful short squeeze. So the professional money is waiting — not because they disagree with the bearish thesis, but because they are waiting for confirmation before committing size.
That is why the range is tight. The price action is not confusion — it is patience. And it is about to end on Thursday.
Binary Event Alert — Thursday 18 June
Iran peace deal signing is scheduled for Thursday. This is the single most important variable for crude oil this week — more important than FOMC for this specific instrument. Here is how we frame the two outcomes:
Deal Signed (Bearish)
Iranian exports ramp over 3–6 months. OPEC+ faces pressure to compensate. Initial reaction: oil tests $78–$79 zone. If deal holds over weeks, $75 becomes realistic.
Probability: ~65%
Deal Collapses (Bullish)
Geopolitical risk premium snaps back. Supply fears return. Initial reaction: oil bounces to $83–$85 quickly. Short squeeze accelerates the move.
Probability: ~35%
Key Levels
| Level | Price | Context |
|---|---|---|
| Resistance 2 | $85.00 | Deal collapse target — short squeeze territory. |
| Resistance 1 | $83.00 – $83.50 | Immediate supply zone. Prior high this month. |
| Session High | $81.58 | Top of current compression band. |
| Current Price | $80.89 | Mid-range. Neutral. Pre-event holding pattern. |
| Support 1 | $80.84 | Session low. Immediate support. |
| Support 2 | $78.50 – $79.00 | Deal signed initial target. Key demand zone. |
| Major Support | $75.00 | Extended bearish scenario — Iran ramp-up confirmed. |
The OPEC+ Layer
Here is something the headline narrative glosses over: OPEC+ does not want oil at $75. Saudi Arabia needs oil above $80 to balance its budget. If Iranian supply hits the market in volume, there will be pressure on the cartel to cut output to compensate. That is not automatic — it requires negotiation and political will — but it is a counterweight to the bearish supply argument.
The bear case requires you to believe both that the Iran deal holds and that OPEC+ does nothing. That is two assumptions. Our read is that the market will price the initial bearish reaction on deal signing, but the actual move lower will be slower and shallower than the initial pop suggests — precisely because OPEC+ will start talking about cuts within days.
This is why we are cautious about chasing a big directional trade into Thursday. The initial move may be a fade opportunity rather than a trend entry. Watch how the market behaves in the 24 hours after the signing before committing to a multi-day position.
Risk Assessment
Event Risk
EXTREME
FOMC Wed + Iran signing Thu.
Directional Confidence
Low
Binary outcomes, both meaningful.
Today’s Framework
WAIT
No edge inside compression.
Key risk factors this week:
- Iran deal signed cleanly — initial drop to $78.50. Watch for OPEC+ response before extending short.
- Deal collapses — oil gaps to $83+. Shorts caught badly. Do not chase — wait for stabilisation.
- Hawkish FOMC + deal signed — double bearish catalyst. $75 becomes the medium-term target.
- Dovish FOMC + deal collapses — confused market. Oil bounces but macro uncertainty limits upside.
Strategy Tiers
| Scenario | Trigger | Initial Target | Approach |
|---|---|---|---|
| Deal signed, bearish | Close below $80.84 Thursday | $78.50 | Wait 24h for OPEC+ response before extending |
| Deal collapses, bullish | Failure above $80.84 confirmed | $83.00 | Momentum trade — tight stop, fast target |
| Today — Neutral | Inside $80.84–$81.58 | No target | Wait for binary resolution |
Cross-Reference: Alpha Insights
Our Iran tracker has been monitoring the deal timeline since the escalation phase began. The session brief published pre-London today carries the latest geopolitical read alongside crude’s macro context. Members receive this 24 hours ahead of public release. The commodity complex view — including the interaction between crude, gold, and natural gas — is covered in the full daily pipeline.
Titan Macro Desk recommendation: do not trade crude this week without reading the Thursday post-event note. We will publish an immediate reaction read once the Iran deal outcome is confirmed.
Disclaimer
This content is produced by the Titan Macro Desk for educational and informational purposes only. It does not constitute financial advice, a recommendation to buy or sell any instrument, or a solicitation to trade. All views represent our analytical read at the time of publication and may change without notice. Past performance and historical analysis do not guarantee future results. Markets involve significant risk, including the loss of capital. Always conduct your own research before making any financial decision. Titan Protect is not authorised or regulated by the FCA or any other financial authority.
Friday 12 Jun 2026
Crude Oil WTI (CL) — Daily Read | Friday 12 June 2026
Ticker Read | Commodities | Alpha Insights
Session Snapshot
What Happened
Crude hit $92 this week. Then it gave almost all of it back. The $5.60 pullback to $86.40 tells you everything you need to know about how much of that rally was geopolitical premium versus actual supply tightness.
The Iran de-escalation narrative landed hard. Diplomatic signals suggesting reduced tension in the Strait of Hormuz pulled the rug from under the risk premium that had been building for weeks. When geopolitical premium unwinds, it unwinds fast because it was never based on physical barrels. It was based on fear of barrels going missing.
The analysis panel on Friday shows exhaustion and capitulation signals. VP value area high rejection at the $92 level was definitive. Multiple Titan Lines broken down on the pullback. The structure has shifted from bullish momentum to distribution. Thursday’s panel showed the beginning of this shift. By Friday, it was confirmed across all layers.
The question now is where the geopolitical premium ends and the fundamental value begins. Physical supply is still tight. US inventories remain below seasonal norms. OPEC discipline has held better than expected. The pullback is taking crude toward levels where physical demand should provide support. But getting there might involve another $2-3 of downside first.
Day-over-Day Comparison
| Metric | Thursday 11 Jun | Friday 12 Jun | Change |
|---|---|---|---|
| Sentiment | Turning bearish | Bearish confirmed | Deteriorated |
| VP Rejection | Value area high test | Confirmed rejection | Bearish confirm |
| Momentum | Fading buy pressure | Active selling, exhaustion | Worsened |
| Titan Lines | Breaking down | Multiple broken down | Confirmed |
What the Framework Shows
Geopolitical Premium Unwind : Fast and Violent
The $92 to $86.40 move was geopolitical premium leaving the building. When diplomatic progress removes the tail risk of supply disruption, the market reprices immediately. This is not a fundamental shift in supply-demand. It is a risk premium adjustment. The underlying physical market has not changed. Understanding this distinction prevents panic selling at the wrong level.
Physical Floor Approaching : $84-85 Has Structural Demand
Below $85, physical buyers historically step in. Refinery margins remain healthy at these levels. Strategic reserve replenishment interest from multiple countries sits in this zone. The pullback may extend another $2 but the velocity of selling should decelerate as it approaches physical demand levels.
CPI Link : Energy Component Matters
CPI at 4.2% includes energy’s contribution. If crude stabilises around $85, the energy component of next month’s CPI reading flattens. If it continues lower toward $80, CPI benefits from base effects. Either way, crude’s path here has direct implications for the inflation narrative that drives Fed expectations and, indirectly, everything else.
Key Levels
| Level | Price | Significance |
|---|---|---|
| Geopolitical High | $92.00 | Week high. Only revisited if Iran escalation returns. |
| Broken Support | $89.00 | Former support now resistance. First test on any bounce. |
| Friday Close | $86.40 | Current. In no-man’s land between broken support and physical floor. |
| Physical Floor | $84.50 | Refinery margin support. Strategic reserve interest. Should slow the decline. |
| Extension | $82.00 | Only on full de-escalation plus OPEC discipline breakdown. Low probability. |
Scenarios
Crude finds buyers at $84.50-85. Stabilises. Iran remains de-escalated. Range $84-89 into next week.
Another $2 of downside toward $84.50. Gets there slowly. Physical demand absorbs. No panic, just repricing.
Iran headlines flip. De-escalation collapses. Crude retests $90 within 48 hours. The premium returns as fast as it left.
Risk Score
Why around 55%: Unlike gold, crude has a tangible physical floor approaching. Refinery demand and strategic reserve interest create genuine support below $85. The pullback from $92 was violent but expected once the Iran premium deflated. Risk sits at 55 rather than 65 because the fundamental picture supports the asset at lower levels. The tail risk is re-escalation, which would reverse the entire move overnight.
Alpha Insights : Friday 12 June 2026. For informational purposes only. Not financial advice. All trading involves risk of loss.
Friday 5 Jun 2026
Crude Oil — WTI (USOIL) — Daily Read | Friday 5 June 2026
Titan Protect Alpha Insights | Rates Repricing Day | analysis as of pre-market 5 June 2026
Market Context
Crude oil fell 3.06% on Friday in a move driven by two simultaneous forces: the global growth demand destruction narrative triggered by the hot NFP data (higher rates = slower economy = lower energy demand), and the ongoing OPEC+ supply management uncertainty. The dollar’s sharp rise on the NFP print also created direct downward price pressure on crude, as oil is priced in dollars and a stronger greenback reduces the effective price for non-US buyers, softening global demand expectations.
The OPEC+ alliance has been navigating a complex balancing act in 2026 between maintaining market share and supporting prices. Any indication that member nations might increase production to compensate for revenue losses from lower prices creates additional supply pressure on top of the demand-side concerns. Ahead of the weekend, market participants may reduce risk ahead of any OPEC+ weekend communication.
Technically, crude oil broke below a key support level during Friday’s session, triggering stop-loss selling and algorithmic momentum trades that amplified the move. This technical deterioration adds weight to the bearish near-term outlook beyond the fundamental macro drivers.
Macro demand destruction narrative plus technical breakdown plus dollar strength. Three bearish forces converging on crude oil. Key support at 72.00 is the next test.
Key Levels
| Level | Price (USD/bbl) | Significance |
|---|---|---|
| Resistance 2 | 78.50 | Pre-selloff high and 20-day average |
| Resistance 1 | 75.80 | Broken support now acting as resistance |
| Close / Pivot | 74.20 | Friday settlement level |
| Support 1 | 72.00 | Key structural support from Q1 2026 |
| Support 2 | 69.50 | Major demand zone — breach signals potential move towards 65 |
Weekend Setup
Any OPEC+ communication over the weekend regarding production levels will have an outsized impact on crude oil’s Monday open. An indication of production cuts in response to lower prices could produce a sharp bounce. Conversely, any signal of production increases would compound the bearish narrative. Watch for statements from Saudi Arabia and the UAE over the weekend.
Monday’s open below 72.00 would be technically significant and is likely to attract further systematic selling. The 72.00 level is the line between a correction and a deeper trend change — hold it and the current selloff is manageable; lose it and the picture darkens considerably.
Risk Note: Crude oil is sensitive to geopolitical events, particularly in the Middle East and Russia, which can produce sudden and violent price reversals regardless of the prevailing macro narrative. Never assume that a bearish trend in crude is immune to supply disruption risk.
This content is for informational and educational purposes only. It does not constitute financial advice, a personal recommendation, or a solicitation to buy or sell any financial instrument. Past performance is not a reliable indicator of future results. Trading involves significant risk of loss. Always conduct your own research and consult a qualified financial adviser before making investment decisions. Titan Protect Alpha Insights is not authorised or regulated by the Financial Conduct Authority.
Friday 5 Jun 2026
Crude Oil (WTI) — Daily Read | Thursday 4 June 2026
Published: Thursday 4 June 2026 | Titan Protect Alpha Insights
WTI crude is down 3.04% to $93.10, driven by Iran de-escalation signals that reduce the geopolitical risk premium baked into prices. When markets perceive a reduction in supply disruption risk from the Middle East, the safety premium comes out of crude prices quickly. Today’s move is large and meaningful. The question is whether the underlying supply-demand balance can hold crude above $90 once the risk premium has fully unwound.
What the Analysis Shows
A 3% single-day drop in crude is not trivial. It reflects genuine repricing of the geopolitical risk component rather than a demand change. The fundamental supply picture (OPEC+ production cuts, US shale discipline) has not changed overnight. What has changed is the market’s assessment of Middle East supply risk. As Iran signals ease, the $3-5 risk premium that was built in starts to come out.
WTI at $93.10 is still at a level that keeps many US shale producers profitable and does not trigger OPEC+ panic. The $90 level is the key floor to watch. Below $90, OPEC+ members start to feel production cut fatigue, and the political dynamics around extending those cuts become more complicated. The demand side from China (weaker Hang Seng, outflows) adds a further headwind.
Bias: Bearish near-term. The Iran risk premium is unwinding. Unless Iran de-escalation reverses or demand data surprises strongly upward, the path of least resistance is toward $90. NFP employment data will give a read on US demand, which matters for the domestic consumption picture.
Key Levels
| Level | Price (WTI) | Significance |
|---|---|---|
| Support 1 | $90.00 | Psychological and OPEC+ floor |
| Support 2 | $87.50 | Structural demand zone below |
| Resistance 1 | $95.80 | Pre-drop level, now overhead |
| Resistance 2 | $98.00 | Bull recovery target |
Tomorrow’s Setup
Monitor Iran news overnight for any reversal in the de-escalation narrative. NFP will give a US demand signal. Any resumption of Middle East tensions would sharply reverse today’s move. Without a catalyst, the drift toward $90 support continues. The $90 level holds the key: a clean break below would trigger stop-loss selling and risk an acceleration lower.
Risk Note: Geopolitical risk in crude oil is inherently unpredictable. Iran-related headlines can reverse in hours, not days. A 3% drop driven by de-escalation can turn into a 3% bounce on any re-escalation signal. Position management around crude requires wider stops to account for this headline risk.
This analysis is for informational purposes only and does not constitute financial advice. Markets involve risk. Past performance is not indicative of future results. Always conduct your own due diligence before making any investment decisions.
Thursday 4 Jun 2026
Crude Oil WTI
Daily Read — Wednesday 3 June 2026
Current Price
$96.07
Daily Change
+2.46%
What Happened Today
Crude oil surged 2.46% to $96.07, reaching a new cycle high, as geopolitical risk around the Strait of Hormuz continued to drive supply premium into the price. The Hormuz narrative has been building for several sessions now and today’s move suggests the market is taking the risk seriously rather than pricing it as a temporary spike.
Approximately 20% of global seaborne oil passes through the Strait of Hormuz. Any disruption — or credible threat of disruption — creates an immediate and dramatic supply shock narrative. The market does not wait for an actual disruption to happen; the probability of disruption is enough to move prices sharply.
The $96 level is a structurally significant price. It was a ceiling that took multiple attempts to break, and today’s close above it on a 2.46% move gives the break credibility. The $100 level is now the next psychological target in play. However, if Hormuz tensions ease, the geopolitical premium can unwind very quickly.
Key Levels
| Level | Price | Significance |
|---|---|---|
| Resistance | $100.00 | Psychological round number target |
| Pivot | $96.07 | Current cycle high / close |
| Support 1 | $93.50 | Prior breakout level, now support |
| Support 2 | $90.00 | Structural base / OPEC reaction zone |
Current Bias
Hormuz supply premium is real and the $96 breakout has credibility. The $100 target is in play. However, this is a geopolitical trade — if the news changes, the price change is equally fast.
What to Watch Tomorrow
- Any developments on Hormuz — the primary catalyst in either direction
- EIA crude inventory data (Wednesday evening US time)
- OPEC+ statements or member commentary
- $100 round number test — the market will want to take a look
Risk Assessment
High. Around 70% risk environment. Geopolitical premium is inherently volatile — the spike risk and the unwind risk are both elevated. This is not a slow-moving market.
This content is for informational purposes only and does not constitute financial advice. Past performance is not indicative of future results. Trading involves risk of loss. Always conduct your own research before making any investment decisions.
Tuesday 2 Jun 2026
Silver (XAG/USD) — Daily Framework Read | Tuesday 2 June 2026
Silver (XAG/USD) | Post Close Setup Daily Read | Data basis: 2026-06-02 close
Where It Sits
Structure
Structurally Silver (XAG/USD) sits above its short-term moving averages with the daily trend firmly higher. The recent advance has been orderly with no signs of distribution or topping behaviour. The reference anchor at 75.5350 acts as the bias line.
Momentum
Momentum is positive but measured. The advance has been orderly without stretching the range. Internal readings are constructive without flagging exhaustion — supportive of continuation.
Volume & Flow
Flow on the session close was measured. Positioning data suggests steady accumulation rather than aggressive directional commitment. The pattern supports continuation rather than reversal.
Key Levels
| Level | Type | Significance | Action Zone |
|---|---|---|---|
| 79.40 | Resistance | Upper range target, prior supply zone | Take profits / fade if rejected |
| 76.80 | Pivot | Mid-range continuation marker | Hold = constructive; lose = consolidation |
| 75.54 | Session close | Reference anchor for next session | Above = continuation; below = mean revert |
| 73.50 | Support | Recent range floor, demand zone | Buy zone with defined stop |
| 70.90 | Major support | Prior breakout retest level | Stop-out below for longs |
Three Scenarios
Continuation
Silver (XAG/USD) holds 75.5350 and extends higher on supply tightness or safe-haven demand. The structural trend supports continuation. Watch for follow-through above the pivot.
Range
Silver (XAG/USD) opens flat and churns around 75.5350. Digesting the recent move. Range trade with the trend as a tailwind.
Mean Reversion
Silver (XAG/USD) fades on dollar strength or demand concern, breaks below support. Mean reversion within the broader uptrend.
Risk Score
Risk sits at Around 50%
Risk sits around 50 per cent. Vix at 15.7 supports a measured risk posture. sentiment at 57 is neutral. Commodities carry supply-demand headline sensitivity. Standard sizing with defined stops — discipline beats conviction.
How to Walk It
Entry / Stop / Target structure:
- Long 73.50 pullback | Stop 70.90 | Target 76.80 | R:R 2:1
- Long 76.80 breakout | Stop 75.54 | Target 79.40 | R:R 1.5:1
- Fade 79.40 rejection | Stop above resistance | Target 75.54 | R:R 2:1
Experience-level guidance:
Beginner: Reduce size to half your standard. Trade only the cleanest setup from the entries above. If the tape opens against your bias, do nothing — wait for the second hour, when the institutional flow has tipped its hand.
Intermediate: Use the levels table to define the trading range. Fade the extremes with defined stops, take profits before the round-number resistance levels.
Advanced: The vol regime supports defined-risk structures around the key pivot levels. Keep notional small relative to your book — asymmetric speculation, not core positioning.
Continue Reading
The macro frame driving this read is unpacked in the session briefs:
Check the latest session briefs on the site.
This analysis is for educational and informational purposes only. It does not constitute financial advice. Always manage your risk independently and in accordance with your own financial circumstances.