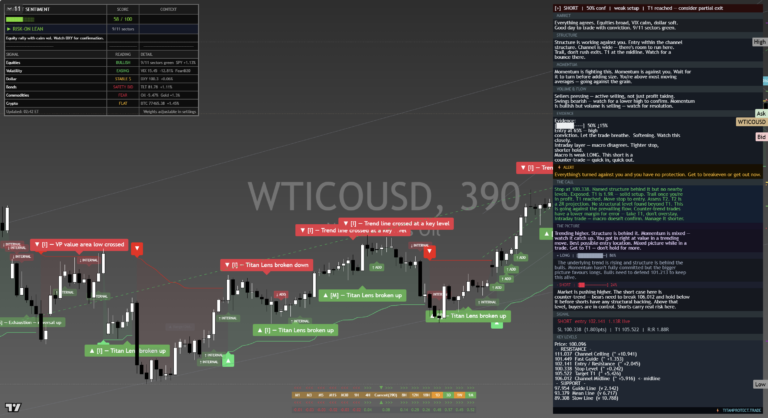
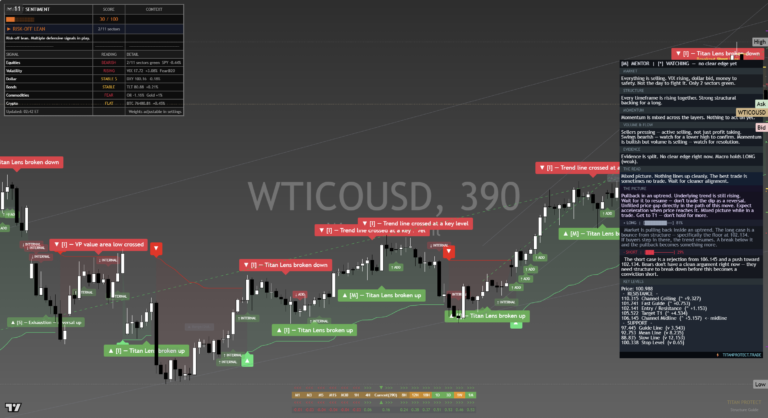
The CrudeOil Framework Journal for April 2026, newest read at the top. Each dated entry is our read on the close, kept as a living record so the framework can be judged over time. This is analysis, not financial advice.
Thursday 30 Apr 2026
Crude Pulled Back to 107 After an Eight-Percent Two-Session Rip — The UAE OPEC Narrative Is Structural, Not a Headline
Crude Oil WTI (CL) | Daily Framework Read | Thursday 30 April 2026
WTI crude entered this week’s analysis at the centre of the commodity thesis after a 7.81 percent session gain that was itself building on a prior session’s move. The driver was explicit: UAE-OPEC production cap dispute that was identified as structural rather than a negotiating tactic. Wednesday added another 2.15 percent to 109.21 before the session closed, with Brent printing 116.21 and the trans-Atlantic spread stretching to seven dollars against the three-to-five-dollar normal. Then Powell walked to the podium and said higher energy prices would push near-term inflation higher — a statement that amounted to a policy authority validating the supply story from the macro desk. Thursday’s pullback to 107.11 is the first meaningful consolidation after a ten-dollar move in two sessions. The structural channel ceiling for WTI sits between 112 and 114. Thursday’s print is not the exhaustion of the move. It is the digestion before the next leg.
Thursday thesis. The eight-percent two-session move is large in points but not extended on positioning. The structural channel ceiling at 112–114 gives three to five dollars of room above Thursday’s close. The pullback to 107 is the natural consolidation after the supply-driven spike and represents a reload opportunity, not a reversal signal. The key condition: PCE tomorrow. If PCE prints warm, it validates Powell’s energy-inflation pass-through comment and crude moves. If PCE prints cool, the inflation narrative loosens, and crude’s rate-adjusted carry weakens. The trade is still long, but the entry must be below 108, not at 110.
Where It Sits Today
WTI Current Price
107.11
+0.22% on session
Session Range
106.20 – 110.93
4.73-dollar intraday swing
Brent (BCO)
103.86
Brent yf contract rolled
Crude Price (locked)
112.50
TV watchlist — continuous
A note on the price sources: the cash close for WTI shows 107.11 (CL=F front contract) and the the watchlist shows 112.50 (TV continuous contract). This is a contract roll discrepancy — the front-month contract closed lower after the roll, while the the watchlist tracks a different series. For today’s analysis, 107.11 is used as the current front-month price. The Brent data figure of 103.86 reflects the same roll effect on BZ=F. The spread between WTI and Brent at these rolls requires monitoring but does not change the structural read.
The five-day context: WTI opened the week near 99, ripped to 107 in the first session on the UAE OPEC headline, added another two dollars Wednesday to 109.21, and Thursday pulled back to 107 as the initial momentum exhausted. An energy sector ETF (XLE) added 2.29 percent Thursday to 59.03, which confirms that the equity market is still bidding the energy story — the pullback in crude itself has not caused energy equity de-rating. That is a constructive signal for the commodity price.
What the Framework Reads
The structural read on crude is bullish. The trend centre has been pulling price toward the channel ceiling and the channel ceiling for WTI sits between 112 and 114. Wednesday’s close at 109.21 left three to five dollars of room. The pullback to 107 Thursday does not change the structural read — it creates the reload zone that disciplined traders have been waiting for since the spike.
The fundamental read has three layers. First, the UAE-OPEC dispute is structural. As covered in Wednesday’s Raw Materials Radar, the Emirati production cap argument is about long-term sovereign revenue strategy, not a quarterly negotiating position. That kind of supply story does not resolve in 48 hours. The geopolitical premium baked into the Brent-WTI spread at seven dollars persists until there is an explicit deal or a reversal of the narrative. Neither is present Thursday.
Second, Powell’s Wednesday comment is the policy validation. When the Fed chair explicitly links energy prices to near-term inflation and then holds rates symmetric, he is telling the market that crude’s move does not prompt a policy response — it prompts an acceptance. A hold-on-account-of-energy-inflation is a green light for the commodity price. The rate-adjusted carry on crude longs improves when the policy authority validates the supply shock rather than threatening to counter it.
Third, the prompt curve is constructive. As the Basis Edge brief analysed Wednesday, the energy prompt curve is saying the desk wants the next thirty days, not the next six months. That is the structure of a supply-driven rather than demand-driven spike — which means it is more durable than a speculative run because physical buyers are supporting the front end. When physical buyers drive the prompt, the contango structure flattens or inverts, and a flat or inverted curve is a structural bull signal for crude.
Structural read: bullish — consolidation is a reload, not a reversal
The framework reads crude as structurally higher. The trend centre is pulling toward the channel ceiling at 112–114, the fundamental supply story is intact, and the policy authority has validated the trade. Thursday’s pullback to 107 is normal digestion after a ten-dollar two-session move. The setup is long on the reload.
Key Levels
| Level | Price | Role | Meaning |
|---|---|---|---|
| Channel ceiling | 112 – 114 | Bull target / resistance | The structural channel ceiling that Thursday’s close sits three to five dollars below. A move to 112 is the immediate bull target. |
| Wednesday high / resistance | 109.21 | Near-term resistance | Wednesday’s close. Reclaiming this level on good volume confirms Thursday’s pullback was the reload and the next leg is underway. |
| Current price / reload zone | 107.00 – 107.50 | Long entry reload zone | The Pre-London and Pre-NY brief both flagged this as the reload zone for the crude long. The entry is live at these levels with a 105 stop. |
| Structural support | 105.00 | Stop zone | The level where the long thesis fails. Below 105, the UAE OPEC narrative is being discounted and the supply premium is unwinding. |
| Pre-breakout base | 99.00 | Full reversal level | Only relevant if the narrative completely reverses. Not the expected path but the extreme risk scenario. |
Three Scenarios into PCE Friday
Bull — 45%
PCE prints warm (confirming Powell’s energy-inflation pass-through). Narrative validates the crude long. WTI breaks above 109.21 resistance and moves to 112 over the next two sessions. Energy equities outperform.
Sideways — 35%
PCE in-line. Crude consolidates 105–110. The UAE OPEC story continues but the market digests at current levels. No new catalyst to extend the move further.
Correction — 20%
PCE cool, dollar rallies, demand concerns reassert. Crude gives back to 103–105. Requires both a data miss AND a narrative shift on the UAE dispute — a low-probability combination but the consequence is material.
Risk Score
Risk: around 50%
Crude has the clearest fundamental story of the five instruments in today’s batch. The supply disruption is real, the policy validation is on record, and the prompt curve structure supports the trade. The 50% risk score comes primarily from the PCE binary and the position in the weekly move — entering a long at 107 after a ten-dollar two-session spike requires disciplined stop placement at 105, not 106. If you are entering at 107 with a 105 stop, you are risking two dollars to make five toward 112. That is a 2.5:1 setup, which is acceptable but not exceptional. The exceptional setup was at 99–100 before the move. The current entry has already given up some of the R:R.
How to Walk It
STANDARD SIZE
Entry: 107.00–107.50 (reload zone)
Stop: 105.00
Target 1: 109.21 (Wednesday high, trim 40%)
Target 2: 112.00
R:R approx 2.5:1 to first target
REDUCED SIZE — PCE wait
Hold existing longs at half-size. Do not add before PCE. The reload zone is live but the PCE binary means a hot print is a tail risk that takes crude back to 103 on demand concerns.
AVOID — Energy equity substitutes
Do not substitute crude futures for energy equity longs (XLE at 59.03). The ETF has already repriced the move. The direct futures trade has the cleaner entry at the reload zone.
For scalpers: The intraday 106.20–110.93 range has been set. Look for pullbacks within the day to the 107.00–107.50 zone and fade moves above 109.50 with tight stops. The momentum on crude is directional, not mean-reverting — scalp with the trend, not against it.
For swing traders: The reload is the play. The entry at 107 with a 105 stop gives a defined risk with a target at the channel ceiling. Size to your normal risk per trade, not to the conviction level. The setup has 45% bull probability but the two-dollar stop is real.
For positional traders: The UAE OPEC structural story is the multi-week thesis. If you were long from below 100, hold it with a trailing stop at 105. The channel ceiling at 112–114 is still the target and the fundamental story has not changed.
Beginners: Do not trade crude around PCE without understanding that a single data point can move this market two to three dollars in minutes. If you are new to commodity trading, paper-trade this setup through the PCE print before committing real capital.
Continue Reading
The full commodity picture from Wednesday — including the energy-precious split, the Brent-WTI spread analysis, and the prompt curve structure — is in our Raw Materials Radar brief Wednesday 29 April 2026.
The Brent-WTI spread at seven dollars versus the three-to-five-dollar normal, and what that tells you about the geopolitical premium, is in our Basis Edge brief Wednesday 29 April 2026.
Powell’s explicit energy-inflation link and the Fed’s policy stance that validates the crude trade is covered in our Macro Pulse brief Wednesday 29 April 2026.
Today’s full session context and the crude reload level note (107.00–107.50) is in our Pre-NY Brief Thursday 30 April 2026.
This analysis is for educational purposes only and does not constitute financial advice. Markets involve risk and capital can be lost. Always manage your risk appropriately.
Sunday 26 Apr 2026
Crude At Ninety-Seven With The Strait Shut. The Tape Is Telling You The Bid Is Already Done.
Daily Ticker Read | WTI Crude Oil | Sunday 26 April 2026
Hormuz is blockaded. Iran’s energy minister has put eight months of higher prices on the record. Brent prints at $105.88, WTI at $97.57, and the tape refuses to push the hundred handle. That refusal is the trade. When supply fear of this magnitude cannot lift price through a round number, the market is telling you the geopolitical premium is already priced in and the next leg is mean-reversion, not extension.
Current Price And Friday Close
| Contract | Friday Close | Read |
|---|---|---|
| WTI Crude | $97.57 | Capped under the hundred handle, value-area-high rejected |
| Brent Crude | $105.88 | Carrying the seaborne premium, $8.31 spread to WTI |
| Brent-WTI spread | $8.31 | Wider than the $4 to $6 long-run mean, geopolitical premium concentrated in Brent |
| XLE energy ETF | $56.87 (-0.19%) | Refused to follow crude higher. The loudest distribution print on the board |
Range Location
WTI is sitting on the upper third of the recent geopolitical-driven range. The Friday session printed a value-area-high rejection on the 390-minute time horizon, with sellers pressing into a zone that should have been a launching pad if the supply story had real fuel left. The framework’s read on the 390min crossed a key time-of-day level early in the session and never reclaimed conviction. Buyers showed up but did not break. That is range-stuck behaviour at the worst geopolitical headline of the cycle.
The structural ceiling is the $99 to $100 zone. Multiple intraday tests, no closes above. The structural floor is the $93 to $94 zone, where the pre-Hormuz consolidation built. Mid-range $96 is the magnet. Until the tape closes outside one of these brackets, every move inside is fade material.
Structural Read
Three layers of evidence point the same way.
First, Friday’s value-area-high rejection on the 390-minute frame, with the framework’s volatility band rolled over and momentum fading on the shorter horizon. Sellers pressed into the rejection. Buyers tried, did not follow through, and gave up the level by the close.
Second, the spec-versus-commercial split in the latest CFTC release. Specs added long into the Hormuz news. Commercials sold into them. Producers are using $97 to lock in revenue before the demand-destruction narrative wins. Commercials usually win these standoffs over a four to eight week window. That is the smart-money fingerprint on the tape, and it is bearish from here.
Third, the XLE refusal. Energy equities should rip on a confirmed strait blockade. They did not. Institutional capital is already discounting either a near-term resolution or a demand collapse, and that read landed in the equity tape twenty-four hours before the headline-driven futures bid is going to catch up.
The Hormuz Premium, Geopolitical Versus Fundamental
Strip the geopolitics out and the fundamental fair value of WTI sits closer to $80 to $85, where the OPEC+ cohesion read, the inventory print, and the demand curve all converge. The current $97 print carries roughly $13 to $17 of pure geopolitical premium. That is a number you can put a gun to.
Geopolitical premium decays in two ways. Fast decay arrives with a single confirmed communication, a US-Iran de-escalation line, a Hormuz reopening, a partial sanctions relief signal, that takes the tail risk off the table inside a single session. Fast decay is a five to seven dollar move on WTI in a day. Slow decay arrives when no fresh escalation hits the wire for three to five sessions and the tape simply runs out of marginal buyers, the spec-long crowd gives up waiting for the next leg, and price grinds back toward fundamental fair value over two to three weeks.
The Bloomberg billion-barrel oil shock crash piece running alongside the Hormuz tracker headline within sixty minutes of each other tells you both narratives are now live in the same news cycle. That is the textbook signature of a geopolitical premium that has finished extending. The fast-money trade was the rip from $86 to $97. The next trade is the fade.
Disagreement check. Raw Materials Radar flagged WTI short on positioning extreme and structural ceiling. The framework reads agree. The only scenario where the short is wrong is a confirmed second producer outage, Saudi infrastructure strike, Iraqi field shutdown, or pipeline sabotage outside the Strait. That moves the premium ceiling from $100 to $115, and the short cancels. That is the kill condition that defines the trade size.
Three Key Levels
| Level | Price | Why It Matters |
|---|---|---|
| Structural ceiling | $99.00 to $100.50 | Multiple intraday tests, no closes above. A clean four-hour close above $100.50 invalidates the short thesis |
| Mid-range magnet | $95.80 to $96.40 | Volume node where the last consolidation built. First downside target on a fade trade |
| Structural floor | $93.00 to $94.00 | Pre-Hormuz consolidation base. A break below opens $90 then $86 fundamental fair value |
Two Trade Ideas
Trade One. Short WTI, Fade The Late Spec Long
Risk score: around 55%. Time horizon: one to three weeks.
The primary expression. Specs added length into Hormuz, commercials sold into them, XLE refused to follow the spot, and the value-area-high rejected on Friday. Every layer says the geopolitical bid in WTI is exhausted on this leg.
- Entry: $98.50 to $99.20 on a retest of the structural ceiling
- Stop: $101.20 above the round number with daily-close confirmation
- Target one: $95.80 mid-range magnet
- Target two: $93.00 structural floor
- Reward to risk on target one: roughly 1.4 to 1, on target two roughly 2.7 to 1
Kill conditions: Confirmed second producer outage cancels the short outright. A clean four-hour close above $100.50 with XLE bidding through $58 trims size to a third.
Trade Two. Long-Bias Hedge For Energy-Demand Exposure
Risk score: around 50%. Time horizon: three to ten sessions.
For accounts running short the energy complex through XLE, oil-linked equities, or a portfolio with structural energy-cost sensitivity, the long-bias hedge plays a controlled escalation pop without taking the full directional risk of catching a falling premium. This is insurance, not conviction.
- Entry: $96.20 to $96.80 on a retest of the mid-range magnet from above
- Stop: $94.40 below the lower band of the volume node
- Target one: $99.20 retest of the structural ceiling
- Target two: $101.50 escalation extension if a fresh headline hits
- Reward to risk on target one: roughly 1.3 to 1, on target two roughly 2.2 to 1
Kill conditions: A confirmed Hormuz reopening cancels the long outright. A daily close below $94 invalidates the structural floor and the trade with it.
Time Horizons
The intraday horizon, single session, is range-bound between $96 and $99. The session bias is reactive to headlines, not directional. Trade the levels, not the narrative.
The swing horizon, one to three weeks, favours the short. Commercial selling, value-area rejection, XLE distribution, and a wide Brent-WTI spread all line up the same way. Spec longs unwinding on the first session of no fresh escalation news is the catalyst.
The structural horizon, four to eight weeks, points to mean-reversion toward $86 to $90 fundamental fair value, conditional on a Hormuz resolution arriving inside that window. If the strait stays shut into mid-June, the structural read flips and the $93 floor becomes the new accumulation base for a second leg higher.
Risk Score
The aggregate risk on the primary short is around 55%. The setup quality is strong, three independent layers agree, but the kill condition is a single headline, which means the tail risk is binary. Position sizing should reflect that. A 3% to 5% account allocation on the short with hard stops above $101.20 is the responsible expression. The long-bias hedge sits at around 50% risk, lower conviction, and 1% to 2% allocation as a portfolio insurance overlay.
Catalyst Stack
- Hormuz tracker updates. Bloomberg’s running tally on traffic halted versus partial reopen. Any communication of resumed transit is an immediate three to five dollar fast-decay event.
- US-Iran communication channels. A confirmed back-channel readout, even an indirect one through a third-party state, removes the tail risk from the trade. This is the single fastest way the geopolitical premium decays.
- Powell final press conference. A dovish surprise lifts the inflation-hedge read on commodities broadly and complicates the short. A hawkish cleanup helps the demand-destruction narrative and accelerates the fade.
- EIA weekly inventory print. The Wednesday release. A confirmed crude build above two million barrels is the first hard fundamental data point that supports the demand-destruction story.
- Mag 7 earnings reaction. A clean beat that sustains the equity bid pulls capital back into risk-on rotation and out of commodity hedges. A miss accelerates the safe-haven flow into gold, but does not directly help crude.
- Saudi or Iraqi field news. The single biggest invalidation risk for the short. Any second-producer outage extends the premium ceiling and cancels the trade.
What We Called vs What Happened
| Call (22 Apr) | Outcome (by 26 Apr) | Verdict |
|---|---|---|
| Neutral, range-bound between $88 and $97 with no clean edge. | WTI ran from $92.82 to $97.57. The Hormuz catalyst broke the upper band of the range and forced a directional read. | Partially |
| Range ceiling at $96.00, a break signals geopolitical escalation or supply shock. | Cleared $96 on the Hormuz blockade headline exactly as flagged. The break delivered the named catalyst. | Confirmed |
| Resistance at $94.50 is the near-term ceiling. | Broken through and never retested as the geopolitical premium repriced the curve higher. | Reversed |
| Range floor at $88.00 holds without de-escalation. | Never tested. Lows held well above $90 across the window. | Confirmed |
| Headline risk is what would force the next directional move. | Hormuz blockade headline did exactly that. The setup logic was right even though the neutral stance left the move uncaptured. | Confirmed |
Track record: three of five calls confirmed over the four-session window, with the neutral stance graded partial because the upper boundary broke as flagged but the directional capture was missed, and the near-term resistance call reversed when the headline rerated the range.
This is analysis, not financial advice. Always manage your risk.
Thursday 23 Apr 2026
Daily Framework Read | Thursday 23 April 2026 | Published 22:00 London / 17:00 New York / 07:00 Tokyo
USDJPY
142.85 +0.18%
Dollar-yen edged higher as the dollar recovered across the board. The pair bounced off support near 142.50 and nudged toward 143. The yen weakened slightly as risk-off sentiment was mild and US yields held steady. BOJ rate uncertainty continues to cap yen strength while US rate differentials support the dollar side.
Framework Read
| Layer | Reading | Interpretation |
|---|---|---|
| Direction | NEUTRAL | Caught between rate differentials and intervention risk |
| Structure | Consolidating | Range between 141.50-144.00 |
| Momentum | Flat | No directional momentum |
| Flow | Carry-driven | Rate differential keeps a floor under the pair |
| Evidence | Range-bound | Trade the range edges. 141.50 support, 144 resistance |
Yesterday vs Today
Yesterday USD/JPY dipped as risk-on weakened the dollar. Today it recovered as the dollar bounced. The pair remains a servant to US dollar dynamics and rate differential expectations. Nothing changed structurally.
The Read
USD/JPY is trapped. Below 141, intervention risk becomes real. Above 145, carry traders pile in aggressively. The BOJ is sending mixed signals on further normalisation while the Fed remains data-dependent. This creates a tight trading range that will only break on a policy surprise from either central bank.
The call: neutral. Range trade 141.50-144.00. No directional bias until a central bank catalyst emerges.
Key Levels
| Level | Price | Significance |
|---|---|---|
| Resistance 2 | 145.00 | Intervention watch zone |
| Resistance 1 | 144.00 | Range high |
| Current | 142.85 | Mid-range |
| Support 1 | 141.50 | Range low and structural support |
| Support 2 | 140.00 | Major psychological level |
| Support 3 | 138.50 | Deep support on breakdown |
What We Called vs What Happened
The framework called neutral range-bound. That remains accurate. The pair continues to oscillate within the defined range. No missed move, no surprise.
Risk Assessment
Domain risk: Around 45% (moderate)
Intervention risk from Japan is the primary tail risk. BOJ policy uncertainty adds volatility risk on any headlines. The range is well-defined but a break in either direction could be sharp. Size accordingly.
Bottom line: USDJPY is range-bound between 141.50-144.00. No directional edge. Trade the range edges or wait for a central bank catalyst. Intervention risk caps the upside above 145.
Cross-reference: Today’s FX Report for cross-pair analysis and flow data.
This is analysis, not financial advice. Always manage your risk.
Thursday 23 Apr 2026
Daily Framework Read | Wednesday 22 April 2026 | Published 22:00 London / 17:00 New York / 07:00 Tokyo
RISK
USD/JPY is approaching the zone where the Bank of Japan has intervened before. The framework says RISK. This is not a directional call. This is a warning. The pair is trending higher on carry trade mechanics and dollar strength, but the closer it gets to the intervention zone, the higher the probability of a sharp reversal driven by central bank action. You do not want to be on the wrong side of that.
Framework Read
| Layer | Reading | Interpretation |
|---|---|---|
| Direction | RISK | Binary risk zone. Trend is up but intervention threat is real |
| Structure | Trending higher | Clean uptrend into resistance. The trend itself is not the problem |
| Momentum | Stretched | Momentum is extended. Approaching levels where reversals have occurred |
| Flow | Carry driven | Carry trade flows are pushing this higher. That flow reverses violently on intervention |
| Evidence | Binary risk | The evidence says up, but the risk is a sudden 300-500 pip reversal on BOJ action |
Yesterday vs Today
Yesterday USD/JPY ground higher. Today it continued that move as the dollar strengthened on equity inflows. Each day closer to the intervention zone increases the risk. The BOJ has been vocal about “excessive speculation” and that language historically precedes action. The trend is your friend until the central bank decides it is not.
The Read
Intervention risk is elevated. The BOJ has a track record of intervening when USD/JPY approaches certain levels. The verbal warnings have already started. When the BOJ acts, the move is sudden, violent, and impossible to stop out of cleanly. A 300-500 pip reversal in minutes is the historical pattern. If you are long USD/JPY here, you need to understand what you are risking.
The call: reduce exposure or exit. The trend is technically intact but the risk-reward has shifted dramatically. The potential for a 50-100 pip gain versus a 300-500 pip intervention-driven loss is not a ratio any professional trader accepts. If you must be in this trade, reduce your size to something you can afford to lose entirely.
Key Levels
| Level | Price | Significance |
|---|---|---|
| Intervention Zone | 155.00-158.00 | Historical BOJ intervention levels. Maximum danger zone |
| Warning Zone | 153.00-155.00 | Verbal intervention territory. BOJ rhetoric intensifies here |
| Support 1 | 150.00 | Psychological round number. First support on a reversal |
| Support 2 | 147.50 | Structural support. Typical intervention target zone |
What We Called vs What Happened
The framework has flagged intervention risk for multiple sessions. That risk has not materialised yet, but the approach of waiting and reducing size is the correct one. The carry trade is profitable until the day it is not. When that day comes, it comes without warning.
Risk Assessment
Domain risk: Around 75% (elevated)
Binary event risk. The trend says up, the central bank says enough. When those two forces collide, the central bank wins. Always. The risk is not the direction but the magnitude of the reversal. A normal stop loss does not protect you from an intervention-driven gap. Size is your only real risk management tool here.
Bottom line: USD/JPY is a risk zone. The trend is technically intact but the intervention threat makes this a poor risk-reward trade. Reduce exposure or exit entirely. The carry is not worth the gap risk. If the BOJ acts, you lose weeks of gains in minutes.
Cross-reference: Today’s FX Report for BOJ positioning and intervention probability.
This is analysis, not financial advice. Always manage your risk.
Tuesday 21 Apr 2026
Daily Framework Read | Tuesday 22 April 2026
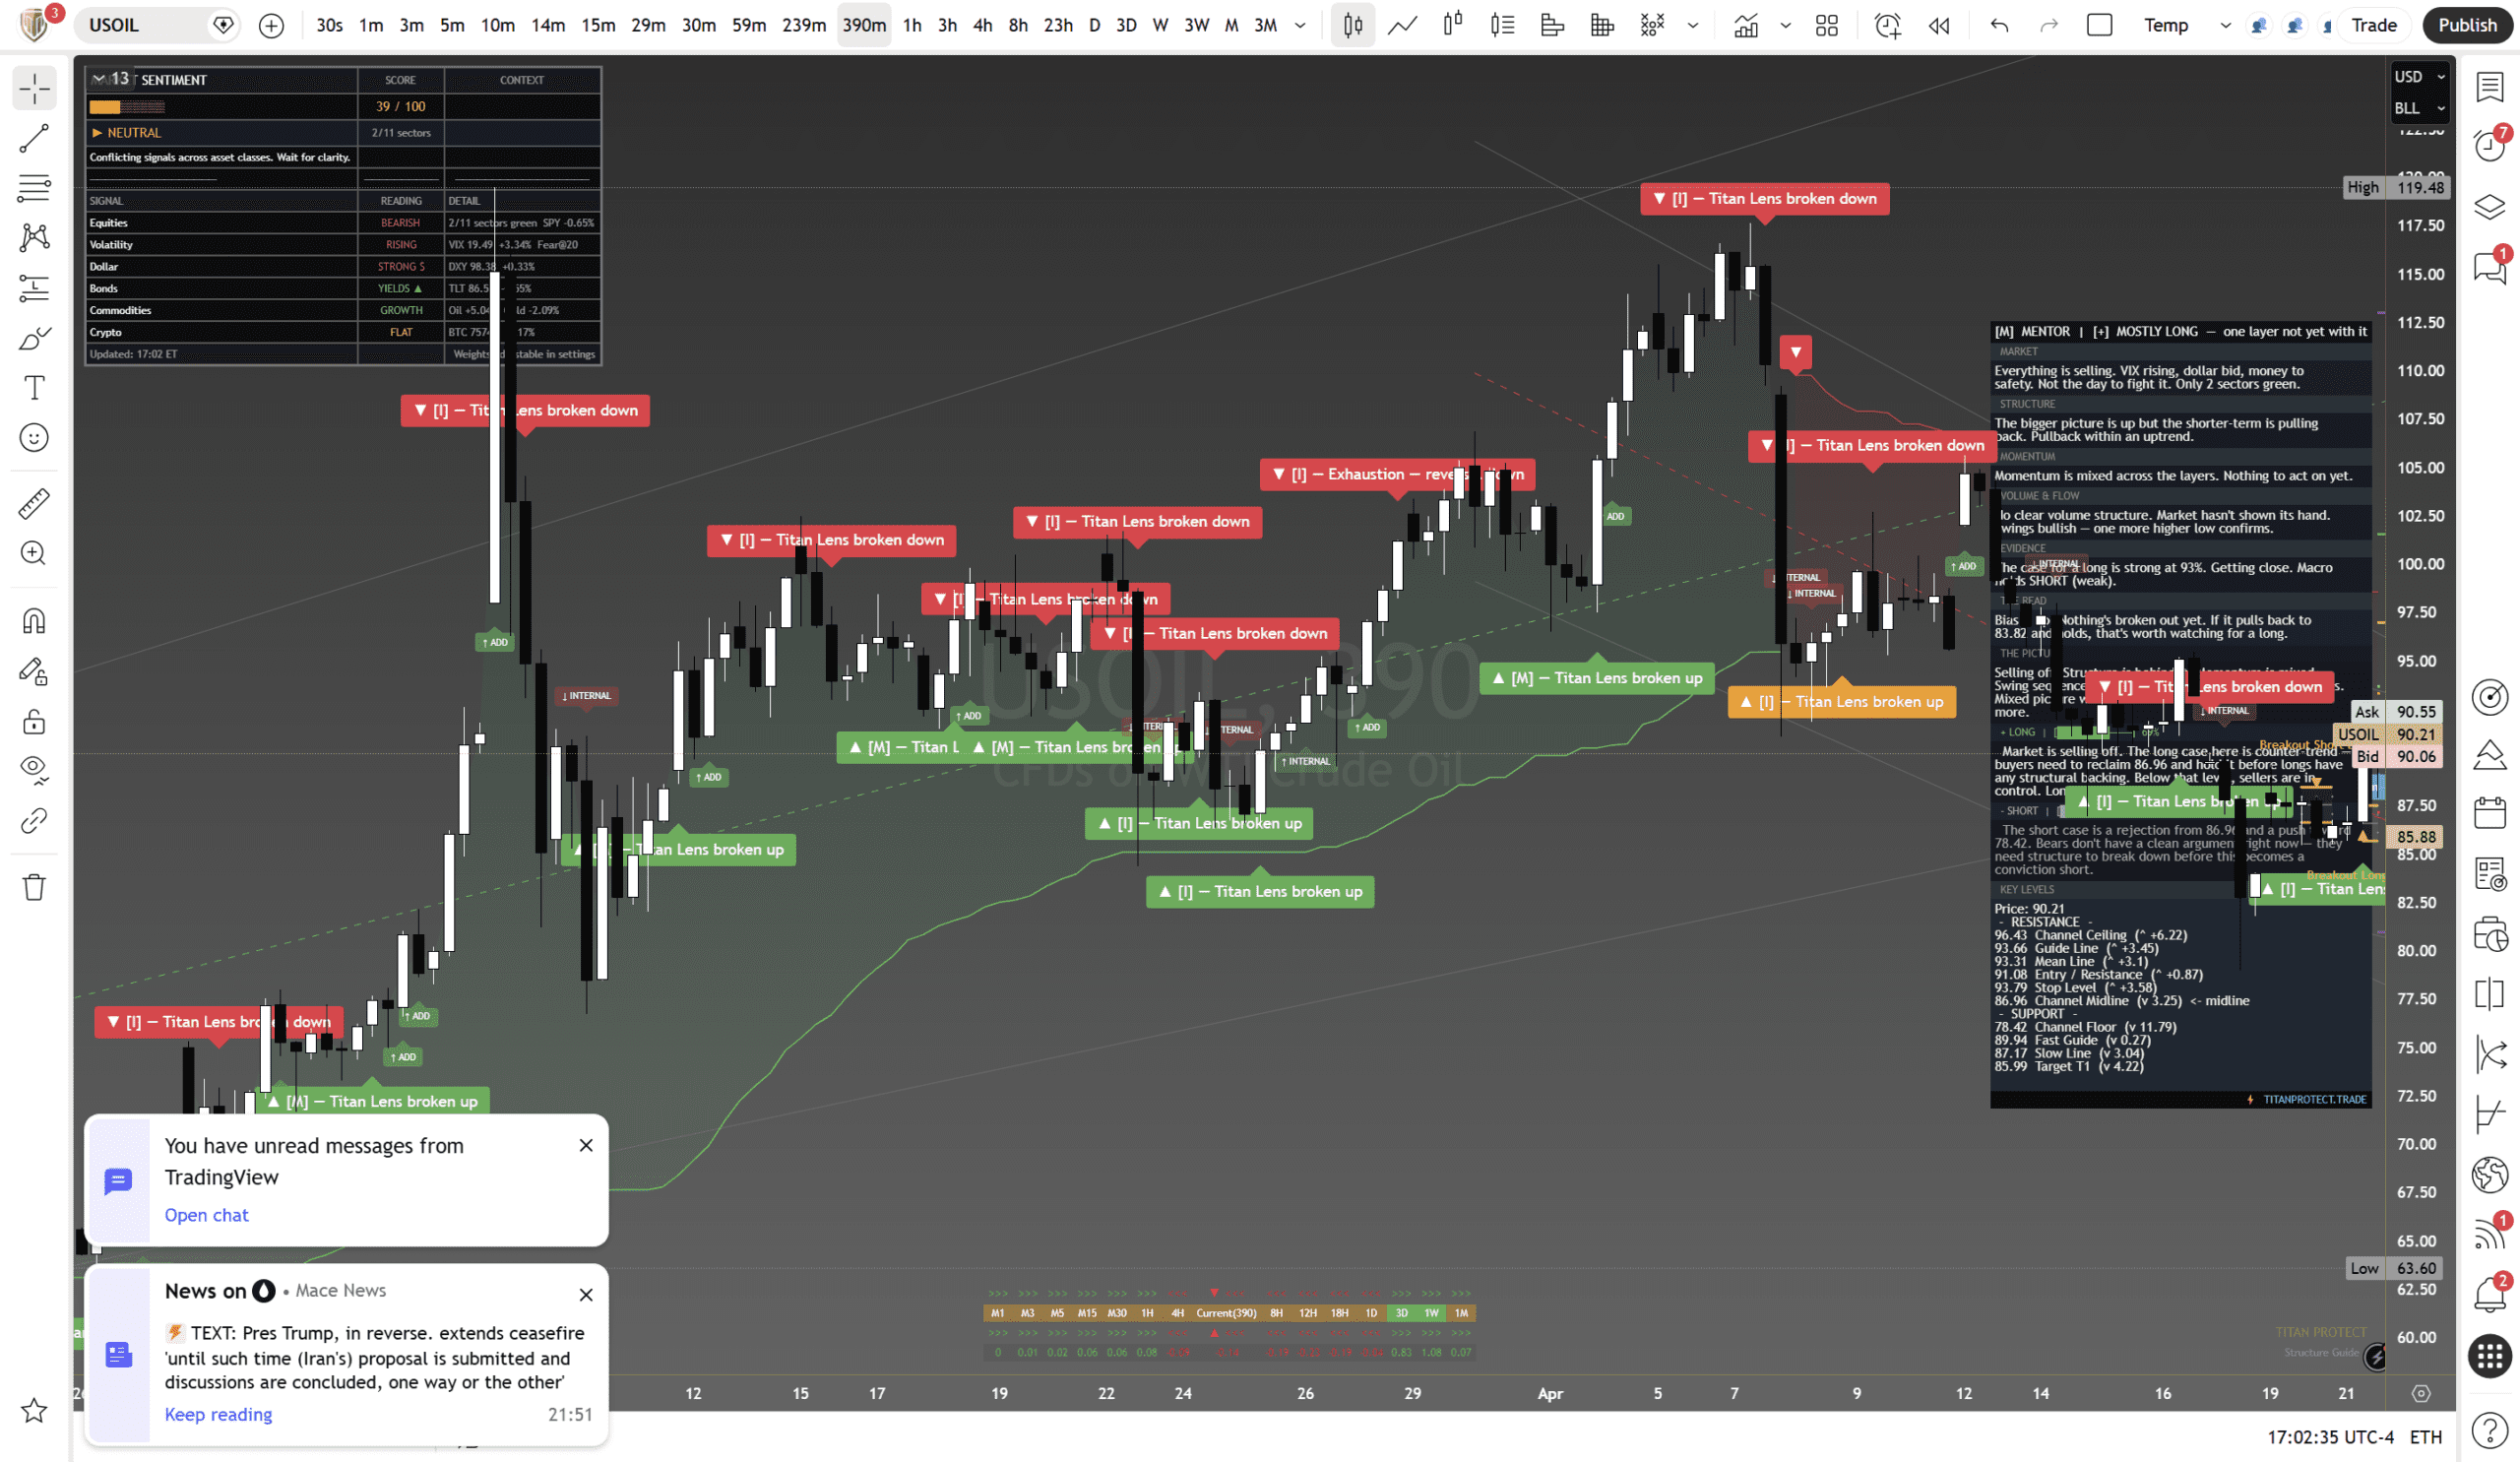
Crude rallied over 2% — the standout performer across all asset classes. Hormuz headlines are supporting a geopolitical bid. The trend is up and structure confirms on the daily timeframe. The intraday pullback is a natural retracement after a strong move. The question is whether the geopolitical bid holds or fades overnight.
Structure
The bigger picture is up and structure confirms on the daily. The intraday is pulling back — a natural retracement after a strong move. Structure is behind longs on the bigger timeframe.
Momentum and Flow
Mixed across the layers. Strong at the macro level. Pushing higher but getting close to exhaustion on the shorter frames. Not fully committed yet.
Buying broken out. This is a pullback to value with strong underlying demand. Good entry if structure confirms.
The Two Cases
Trend is up. Structure confirms. Geopolitical bid from Hormuz tensions. The pullback is a buying opportunity if the channel floor holds. Macro favours longs.
Counter-trend. Exhaustion after a strong move higher. Risk is limited — shorts here are fighting the trend and the geopolitical backdrop. Not a conviction play.
Key Levels
| Resistance | 94.70 | Channel Ceiling |
| Resistance | 93.50 | Fast Guide |
| Pivot | 92.16 | Entry / Resistance |
| Support | 91.24 | Current Price |
| Support | 89.60 | Mean Line |
| Support | 87.50 | Channel Floor |
Market Context
Crude +2.39% ($91.75). Hormuz tensions escalating. API inventories due Wednesday. Risk-off elsewhere but energy is the exception.
Analysis from our institutional research desk. Educational content only — not financial advice. Market data as of 21 April 2026. Past performance is not indicative of future results. All trading involves risk — manage yours. Independent analysis — no affiliation with any broker. Always do your own research before trading.