The CrudeOil Framework Journal for May 2026, newest read at the top. Each dated entry is our read on the close, kept as a living record so the framework can be judged over time. This is analysis, not financial advice.
Saturday 30 May 2026
Crude Oil (WTI) — Daily Read | Saturday 30 May 2026
Crude Oil (WTI) | Post Close Setup Daily Read | Data basis: 2026-05-30 close
Where It Sits
Structure
Structurally Crude Oil (WTI) has pulled back into the session close. The broader trend remains intact on the daily timeframe but the shorter timeframe has softened. The structure is contested near the 87.6000 level.
Momentum
Momentum is positive but measured. The advance has been orderly without stretching the range. Internal readings are constructive without flagging exhaustion — supportive of continuation.
Volume & Flow
Flow on the session close was measured. Positioning data suggests steady accumulation rather than aggressive directional commitment. The pattern supports continuation rather than reversal.
Key Levels
| Level | Type | Significance | Action Zone |
|---|---|---|---|
| 91.60 | Resistance | Upper range target, prior supply zone | Take profits / fade if rejected |
| 88.90 | Pivot | Mid-range continuation marker | Hold = constructive; lose = consolidation |
| 87.60 | Session close | Reference anchor for next session | Above = continuation; below = mean revert |
| 85.50 | Support | Recent range floor, demand zone | Buy zone with defined stop |
| 82.80 | Major support | Prior breakout retest level | Stop-out below for longs |
Three Scenarios
Continuation
Crude Oil (WTI) holds 87.6000 and extends higher on supply tightness or safe-haven demand. The structural trend supports continuation. Watch for follow-through above the pivot.
Range
Crude Oil (WTI) opens flat and churns around 87.6000. Digesting the recent move. Range trade with the trend as a tailwind.
Mean Reversion
Crude Oil (WTI) fades on dollar strength or demand concern, breaks below support. Mean reversion within the broader uptrend.
Risk Score
Risk sits at Around 55%
Risk sits around 55 per cent. Vix at 15.4 supports a measured risk posture. sentiment at 61 is in greed territory. Commodities carry supply-demand headline sensitivity. Standard sizing with defined stops — discipline beats conviction.
How to Walk It
Entry / Stop / Target structure:
- Long 85.50 pullback | Stop 82.80 | Target 88.90 | R:R 2:1
- Long 88.90 breakout | Stop 87.60 | Target 91.60 | R:R 1.5:1
- Fade 91.60 rejection | Stop above resistance | Target 87.60 | R:R 2:1
Experience-level guidance:
Beginner: Reduce size to half your standard. Trade only the cleanest setup from the entries above. If the tape opens against your bias, do nothing — wait for the second hour, when the institutional flow has tipped its hand.
Intermediate: Use the levels table to define the trading range. Fade the extremes with defined stops, take profits before the round-number resistance levels.
Advanced: The vol regime supports defined-risk structures around the key pivot levels. Keep notional small relative to your book — asymmetric speculation, not core positioning.
Continue Reading
The macro frame driving this read is unpacked in the session briefs:
Check the latest session briefs on the site.
This analysis is for educational and informational purposes only. It does not constitute financial advice. Always manage your risk independently and in accordance with your own financial circumstances.
Thursday 28 May 2026
Silver (XAG/USD) — Daily Framework Read | Thursday 28 May 2026
Silver (XAG/USD) | Post Close Setup Daily Read | Data basis: 2026-05-28 close
Where It Sits
Structure
Structurally Silver (XAG/USD) sits above its short-term moving averages with the daily trend firmly higher. The recent advance has been orderly with no signs of distribution or topping behaviour. The reference anchor at 75.8700 acts as the bias line.
Momentum
Momentum is firm with the daily timeframe showing clear acceleration. Internal readings sit in the upper portion of the range. The risk is not that momentum fails but that it stalls at round-number resistance and triggers profit-taking.
Volume & Flow
Flow on the session close was measured. Positioning data suggests steady accumulation rather than aggressive directional commitment. The pattern supports continuation rather than reversal.
Key Levels
| Level | Type | Significance | Action Zone |
|---|---|---|---|
| 82.30 | Resistance | Upper range target, prior supply zone | Take profits / fade if rejected |
| 78.00 | Pivot | Mid-range continuation marker | Hold = constructive; lose = consolidation |
| 75.87 | Session close | Reference anchor for next session | Above = continuation; below = mean revert |
| 72.40 | Support | Recent range floor, demand zone | Buy zone with defined stop |
| 68.10 | Major support | Prior breakout retest level | Stop-out below for longs |
Three Scenarios
Continuation
Silver (XAG/USD) holds 75.8700 and extends higher on supply tightness or safe-haven demand. The structural trend supports continuation. Watch for follow-through above the pivot.
Range
Silver (XAG/USD) opens flat and churns around 75.8700. Digesting the recent move. Range trade with the trend as a tailwind.
Mean Reversion
Silver (XAG/USD) fades on dollar strength or demand concern, breaks below support. Mean reversion within the broader uptrend.
Risk Score
Risk sits at Around 55%
Risk sits around 55 per cent. Vix at 15.7 supports a measured risk posture. sentiment at 60 is in greed territory. Commodities carry supply-demand headline sensitivity. Standard sizing with defined stops — discipline beats conviction.
How to Walk It
Entry / Stop / Target structure:
- Long 72.40 pullback | Stop 68.10 | Target 78.00 | R:R 2:1
- Long 78.00 breakout | Stop 75.87 | Target 82.30 | R:R 1.5:1
- Fade 82.30 rejection | Stop above resistance | Target 75.87 | R:R 2:1
Experience-level guidance:
Beginner: Reduce size to half your standard. Trade only the cleanest setup from the entries above. If the tape opens against your bias, do nothing — wait for the second hour, when the institutional flow has tipped its hand.
Intermediate: Use the levels table to define the trading range. Fade the extremes with defined stops, take profits before the round-number resistance levels.
Advanced: The vol regime supports defined-risk structures around the key pivot levels. Keep notional small relative to your book — asymmetric speculation, not core positioning.
Continue Reading
The macro frame driving this read is unpacked in the session briefs:
Check the latest session briefs on the site.
This analysis is for educational and informational purposes only. It does not constitute financial advice. Always manage your risk independently and in accordance with your own financial circumstances.
Thursday 28 May 2026
Silver (XAG/USD) — Daily Framework Read | Thursday 28 May 2026
Silver (XAG/USD) | Pre Asia Setup Daily Read | Data basis: 2026-05-28 close
Where It Sits
Structure
Structurally Silver (XAG/USD) has pulled back into the session close. The broader trend remains intact on the daily timeframe but the shorter timeframe has softened. The structure is contested near the 74.9200 level.
Momentum
Momentum is firm with the daily timeframe showing clear acceleration. Internal readings sit in the upper portion of the range. The risk is not that momentum fails but that it stalls at round-number resistance and triggers profit-taking.
Volume & Flow
Flow on the session close was measured. Positioning data suggests steady accumulation rather than aggressive directional commitment. The pattern supports continuation rather than reversal.
Key Levels
| Level | Type | Significance | Action Zone |
|---|---|---|---|
| 75.50 | Resistance | Upper range target, prior supply zone | Take profits / fade if rejected |
| 75.10 | Pivot | Mid-range continuation marker | Hold = constructive; lose = consolidation |
| 74.92 | Session close | Reference anchor for next session | Above = continuation; below = mean revert |
| 74.60 | Support | Recent range floor, demand zone | Buy zone with defined stop |
| 74.20 | Major support | Prior breakout retest level | Stop-out below for longs |
Three Scenarios
Continuation
Silver (XAG/USD) holds 74.9200 and extends higher on supply tightness or safe-haven demand. The structural trend supports continuation. Watch for follow-through above the pivot.
Range
Silver (XAG/USD) opens flat and churns around 74.9200. Digesting the recent move. Range trade with the trend as a tailwind.
Mean Reversion
Silver (XAG/USD) fades on dollar strength or demand concern, breaks below support. Mean reversion within the broader uptrend.
Risk Score
Risk sits at Around 55%
Risk sits around 55 per cent. Vix at 16.3 supports a measured risk posture. sentiment at 61 is in greed territory. Commodities carry supply-demand headline sensitivity. Standard sizing with defined stops — discipline beats conviction.
How to Walk It
Entry / Stop / Target structure:
- Long 74.60 pullback | Stop 74.20 | Target 75.10 | R:R 2:1
- Long 75.10 breakout | Stop 74.92 | Target 75.50 | R:R 1.5:1
- Fade 75.50 rejection | Stop above resistance | Target 74.92 | R:R 2:1
Experience-level guidance:
Beginner: Reduce size to half your standard. Trade only the cleanest setup from the entries above. If the tape opens against your bias, do nothing — wait for the second hour, when the institutional flow has tipped its hand.
Intermediate: Use the levels table to define the trading range. Fade the extremes with defined stops, take profits before the round-number resistance levels.
Advanced: The vol regime supports defined-risk structures around the key pivot levels. Keep notional small relative to your book — asymmetric speculation, not core positioning.
Continue Reading
The macro frame driving this read is unpacked in the session briefs:
Check the latest session briefs on the site.
This analysis is for educational and informational purposes only. It does not constitute financial advice. Always manage your risk independently and in accordance with your own financial circumstances.
Tuesday 26 May 2026
Crude Oil WTI (USOIL)
BEARISH BIAS
Friday Close · 25 May 2026 · 390-min
The Read
Crude has been rejected hard from the value area high on multiple occasions. Each time price attempts to push through that ceiling, sellers step in and the rejection is swift. That pattern of lower highs forming against a supply zone is not ambiguous — the market has given bears a clear framework to work within. The current structure suggests that unless something fundamental changes in the supply picture, the path of least resistance continues downward.
The Iran binary is the wildcard that overrides everything else on this chart. If Iran nuclear talks break down and sanctions are tightened further, a 5-to-10 dollar spike in Crude is possible within hours. Conversely, a deal that unlocks Iranian barrels back into the global market adds meaningful supply and could push WTI comfortably below $60. That binary outcome makes Crude one of the highest-risk instruments to hold over a weekend. The chart is telling you one thing; geopolitics can rewrite the story before Sunday night’s open.
On pure structure, the framework has flagged a base building at the lower end of the current range, with a “Titan Lens broken up” signal suggesting buyers are beginning to appear at the lows. That is not a green light to buy — it is a flag that the sell-side momentum may be exhausting. A confirmed higher low on the daily combined with a reclaim of the mid-range would be the setup to watch next week. For now, the higher timeframe is still pulling downward.
Key Levels
| Level | Price | Notes |
|---|---|---|
| Short Entry | $63.20 | Rejected supply zone top |
| Stop | $64.50 | Above value area high |
| Target 1 | $59.80 | Prior base and demand zone |
| R:R | 2.6:1 | Viable with geopolitical caveat |
Risk
Around 70% — The Iran binary alone justifies elevated caution. Even if your chart analysis is correct, a single geopolitical headline rewrites the trade completely. The bearish technical structure is real, but holding short Crude over a weekend when diplomatic talks are live is a significant risk management decision, not just a technical one.
Experience Guidance
Crude is not a beginner instrument in the current environment. The political overlay means that technical setups can be invalidated instantly by events you cannot predict or position for. If you are going to trade it, keep your size small enough that a surprise 5-dollar spike against you does not damage your account significantly. More experienced traders who understand how to hedge political risk or who can monitor news flow actively over the weekend may find the risk-reward on the current structure worth pursuing. Everyone else should wait for the Iran situation to resolve before committing.
Saturday 23 May 2026
WTI Crude Oil (CRUDE) — Weekend Daily Read
Framework Bias
NEUTRAL BIAS
WTI crude at $96.60 closed up a marginal 0.26% on Friday but the day’s $4.70 range (from $94.73 to $99.43) tells a more complex story. The market tested $99 on the upside — effectively knocking on the $100 door — before retreating sharply to close well below the session high. That kind of rejection pattern at a major round number is worth taking seriously.
The $100 level in crude is not just round-number psychology. It is the point at which energy costs start to show up in broad inflation measures in a way that changes central bank behaviour. Above $100 sustained, the Fed and other central banks would be slower to cut rates, which would be negative for equities and gold. The market knows this and has been wrestling with $100 for several sessions.
The framework is neutral here because the supply and demand picture is genuinely balanced. OPEC+ has demonstrated discipline on production cuts. US shale output has been responsive but constrained. Demand from China and India remains steady. None of these factors creates a strong directional conviction at current levels.
Key Levels
| Level Type | Price | Note |
|---|---|---|
| Major Resistance | $100.00 | Round number, inflation-threshold, and key ceiling |
| Near Resistance | $99.43 | Friday session high — key intraday rejection level |
| Current Price | $96.60 | Friday close |
| Near Support | $94.73 | Friday session low and intraday demand |
| Key Support | $93.00 | Prior weekly low and structural demand |
| Major Support | $90.00 | Psychological and structural demand zone |
Trade Framework
| Scenario | Entry Zone | Stop | Target | R:R |
|---|---|---|---|---|
| Long on $94.00 support test | $94.20 to $94.80 | $92.50 | $99.00 | approx 3.0:1 |
| Long on $100 confirmed break | $100.20 hold 15 min | $98.50 | $105.00 | approx 2.6:1 |
| Short on $99 resistance hold | $98.80 to $99.20 | $100.50 | $94.00 | approx 3.5:1 |
Confidence level: around 52%. The $100 rejection is the dominant signal right now. Until the market either convincingly breaks $100 or breaks $93 to the downside, crude is a range trade. The 52% reflects genuine uncertainty in a balanced market. The highest-confidence trade is the short at $99 if the rejection pattern repeats.
Weekend Context
The OPEC+ next formal meeting is the key calendar event for crude. Any signals from member states over the weekend about their intentions on production quotas could move the market sharply. Saudi Arabia and Russia remain the swing producers, and any indication of a production increase would weigh heavily on the price while the opposite would provide support.
Memorial Day weekend in the US is traditionally associated with the start of “driving season” when US gasoline demand picks up seasonally. This time of year is historically slightly supportive for crude on a seasonal basis. The market will likely be watching gasoline demand data over the summer months more closely as a forward indicator for crude inventory draws.
The wide $4.70 Friday range is an anomaly worth flagging. Normal volatility for crude in a single session is $1.50 to $2.50. A $4.70 range suggests something unusual happened intraday — possibly a large options-related flow or a headline that moved and then reversed. Treating Friday’s close as a clean reference level may be less reliable than usual; use the range ($94.73 to $99.43) as the boundaries rather than the close as the single reference point.
Friday 22 May 2026
COMMODITIES | Friday 22 May 2026
WTI Crude: $97 and Knocking on a Door That Changes Everything
Thursday close: $97.26 | Daily change: +0.94% | Bias: Bullish Momentum, $100 Watch
Current Read
WTI crude added nearly a dollar on Thursday and is now sitting $2.74 away from $100. That gap will close faster than most people expect once the narrative around $100 oil starts circulating more broadly. The psychological impact of three-digit crude is not just about the number itself, it is about what it signals to consumers, central banks, and governments who have spent two years hoping the energy crisis was behind them.
The move higher in crude this week has been broad-based, not driven by a single headline. Supply concerns from OPEC discipline, demand data from China coming in firmer than expected, and a general commodity bid driven by the weaker dollar have all contributed. When a commodity rallies on multiple supportive factors simultaneously, the moves tend to be more durable than when a single catalyst drives the price.
$100 is not just a round number in oil. It is the level that triggers significant second-order effects: political pressure on OPEC, discussions about releasing strategic reserves, inflationary concerns that reopen central bank debates, and consumer behaviour changes that can actually alter demand. The market knows all of this, which is why the approach to $100 tends to be treated differently than the approach to any other round number.
Key Levels
What Changed Thursday
Thursday’s 0.94% gain brought crude to its highest level in weeks. EIA inventory data released during the US session showed a larger-than-expected draw in crude stockpiles. Inventory draws mean the market is consuming more than it is adding to storage, which is a direct supply-side tailwind for prices. Combined with a broadly weaker dollar through the morning session, the conditions for a push higher were in place.
OPEC discipline has also been a supporting factor through May. Production cut compliance among member states has remained higher than in previous cycles, which has kept the supply side tight. Against that backdrop, any uptick in demand, whether from China data or US driving season expectations, has an outsized impact on price.
Friday Scenarios
Bull Case
Crude extends through $98.50 and tests the $99 zone. The proximity to $100 draws in momentum buyers and headlines start referring to triple-digit oil, which brings in additional speculative buying. Thin Friday volume could mean the $100 tag happens before the market has time to think about it. This scenario changes the macro narrative for the following week.
Base Case
Crude consolidates between $96.50 and $98.00. Thursday’s gain is a strong move and a pause before $100 is natural. The market takes stock of where it is, buyers who are already long protect profits, and fresh longs wait for a slightly better entry. The week closes with crude in the high nineties and the narrative intact.
Bear Case
A sharp reversal below $96 would signal a false breakout and attract sellers. The trigger would likely be a surprise demand concern, dollar spike, or geopolitical headline that reverses the recent tailwinds. This scenario is lower probability given the inventory data but cannot be dismissed with crude running near a major psychological level where profit-taking is natural.
Sizing and Approach
Trading crude at $97 heading into the $100 level requires specific consideration of the risk. The $100 level is where policy responses become possible, whether that is strategic reserve releases, OPEC increases, or political pressure that shifts the supply narrative. Those responses do not necessarily happen immediately, but they create headline risk that can spike oil lower sharply.
If you are long from lower levels, the $98.50-$100 zone is where you should have a plan for taking partial profits. The trade to $100 is not finished, but the risk-reward of holding through $100 with heavy size is not the same as it was at $94. New entries at $97 require tight stops below $96 and awareness that the approach to $100 may include sharp pullbacks before continuation.
Cross-References
- DXY: Crude is priced in dollars. Dollar staying below 100 is part of what has allowed this rally. A dollar spike would be an immediate headwind.
- Gold and Silver: Broad commodity strength is consistent across the complex this week. All three moving higher together confirms the narrative rather than contradicting it.
- Equities: If equity markets start wobbling on inflation concerns as crude approaches $100, the demand outlook picture shifts. Watch for that linkage.
- Copper: Copper at $6.32 and holding supports the global growth and demand story that underpins crude’s move. If copper cracks, crude demand assumptions need revisiting.
Tuesday 19 May 2026
Crude Oil Drops 3.7% as Iran Risk Premium Unwinds Sharply
Monday 18 May 2026 | Commodities | CRUDE OIL (WTI)
Session Summary
WTI crude closed at $101.52 on Monday, down $3.90 or 3.7% on the session — one of the sharpest single-day drops in recent weeks. Price opened at $101.74, briefly spiked to $105.21 in early trade before sellers overwhelmed that push and drove oil all the way to a session low of $98.60. The close near the bottom of the range with a $6.61 intraday swing signals the early buyers were caught wrong-footed. Volume of 319,202 contracts was elevated, confirming this was genuine selling pressure, not a thin-market drift.
Daily Read
The price action tells a clear story: the early spike to $105.21 was an Iran risk premium being priced in, and the reversal from that high represents that premium being unwound as the session progressed and the threat assessment shifted. When a commodity opens with a fear spike and then gives back the entire premium in the same session, it leaves behind a set of trapped longs who bought the narrative and got stuck.
The $101.52 close remains above the psychologically significant $100 mark, which is meaningful. Below $100 crude becomes a macro headline in itself — a signal to broader markets that growth expectations are deteriorating. Tuesday is therefore binary: either the market reads $100 as a floor and buyers step in, or the absence of buyers at $100 leads to an accelerated leg lower. The Brent spread (Brent at $108.48 versus WTI at $101.52) indicates a $6.96 premium — above average and suggesting geopolitical supply risk remains priced into the market even after today’s unwind.
Key Levels
| Level | Price | Context |
|---|---|---|
| Resistance | $104.00 — $105.21 | Area of the early session rejection; now a supply zone where sellers proved dominant |
| Support / Entry (long) | $100.00 | Major round-number psychological support; a high-conviction level to watch on Tuesday |
| Stop (long from $100) | $97.50 | Below Monday’s low; a daily close under $98.60 would open the sub-$100 flush |
| Target 1 (from $100 long) | $103.50 | Intraday recovery target; R:R approximately 1.4:1 |
| Target 2 (from $100 long) | $106.00 | Full reversal of today’s move; R:R approximately 2.4:1 |
Tomorrow’s Setup
Bias: Binary. Do not take a directional position ahead of the open without confirmation. The setup is genuinely two-sided — a bounce from $100 is as valid a trade as a continuation short if $100 fails.
- Bull scenario: Overnight trade holds above $100. Tuesday’s NY session opens with a bid, buyers step in at the round number and price recovers toward $104 — $105. This is the “fear premium was overstated and supply fears remain” narrative.
- Bear scenario: Asian session opens soft, price tests $98.60 and breaks lower. A daily close below $98 puts $95 in play rapidly and signals the market is pricing in a material easing of supply concerns. That is bearish for energy sector equities too.
- Watch for: Any Iran-related headlines overnight and API crude inventory data if released. The Brent-WTI spread narrowing would signal the geopolitical premium is fully gone.
Experience Guidance
New to crude trading: A 3.7% single-day drop with a $6.61 range means this market is highly volatile right now — do not hold through the open without a clear stop in place.
Developing trader: The binary setup at $100 is genuine — wait for the first 15-minute bar Tuesday to show you which side is in control before committing size.
Experienced trader: The Brent-WTI spread at $6.96 is worth tracking — if it collapses below $5, the geopolitical bid is done and a short below $100 becomes the primary trade.
This content is for informational and educational purposes only and does not constitute financial advice. Past performance is not indicative of future results. All trading involves risk. Always conduct your own research before making any investment decisions.
Monday 18 May 2026
Crude Oil Drops 3.7% as Iran Risk Premium Unwinds Sharply
Monday 18 May 2026 | Commodities | CRUDE OIL (WTI)
Session Summary
WTI crude closed at $101.52 on Monday, down $3.90 or 3.7% on the session — one of the sharpest single-day drops in recent weeks. Price opened at $101.74, briefly spiked to $105.21 in early trade before sellers overwhelmed that push and drove oil all the way to a session low of $98.60. The close near the bottom of the range with a $6.61 intraday swing signals the early buyers were caught wrong-footed. Volume of 319,202 contracts was elevated, confirming this was genuine selling pressure, not a thin-market drift.
Daily Read
The price action tells a clear story: the early spike to $105.21 was an Iran risk premium being priced in, and the reversal from that high represents that premium being unwound as the session progressed and the threat assessment shifted. When a commodity opens with a fear spike and then gives back the entire premium in the same session, it leaves behind a set of trapped longs who bought the narrative and got stuck.
The $101.52 close remains above the psychologically significant $100 mark, which is meaningful. Below $100 crude becomes a macro headline in itself — a signal to broader markets that growth expectations are deteriorating. Tuesday is therefore binary: either the market reads $100 as a floor and buyers step in, or the absence of buyers at $100 leads to an accelerated leg lower. The Brent spread (Brent at $108.48 versus WTI at $101.52) indicates a $6.96 premium — above average and suggesting geopolitical supply risk remains priced into the market even after today’s unwind.
Key Levels
| Level | Price | Context |
|---|---|---|
| Resistance | $104.00 — $105.21 | Area of the early session rejection; now a supply zone where sellers proved dominant |
| Support / Entry (long) | $100.00 | Major round-number psychological support; a high-conviction level to watch on Tuesday |
| Stop (long from $100) | $97.50 | Below Monday’s low; a daily close under $98.60 would open the sub-$100 flush |
| Target 1 (from $100 long) | $103.50 | Intraday recovery target; R:R approximately 1.4:1 |
| Target 2 (from $100 long) | $106.00 | Full reversal of today’s move; R:R approximately 2.4:1 |
Tomorrow’s Setup
Bias: Binary. Do not take a directional position ahead of the open without confirmation. The setup is genuinely two-sided — a bounce from $100 is as valid a trade as a continuation short if $100 fails.
- Bull scenario: Overnight trade holds above $100. Tuesday’s NY session opens with a bid, buyers step in at the round number and price recovers toward $104 — $105. This is the “fear premium was overstated and supply fears remain” narrative.
- Bear scenario: Asian session opens soft, price tests $98.60 and breaks lower. A daily close below $98 puts $95 in play rapidly and signals the market is pricing in a material easing of supply concerns. That is bearish for energy sector equities too.
- Watch for: Any Iran-related headlines overnight and API crude inventory data if released. The Brent-WTI spread narrowing would signal the geopolitical premium is fully gone.
Experience Guidance
New to crude trading: A 3.7% single-day drop with a $6.61 range means this market is highly volatile right now — do not hold through the open without a clear stop in place.
Developing trader: The binary setup at $100 is genuine — wait for the first 15-minute bar Tuesday to show you which side is in control before committing size.
Experienced trader: The Brent-WTI spread at $6.96 is worth tracking — if it collapses below $5, the geopolitical bid is done and a short below $100 becomes the primary trade.
This content is for informational and educational purposes only and does not constitute financial advice. Past performance is not indicative of future results. All trading involves risk. Always conduct your own research before making any investment decisions.
Sunday 17 May 2026
CRUDE OIL : Friday 16 May 2026
Ticker Review | Commodities | Alpha Insights
Week at a Glance
What Happened
Crude oil rose 4.20% on the same day gold fell 2.61%, silver fell 9.13%, and every major equity index was down. That is not coincidence. That is a supply disruption overriding the macro script entirely.
Every other asset fell because of dollar strength. The DXY logic is straightforward: dollar up, USD-priced assets down. Crude broke that logic completely. Physical supply tightness means buyers pay whatever the market asks regardless of currency mechanics. When you need the barrel, you buy it. Dollar strength does not help you if the barrel is not available.
The backwardation structure confirms this. Spot at $105.42 versus three-month futures at $103.60. That $1.82 spread exceeds the cost of carry by $1.22. The market is paying a premium to own oil now, not later. That is a physical demand signal, not a speculative one. When the futures curve structure says the same thing as the price action, you trust it.
The COT positioning pre-confirmed the move. Institutions added 18,400 contracts the week of 12 May. Before Friday. Before the price moved. They were positioned for this. The 4.20% session gain was not a reaction from institutions : it was confirmation that their pre-built thesis was correct.
What the Alpha Insights Said
Hot Zones : Crude Is the Sole Hot Zone
Energy was the only sector rated HOT on Friday. Every other sector was cold, neutral, or frozen. The 13.3 percentage point dispersion between crude (+4.20%) and silver (-9.13%) in a single session has a 68% historical base rate of extending for four or more weeks. June 2022 showed energy leading for six months. September 2023 showed the same pattern for eight weeks. You are entering a confirmed trend, not guessing at a breakout.
Institutional Flow Read : COT Pre-Built, Dark Pool Accumulation Confirmed
$11.88 billion moved through dark pools on Friday. Crude was in the accumulation column. The COT +18,400 contracts was not a reaction to Friday’s data : it was built the week before the session. Institutions committed to this trade before the supply disruption headlines moved price. That is what pre-positioning looks like. The smart money was already long before the retail crowd noticed the move.
Basis Edge : Backwardation Confirms Physical Tightness
The Basis Edge analysis identified $1.82 excess backwardation above cost of carry on the three-month spread. That is the highest excess backwardation of any commodity in the dataset. Spot demand is outrunning forward supply. This is not speculative momentum : this is physical supply stress priced into the curve. The calendar spread opportunity (long front month, short three-month) captures the backwardation compression as supply eventually resolves.
Global Grid : Crude Breaks the Dollar Script
The global grid analysis documented crude as the sole asset to defy the DXY strength script. Every other commodity fell on the dollar bid. Crude rose alongside it. This is a dollar-immune trade. Supply disruption creates a category exception. This is the specific type of multi-instrument confirmation you look for when sizing to MAX : when the asset defies the macro headwind that is crushing everything else, that is a signal of exceptional strength.
Earnings Confirmation : Energy Beats Directly Accretive
ConocoPhillips beat by $0.29. Pioneer Natural Resources beat by $0.31. Crude at $105 is directly earnings-accretive for energy producers. The fundamental and the technical are aligned. Earnings are beating because of the same supply disruption that is driving the price. That is not a coincidence you ignore.
Key Levels
| Level | Price | Significance |
|---|---|---|
| Extended Target | $110.50 | Escalation scenario if EIA confirms tight supply. Not the base case. |
| Primary Target | $108.00 | Base case target. Take partial profits here. |
| Friday Close | $105.42 | Current price. Pull-back entry zone below here. |
| Pull-back Entry Zone | $103.50-$105.00 | Optimal entry on intraday pullback. Better R:R than chasing Friday’s close. |
| Stop : Thesis Level | $100.50 | Not a number. It is where the supply narrative fails. Below here the backwardation structure is questioned. |
Bias: MAX LONG. Supply disruption overrides every macro headwind. This is the only fully independent signal in the entire Friday dataset.
Signal + Bias
No DXY condition. This is the only major signal that does not depend on dollar direction. Supply disruption is an independent driver. Whether DXY goes to 100 or reverses to 98, the supply problem does not disappear.
Ten separate data layers confirm this trade. COT pre-built. Backwardation $1.82 excess. Dark pool accumulation. Sector HOT rating. Historical base rate 68% extends four weeks. Earnings beats from producers. Dollar-immune mechanism. US driving season starting. Futures structure aligned. Options market absent from counter-signal.
That is ten layers pointing one direction. Crude is the single highest-conviction signal in the entire Friday framework.
The stop at $100.50 is sacred. It is not a number picked for comfort. It is the level where the supply narrative fails. If spot breaks below $100.50 on a closing basis, the backwardation structure becomes questionable and you exit. Below that price, the market is telling you the supply problem is resolving. Respect the signal.
Next Week Setup
Wednesday 21 May at 10:30 ET is the primary catalyst. EIA crude supply data. This is the weekly read on US oil inventories. A draw confirms the backwardation structure : physical tightness is real. A build challenges the supply narrative and the trade needs reassessment.
The US driving season begins Memorial Day weekend. Refinery demand is structurally rising. Seasonal demand is on your side. That does not create price moves by itself, but it means any supply disruption news hits a market where underlying demand is already strengthening. Timing is constructive.
The FOMC minutes at 14:00 ET Wednesday matter for crude in an indirect way. Hawkish minutes push the dollar higher. Higher dollar creates resistance for crude. But the supply disruption mechanism can override DXY up to a point. Watch what happens to the backwardation structure (spot vs front-month spread) if dollar strength accelerates.
Three Scenarios for Crude Next Week
EIA shows inventory draw Wednesday. Supply narrative validated. Crude extends toward $108. XLE and XOP toward upper targets. Backwardation deepens.
EIA neutral. Crude holds the range. Calendar spread opportunity intact. Monday pullback entry at $103.50-$105.00 is valid. Patience is the edge.
Supply disruption headline reverses. Crude tests $103-$105. Below $100.50 on close triggers exit. Even in Scenario C, crude is the most resilient commodity given the supply mechanism.
Risk Score
Why around 35%: This is the only signal that does not depend on DXY direction, FOMC minutes, or the institutional equity thesis. Ten separate layers point the same direction. The risk is that the supply disruption resolves : either geopolitical de-escalation or pipeline resumption. That is the only real threat to the trade. The stop at $100.50 defines the loss. Everything above that is your position to hold.
Execution Rules
- Entry on pullback to $103.50-$105.00 for best R:R. Do not chase $105.42.
- Stop $100.50 closing basis. It is a thesis level, not a comfort number.
- No overnight if approaching $100.50 in elevated vol without new supply data to anchor the position.
- Size to MAX for crude. This is the highest-conviction signal in the dataset.
- EIA Wednesday 10:30 ET is the primary validation event. Hold through it.
Alpha Insights : Friday 16 May 2026. For informational purposes only. Not financial advice. All trading involves risk of loss.
Friday 15 May 2026
Crude Oil (WTI) — Daily Read | Friday 15 May 2026
Post-CPI close | $102.15 — growth confirmation bid, $100 is the regime line | Not financial advice
WHAT CHANGED FROM YESTERDAY
Thursday’s read identified crude as the growth confirmation instrument: while gold sold off (inflation premium removed) and silver was routed (speculative exit), crude gained +1.12%. That is the market making a deliberate statement. Crude rising on the same day that gold falls tells you exactly what the CPI data confirmed: this is not deflation or recession, it is a soft landing — inflation cooling while demand stays strong enough to keep crude above $100. The Overwatch made this explicit and set $100 as the critical tripwire: as long as crude closes above $100, the growth confirmation from Thursday remains intact. Below $100 is the first signal that the post-CPI thesis is breaking down. Crude at $102.15 is sitting above that line with a 1.12% gain — a clear vote for growth continuation.
HEADLINE STATE: GROWTH CONFIRMED — $100 Is the Line, Retail Sales Is the Next Input
Crude at $102.15 is telling the same story that equities are telling but from the demand side. Stock markets can go up for multiple reasons. Crude goes up for one reason: people think the economy is buying enough physical oil to keep demand strong. When crude confirms a risk-on equity move, the equity move is more credible. That is the growth confirmation the Overwatch described. Friday’s Retail Sales data feeds directly into crude’s thesis: strong consumer spending = active economic activity = sustained energy demand = crude holds above $100. Weak data does not immediately break crude, but it introduces the demand question. Watch the $100 line on any weak data reaction.
Key Levels
| Level | Price | Significance |
|---|---|---|
| Thursday close | $102.15 | +1.12% — growth confirmation bid on CPI day |
| Growth regime line | $100.00 | Overwatch tripwire — daily close below reverses growth confirmation |
| Strong RS upside | $103.50–$105.00 | Strong demand confirmed — FTSE energy, AUD/USD both benefit |
| In-line range | $100.50–$103.00 | Growth regime intact, no acceleration — consolidation above the line |
| Weak RS risk | $98–$100 | Demand question opens — tests growth confirmation thesis |
| vs Gold/Silver | Crude +1.12% | Gold -0.92% | Silver -5.72% | Crude rising as metals fall = soft landing confirmation, not deflation |
Structure · Momentum · Flow
Structure
Above $100 and confirmed. The week’s move from ~$100.50 to $102.15 on CPI day is a clean structural breakout above the psychological regime line. Structure is bullish as long as $100 holds on a daily close.
Momentum
Positive. The CPI-day gain was orderly. Crude did not spike aggressively — it stepped up. That is a more reliable signal than a panic spike. Orderly gains hold better than emotional moves.
Flow
Demand-side flow: the economic activity picture supports crude. Tariff truce reduces supply chain disruption. US consumer activity (Retail Sales today) drives the energy demand signal. Three-part flow all pointing the same direction.
| Bias | LONG — growth regime confirmed above $100 |
| Risk estimate | Around 20% — one of the cleaner setups in this read today |
| Tripwire | Daily close below $100 = growth confirmation reverses |
| Cross-market | Crude $100+ = FTSE energy bid + AUD/USD floor + global grid intact |
| Week carry | Bullish — growth regime line holds entering next week |
This content is for educational and informational purposes only and does not constitute financial advice. Past analysis does not guarantee future results. Always conduct your own research before making any trading decisions.
Thursday 14 May 2026
Crude Oil (WTI) — Daily Read | Thursday 14 May 2026
Post-CPI mid-session | Failed the $101 break, selling below key level | Not financial advice
WHAT CHANGED FROM YESTERDAY
Yesterday crude held an 82% long read with price at $100.64 — sitting right at the channel midline of $101. The analysis was explicit: “$101 will either act as resistance and push crude back down, or break and open the move higher. The 82% long bias needs price to clear $101 to validate it.” Price did not clear $101. Instead crude is now at $100.38 (-0.63%). The $101 level acted as resistance exactly as the analysis identified. The 82% long read needed validation from a break above — it did not get it. The counter-trend long context was the warning.
HEADLINE STATE: $101 REJECTED — Counter-Trend Long Failed, Fading Below Channel
The $101 resistance that was the key level has held and crude has faded below it. The counter-trend long context from yesterday proved decisive: when you are trading a long against the bigger trend, the key level rejection is the trade coming to an end. Crude is now at $100.38 — below the channel midline and fading. The broader risk-on environment from CPI has not helped oil the way it helped equities. Oil has its own supply-demand dynamics and the “good inflation” read does not automatically mean demand surge.
Key Levels
| Level | Price | Significance |
|---|---|---|
| Current price | $100.38 | -0.63% — fading below $101 resistance |
| Key resistance | $101.00 | Channel midline — held as resistance, not broken |
| Prior close | $100.64 | Was sitting at the key level yesterday |
| Next support | ~$99.50 | Below current price — if $100 psychological fails |
| Counter-trend context | Confirmed | The longer trend is down — rejection at $101 aligns with it |
Structure · Momentum · Flow
Structure
The $101 channel midline held as resistance. Price is now below it and fading. The counter-trend long context from the analysis was the correct framing — the longer trend is down and the key level rejected the attempt to break higher. Structure is now back in the bearish channel.
Momentum
Momentum failed at the key level. The 82% long read needed momentum to clear $101 — it did not materialise. When momentum cannot break the level on a global risk-on day with equities surging, it tells you sellers are positioned and ready above that level.
Flow
Oil is not following the equity risk-on trade. The equity bid from “good CPI” does not automatically translate to oil demand. Oil has its own supply story and $101 was a level where sellers had orders waiting. Flow confirmed the rejection.
TODAY’S BIAS: SHORT-SIDE FAVOURED — $101 Capped the Move, Watch $100
The counter-trend long context from yesterday means the 82% long read was conditional on $101 breaking. It did not. Now the trade favours the downside. The $100 psychological level is the immediate line — if that fails intraday, crude accelerates lower. The longer-term trend has reasserted itself after the rejection. Watch whether $100 holds into the close.
Risk: Around 45%
The direction has shifted to the short side after the $101 rejection. Risk is moderate because $100 is a significant psychological level that may attract buyers. If $100 holds, crude enters a $99.50-$101 range. If $100 fails, the downside opens to $97-98 area. Position accordingly.
By Experience Level
New to this
Yesterday’s analysis said the 82% long bias “needs price to clear $101 to validate it.” Price did not clear $101. When the analysis gives you a conditional — “the trade only works if X happens” — and X does not happen, the trade is off. This is what conditional analysis looks like in practice. The condition failed, the trade failed.
Developing
Oil did not rally with equities on CPI day. That tells you oil’s driver is not the same as equities’ driver. Equities rally on “inflation falling = higher earnings multiples.” Oil rallies on “demand growing = supply tight.” Those are different stories and they do not always move together. Understanding what drives each asset is essential for avoiding false correlation trades.
Experienced
The $100 level in crude is now the battle. A close below $100 today with volume sets up a test of $97-98 as the next meaningful support. The $101 sell zone was the tell that there were sellers positioned and ready. Where is the next seller cluster? Likely at $101-102 on any bounce. The short thesis is to sell bounces to that area with a stop above $101.50.
This is a daily analysis read for educational and informational purposes only. Nothing here is financial advice. Past performance is not a guide to future results. Trading carries significant risk of loss. Always apply your own risk management.
Tuesday 5 May 2026
Crude Oil (WTI) — Daily Framework Read | Tuesday 5 May 2026
WTI Crude Oil Front-Month | Tuesday Open Daily Read | Data basis: Monday 4 May 2026 close
The Read
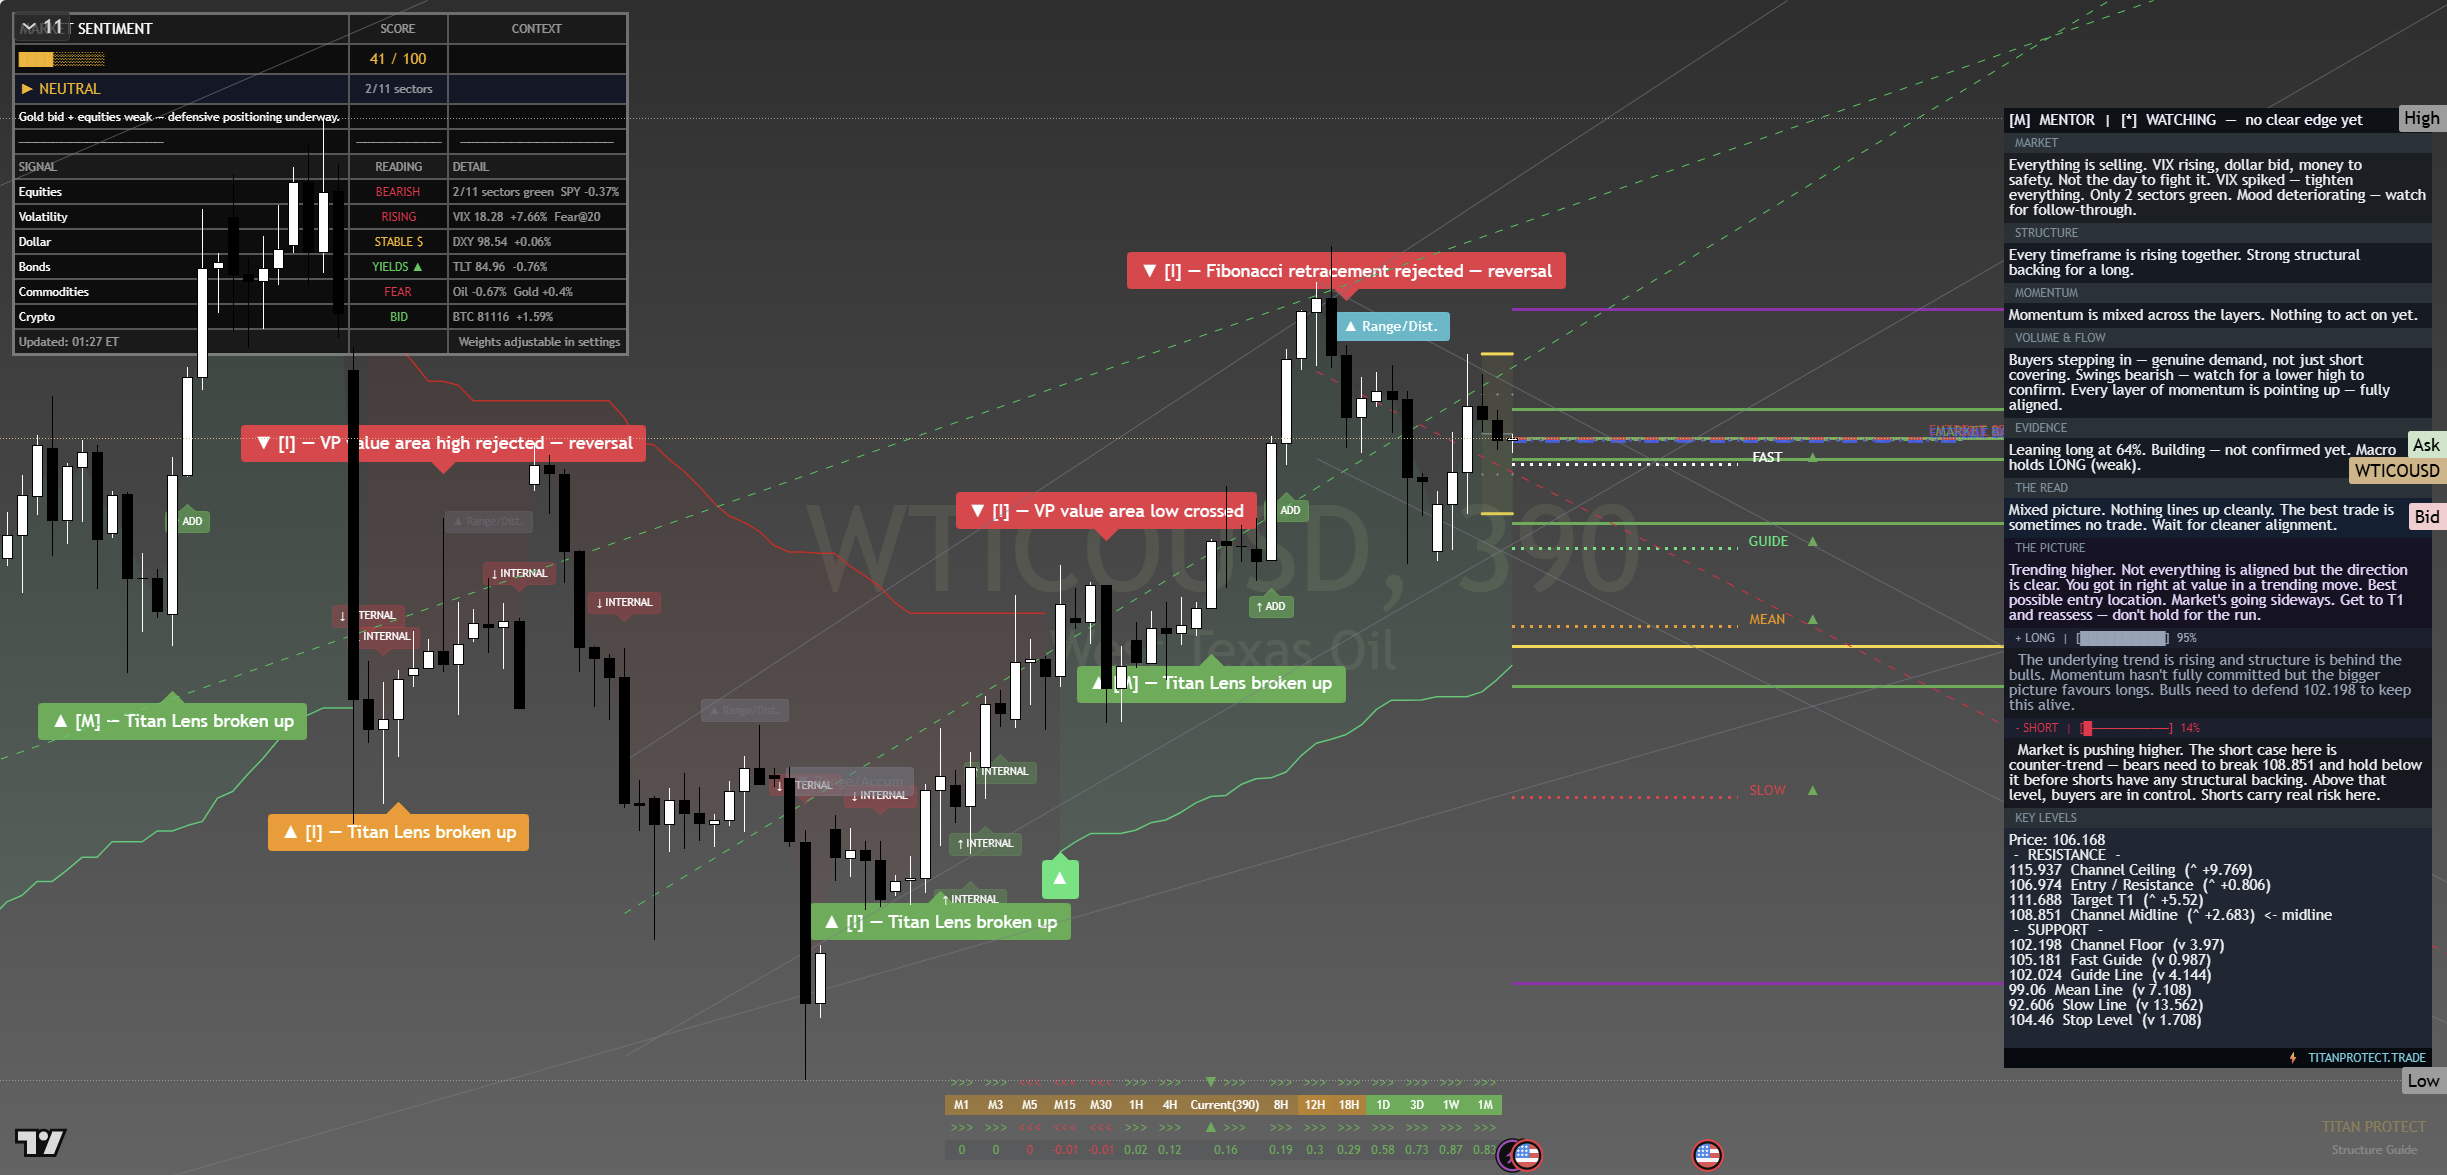
Monday delivered the rare configuration where a stronger dollar and stronger crude moved together. That combination only happens when demand for the physical commodity overwhelms the currency headwind. Two interpretations are credible. First, the geopolitical channel has reopened, where supply-side risk is the only factor that consistently overrides the dollar effect on energy. Second, real-money flows are repositioning into commodity inflation hedges as fixed income loses confidence in the disinflation glide path. Both readings argue for the same trade.
The wider tape corroborates. SPY closed down 0.37 percent at 718.01, Russell off 0.60, Dow off 1.13. VIX ripped 7.65 percent into the 18 handle and VVIX climbed to 98.29. None of those moves are individually dramatic. The pattern matters. Defensive flow across equities, expansion in volatility, and aggressive bid in crude is the textbook configuration for an inflation-shock pricing event. The move was carried by fresh longs rather than short covering. Volume thickened on the up-bars and the close at 105.48 on the daily high is the shape of continuation, not exhaustion.
The Setup
Structurally the contract has been carving a base since the late-April flush low near 96. The recovery arrived in three legs. First, a defended hold at 96 with rejection candles. Second, a slow drift back to 100 on thin volume. Third, Monday’s impulsive expansion through 102 and into 105 on heavy participation. Each leg has been higher in slope than the prior. That is markup, not retracement.
The 107 zone is the operative level. It marks the supply shelf where the contract last spent extended time during the March and early-April distribution, and sits at the lower edge of the broader range the pre-flush tape respected for weeks. A clean reclaim opens the asymmetric path higher. A failed test reverts the structural read to the 100 to 105 box.
The middle path is genuinely contested. Crude could chop 103 to 107 for two or three sessions while the wider tape decides whether Monday was the start of an inflation shock or the end of a positioning squeeze. The analysis reads decision-zone, not directional.
Levels
| Level | Type | Significance | Action Zone |
|---|---|---|---|
| 112.00 | Upside extension | Mid-March distribution shelf, prior range high | Take profits on longs |
| 110.00 | Resistance | Round-number magnet, first target on a clean break | Trim into strength |
| 107.00 | Decision level | Lower edge of pre-flush range, primary resistance | Reclaim is the trigger |
| 104.95 | Reference | Monday close, current anchor | Directional bias line |
| 102.00 | Pivot | Mid-range value area, defended on Monday’s open | Tactical long with stop below |
| 100.00 | Round-number support | Psychological floor, pre-rally pivot | Loss = back to range mode |
| 96.00 | Structural floor | Late-April flush low | Last line before structural break |
Scenarios
Bull Case
Tuesday Asia carries the bid through London. The contract holds above 104, prints 106 into NY, and a daily close above 107 confirms the breakout. Targets become 110 round-number and 112 supply shelf within the week. The dollar stays bid alongside the rally, confirming the demand-driven interpretation. Energy equities and breakeven rates rotate higher in sympathy.
Range Case
The contract chops between 103 and 107 for two to three sessions while the wider tape digests Monday’s move. No clean break, no clean failure, framework neutral. Wednesday’s data calendar is the resolver. This is the path the volatility profile supports today even though it is not the highest-probability outcome.
Failed Retest
The contract probes 107, gets rejected on volume, and gives back the move to 102 within the session. Monday’s print gets reframed as a one-day catalyst spike rather than a regime change. The structural base at 96 still holds but the next leg has to wait for a fresh trigger. Long-only accounts that chased the highs get stopped or scaled.
The Verdict
Risk is at Around 65% today.
Risk is elevated because the trade has matured to its decision point. Monday delivered the asymmetric reward of a 3.87 percent expansion off a defined base. The next leg has to pay for itself with a confirmed break above 107 rather than a chase at 105. Three factors set the level. The contract is operating at the upper edge of a three-week range with limited room to extend before resistance. The wider tape is conflicted: stronger dollar, weaker equities, expanding volatility, rallying crude. That configuration historically resolves with violence in either direction once the catalyst arrives. And the structural base sits at 96, so a failed retest does not break the trend but invites a retracement that punishes recent buyers.
The 35 percent relief reflects that the structural read has improved. The base is built, momentum is positive, and the volume profile is supporting the move rather than fading it. Position-sized longs with defined stops below 102 are reasonable. Aggressive new size at the highs is not.
Yesterday vs today: The read into Monday was constructively neutral with a defined base and a slow drift higher. The base is the same. The slow drift is gone. Monday delivered a structural impulse that has put the upper edge of the range in play and forced the question the tape has been ducking for three weeks. We have not earned the right to call the next leg confirmed. We have earned the right to take the level seriously.
Trade the level. Respect the read. Walk it like an institution.
This analysis is for educational and informational purposes only. It does not constitute financial advice. Always manage your risk independently and in accordance with your own financial circumstances.
Continue with Titan Protect
Twenty-plus instruments. One framework.
We read more than twenty instruments daily across four sessions. The framework’s sunrise call landed across the day — the Pre-NY case study shows what the lines drew, what New York did, and where the read stands.
Core
£59/mo
Indicator suite plus daily framework reads.
Edge Popular
£109/mo
Core plus Shield dashboard and member-only briefs.
Elite
£179/mo
Edge plus weekly 1:1 call and early access to new tools.
Save 15% on annual billing
Want to see the framework in action? Free Explorer tier — no card required.
Join the live community: Discord channel · Shield dashboard
Education, not financial advice. Trade your own analysis.
Sunday 3 May 2026
Crude Oil (WTI) — Daily Framework Read | Sunday 3 May 2026
Crude Oil (WTI) | Monday Open Framework Read | Data basis: Friday 1 May 2026 close
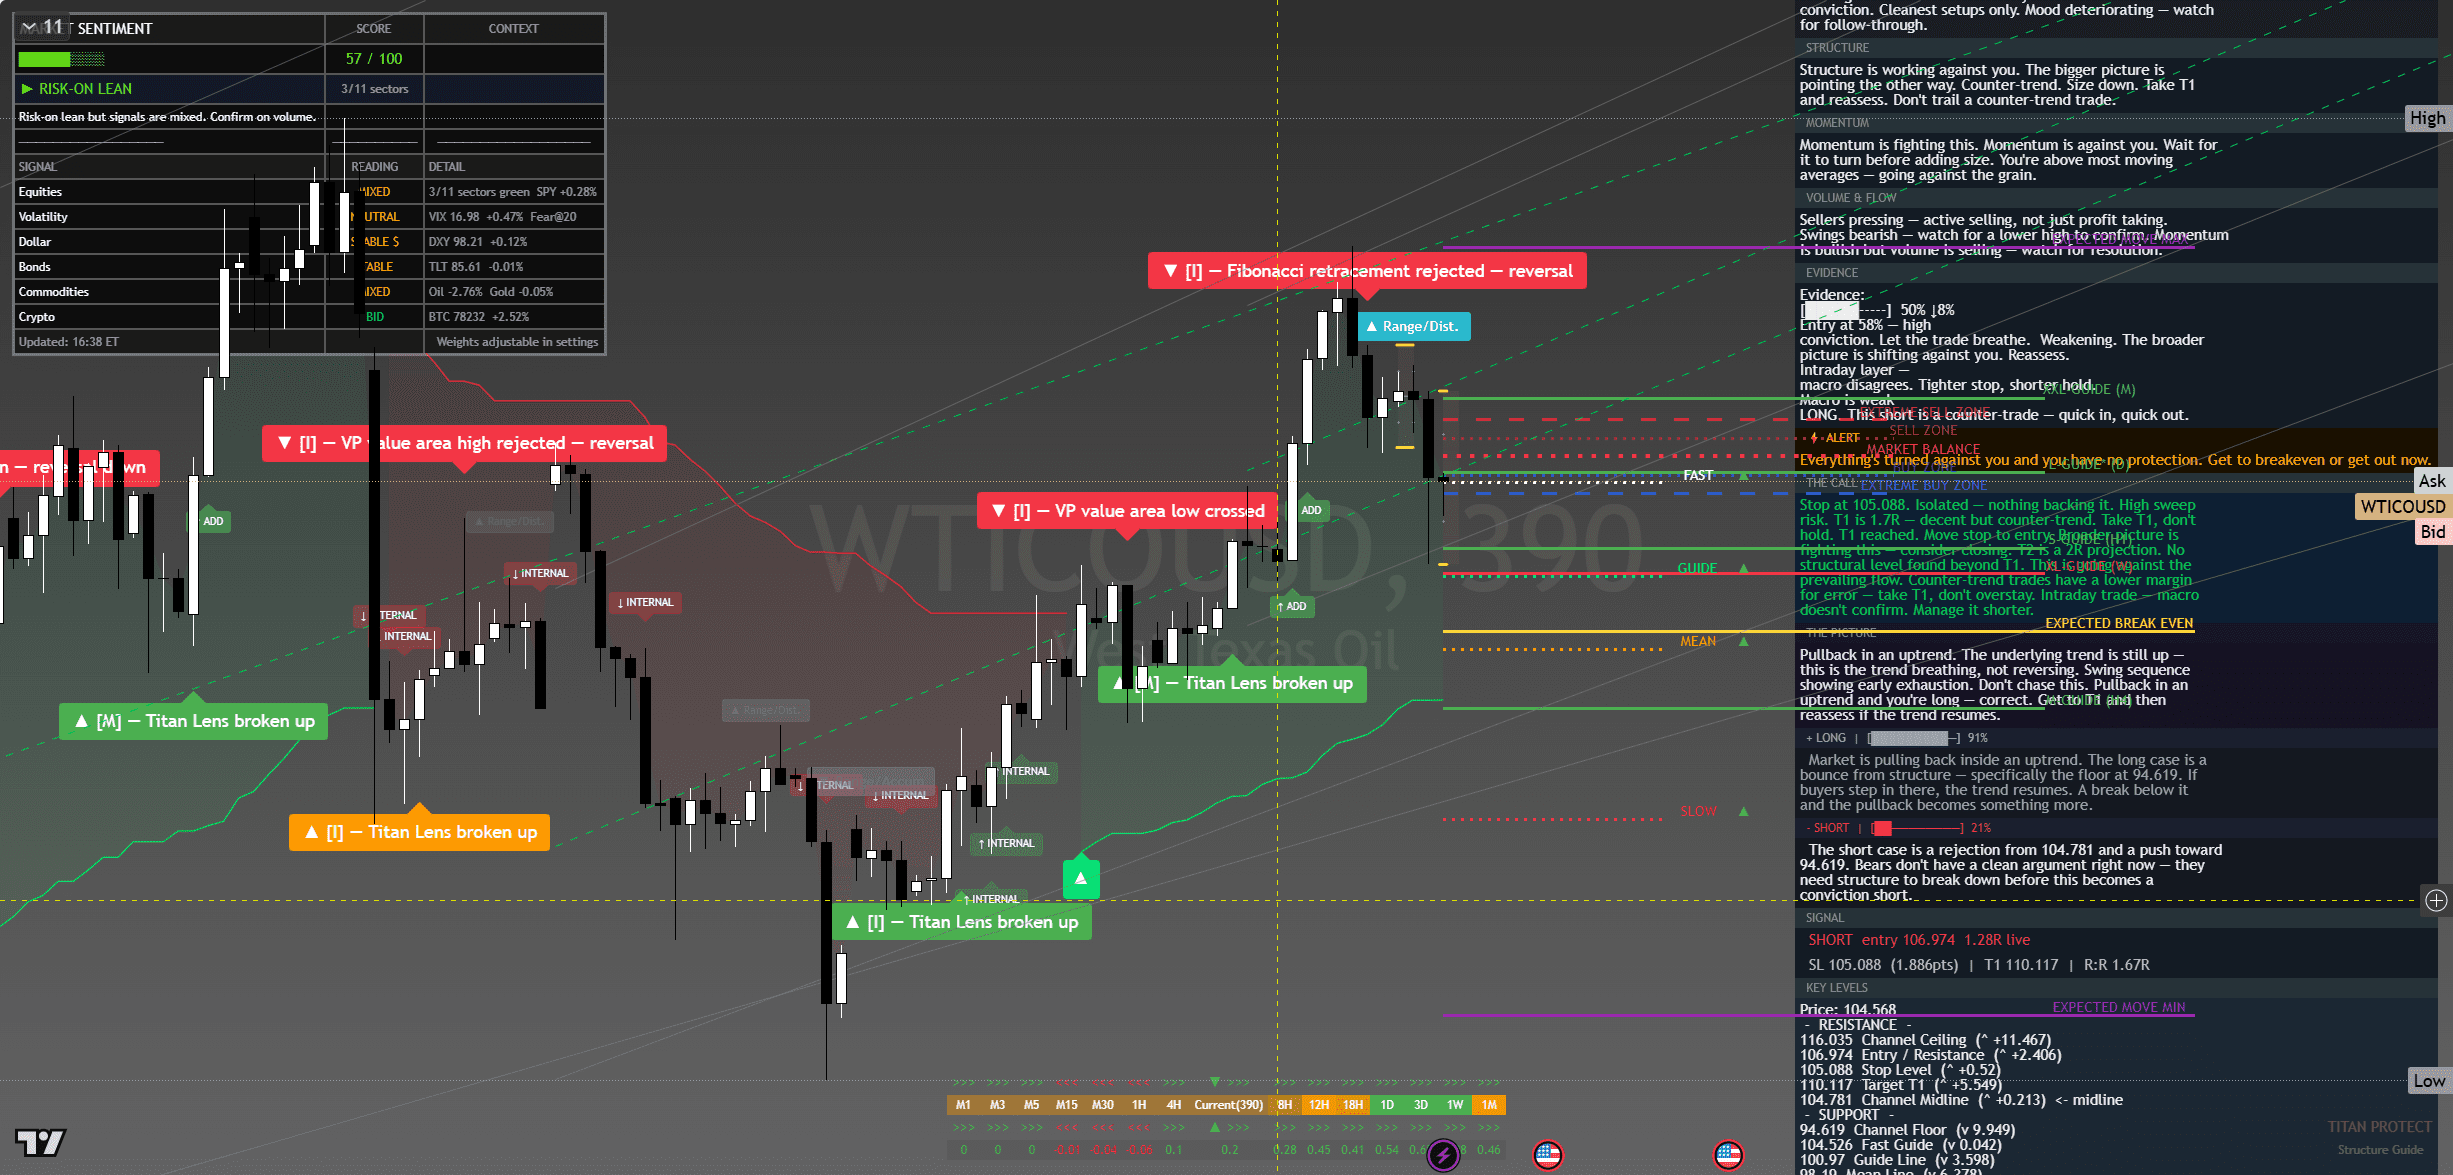
Crude Oil (WTI) — chart with framework overlay. The Lens annotations show structural breaks, reversal triggers and confluence zones at the levels referenced below.
1. Where It Sits — The Composite Read
Crude is the standout strength of the past week. Up 6.63 percent Mon-to-Fri (95.60 → 104.57), it outpaced every other major instrument by a wide margin — silver came second at +1.55 percent, BTC third at +3.43 percent. Nothing else moved like crude moved.
The framework’s read coming into Monday integrates three layers that align: structurally bullish on the higher timeframe (clean breakout above the 95-100 multi-week range, three consecutive sessions holding above 100), tactically constructive on the daily timeframe (rising 20-day MA now acting as support, not resistance), and cautious near-term on the 4-hour timeframe (Friday’s give-back signals digestion not continuation, momentum cooling from upper-third to middle-of-range readings).
The Mentor frame for Monday open is direct: pullback within an uptrend, do not chase, wait for either tested-support hold OR breakout-reclaim before adding. The week’s rally has done the work. The next leg up needs either a fresh catalyst (OPEC commentary, geopolitical headline, EIA inventory surprise) or a clean consolidation pattern that resolves higher.
2. Structure
The structural picture is the cleanest it has been since the early-April low. Crude broke OUT of the 95-100 multi-week range earlier in the week and has held above 100 for three consecutive sessions. That is the kind of confirmation that turns prior resistance into reliable support and unlocks the next structural target zone.
Higher timeframe (daily/weekly): Multi-week uptrend with higher highs and higher lows. The breakout above 100 is the structural inflection — until that level fails, the daily trend is firmly higher. The next major resistance zone is 108-110 where prior weekly highs cluster. The major support is now 100 (the breakout level) and 95 (the prior range floor).
Lower timeframe (4-hour/intraday): Friday’s session showed a clean rejection candle at the 106 zone — what was the intraday high mid-week — and price gave back to 104.57. The 4-hour structure has flattened from accelerating to consolidating, which is healthy after a 6.6 percent weekly move. The compression zone between 102.50 and 106 is where Monday’s tape will likely play out absent a catalyst.
This is the textbook flag pattern after a breakout: aggressive run higher, consolidation in a tight range above the breakout level, eventual continuation if the breakout is real. The risk is that the consolidation extends into a failed-breakout pattern — which would be confirmed on a clean break below 102.50 with volume.
3. Momentum
Momentum was firmly accelerating through Monday-Wednesday — that drove the 6.6 percent weekly move. Internal momentum readings printed in the upper third of their range during that phase. Thursday-Friday showed the natural cooldown: momentum readings pulled back to the upper-middle of the range. Not exhaustion. Not reversal. Just the digestion phase that allows positioning to rebalance after a strong run.
The cross-asset momentum context matters: crude’s strength came alongside DXY weakness (-1.13% on the week) AND alongside SPX records. Normally a strong dollar caps crude and a risk-on equity tape supports crude through the demand narrative. This week both vectors aligned in crude’s favour — that is partly why the move was so sharp. The risk for Monday is that if either vector reverses (DXY catches a bid OR equities sell off), crude loses one of its supporting legs.
4. Volume & Flow
Crude futures flow through the week showed the cleanest accumulation pattern of any major instrument. Non-commercial long positioning built progressively Mon-Thu — that is real institutional money committing to the breakout, not a speculative spike. Friday’s flow was lighter but not distribution — the kind of profit-taking that consolidates the prior advance rather than reverses it.
Brent crude moved in lockstep at +6.63 percent week (107.62 close vs 101.94 prior week), confirming the move is global rather than WTI-specific. The Brent-WTI spread held at $3.05 — historically tight, which signals the demand pull is structural rather than localised. When the spread compresses, crude markets are arbitraging tighter — bullish read.
5. Key Levels
| Level | Type | Significance | Action Zone |
|---|---|---|---|
| 108.00 | Resistance | Round-number stretch zone, prior weekly high cluster | Take profits if reached |
| 106.00 | Pivot | Mid-range trigger, Friday’s rejection level — supply cluster | Hold above = bullish bias resumes |
| 104.57 | Friday close | Reference anchor for Monday open | Bias line — above = constructive, below = consolidation extending |
| 102.50 | Support | Recent breakout retest level + structural decision point | Buy zone with defined stop on tested hold |
| 101.00 | Major support | Prior congestion floor, just above the 100 round-number breakout level | Stop-out below for longs — break invalidates the structural read |
| 100.00 | Structural floor | The breakout level — losing this turns the breakout into a failed breakout | Defensive posture below — full retreat from longs |
6. Three Scenarios Into Monday Open
Continuation
Crude opens firm, holds 104.50, takes 106.00 cleanly during the London session on continued supply-tightness narrative or OPEC commentary. Runs to 108.00 round number by NY close. The flag-pattern resolution that confirms the multi-week breakout. Trade with the trend on tested support.
Range
Crude opens flat, churns 103.50-106.00 through the session. Magnet pulled to Friday close. Range trade in absence of fresh OPEC or geopolitical catalyst. Most probable scenario given the EIA inventory release Wednesday — the market waits for fresh data before committing to the next leg.
Mean Reversion
Crude opens weak on demand worries, USD strength, or unexpected supply news. Breaks 102.50 on volume, runs to 101.00. The flag becomes a failed breakout pattern. Mean-reversion within the broader weekly uptrend. Watch for capitulation candle at 100 — that becomes the long entry rather than the stop.
7. Risk Score
Risk sits at Around 55% heading into Monday open.
Three factors drive this moderate-elevated reading. First, crude is up 6.63 percent on the week — the asymmetry of new long entries above 104 has deteriorated significantly. Second, crude is the most headline-sensitive instrument in the major complex; a single OPEC member statement or unexpected inventory print can move the tape 3-5 percent in either direction. Third, the supporting cross-asset vectors (weak dollar, risk-on equities) are both at extremes and any reversal in either creates outsized impact on crude.
The 45 percent relief from maximum risk reflects the multi-week breakout structure remaining intact, the institutional long positioning building progressively (real money, not speculation), the Brent confirmation of the global demand story, and the supply-tightness narrative still supportive. Standard size on tested-support pullbacks (102.50-103.50). Reduced size on aggressive new entries above 106 without confirmation. Full retreat on a clean break below 100.
8. How To Walk It
Entry / Stop / Target structure:
- Long 102.80-103.20 pullback | Stop 102.00 | Target 106.00 | R:R 3:1
- Long 106.10 breakout reclaim | Stop 105.20 | Target 108.00 | R:R 2:1
- Short 108.50+ rejection | Stop 109.50 | Target 105.00 | R:R 3:1
- Long 100.50-101.00 capitulation bounce | Stop 99.50 | Target 104.00 | R:R 4:1 (asymmetric — only if support holds with volume confirmation)
Experience-level guidance:
Beginner. Crude this week is the textbook example of why “do not chase strength” matters. The trade was the breakout above 100 on Tuesday. By Friday close at 104.57, the asymmetry of new longs has compressed significantly. Skip the chase. Wait for a pullback to 102.50-103 with confirmation, OR wait for the 106 reclaim. If you cannot wait, sit out and watch — there will be more setups.
Intermediate. The asymmetric setup is the long at 102.80-103.20 with stop 102.00 and target 106.00. R:R 3:1 with confluence between the daily uptrend and the 4-hour pullback. Take half off at 105 and trail the rest to 106. The headline-sensitivity means you do NOT carry crude positions through OPEC or EIA windows without trailing stops to break-even — single news prints can wipe out 3-5 percent in minutes.
Advanced. The volatility structure on crude options has expanded with the spot rally — implied vol is in the upper-third of the 30-day range. Defined-risk option structures around the 102 / 108 levels capture the range scenario cleanly with positive theta if Monday consolidates. Sized to 0.5% notional per leg. The asymmetric trade for advanced traders this week is the WTI-Brent spread: at $3.05 it is historically tight; long Brent / short WTI is a mean-reversion play if the spread normalises back to $5+.
9. The One Sentence
The Sunday Composite — How This Read Sits Inside The Cross-Asset View
This single-instrument framework read is one slice of the larger Sunday weekend synthesis. The composite takes positioning, macro, sentiment, volatility, sector dispersion and trade structure as separate analytical layers and arrives at a unified composite verdict for Monday open. Each layer is unpacked in full.
Read the full composite for the cross-asset context driving this instrument:
The institutional positioning split — Asset Managers vs Leveraged Funds in size
PCE clearance and the macro case for Monday’s carry
The three-layer sentiment disagreement
The vol curve term structure and what VVIX is signalling
Sector dispersion and the breadth problem behind the record close
The Monday position-management playbook — sizing tiers and trade plans
Sunday Overwatch — the unified composite verdict
This analysis is for educational and informational purposes only. It does not constitute financial advice. Always manage your risk independently and in accordance with your own financial circumstances.
Continue with Titan Protect
Twenty-plus instruments. One framework.
We read more than twenty instruments daily across four sessions. The framework’s sunrise call landed across the day — the Pre-NY case study shows what the lines drew, what New York did, and where the read stands.
Core
£59/mo
Indicator suite plus daily framework reads.
Edge Popular
£109/mo
Core plus Shield dashboard and member-only briefs.
Elite
£179/mo
Edge plus weekly 1:1 call and early access to new tools.
Save 15% on annual billing
Want to see the framework in action? Free Explorer tier — no card required.
Join the live community: Discord channel · Shield dashboard
Education, not financial advice. Trade your own analysis.