The CrudeOil Framework Journal for July 2026, newest read at the top. Each dated entry is our read on the close, kept as a living record so the framework can be judged over time. This is analysis, not financial advice.
Friday 31 Jul 2026
$81.96
Gold holding above its $4,000 shelf is the week’s cleanest haven tell, while crude stays bid on fresh Middle East supply worry, a second and separate source of volatility running under the complex.
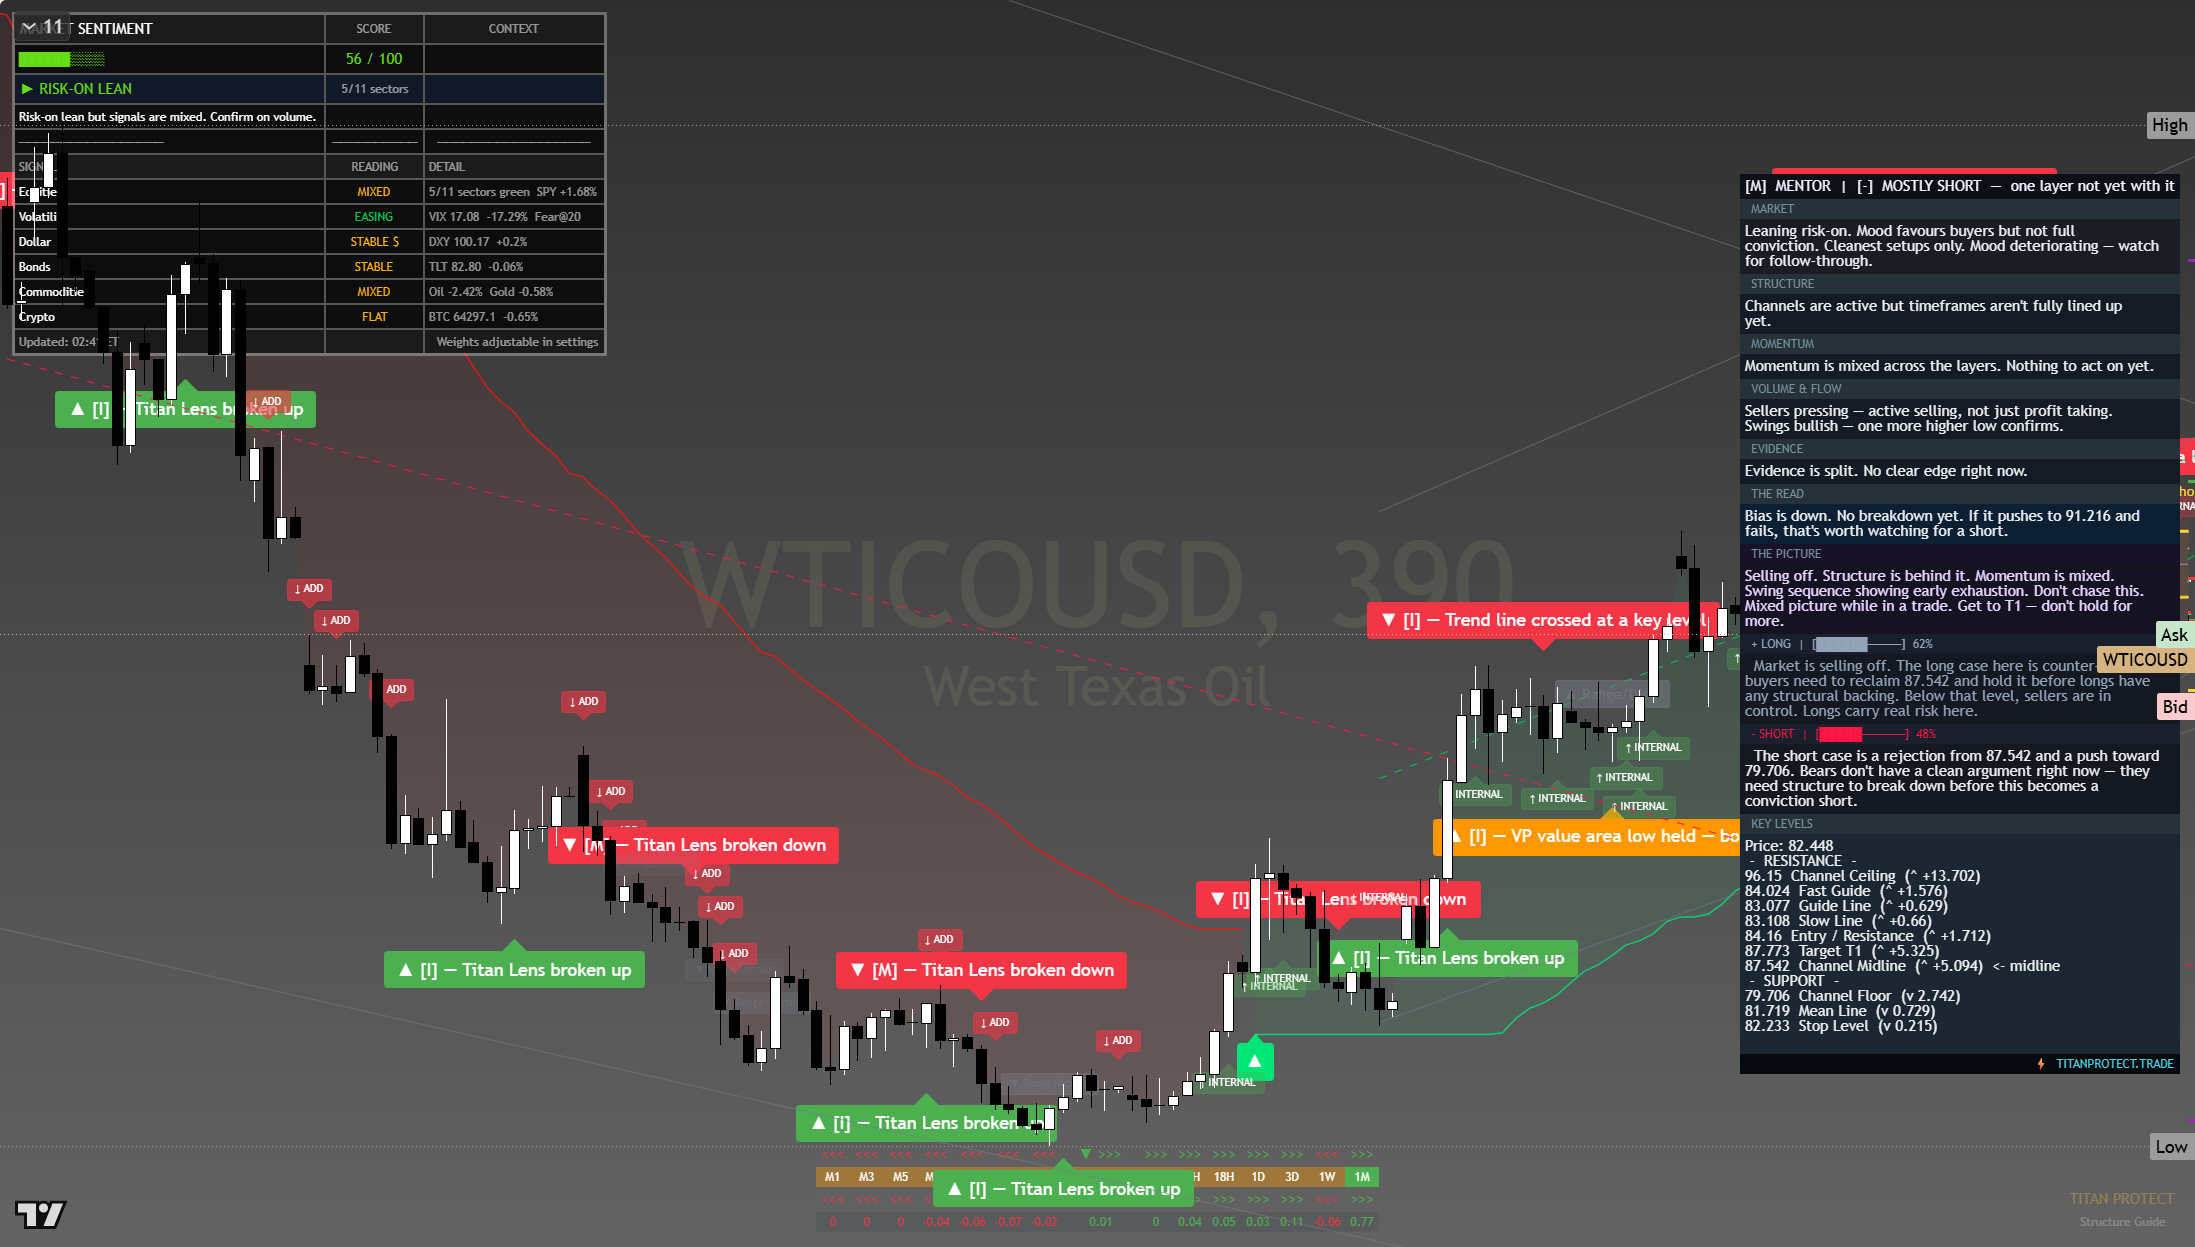
The chart above is the full daily read: structure, momentum, the levels that matter, and where the current price sits against them. Read it top to bottom for the complete picture, and pair it with our session briefs for the wider market context.
This is analysis, not financial advice. It reflects our multi-factor framework and is not a recommendation to buy or sell. Always do your own research and manage your risk.
Thursday 30 Jul 2026
$85.67
Gold holding above its $4,000 shelf is the week’s cleanest haven tell, while crude stays bid on fresh Middle East supply worry, a second and separate source of volatility running under the complex.
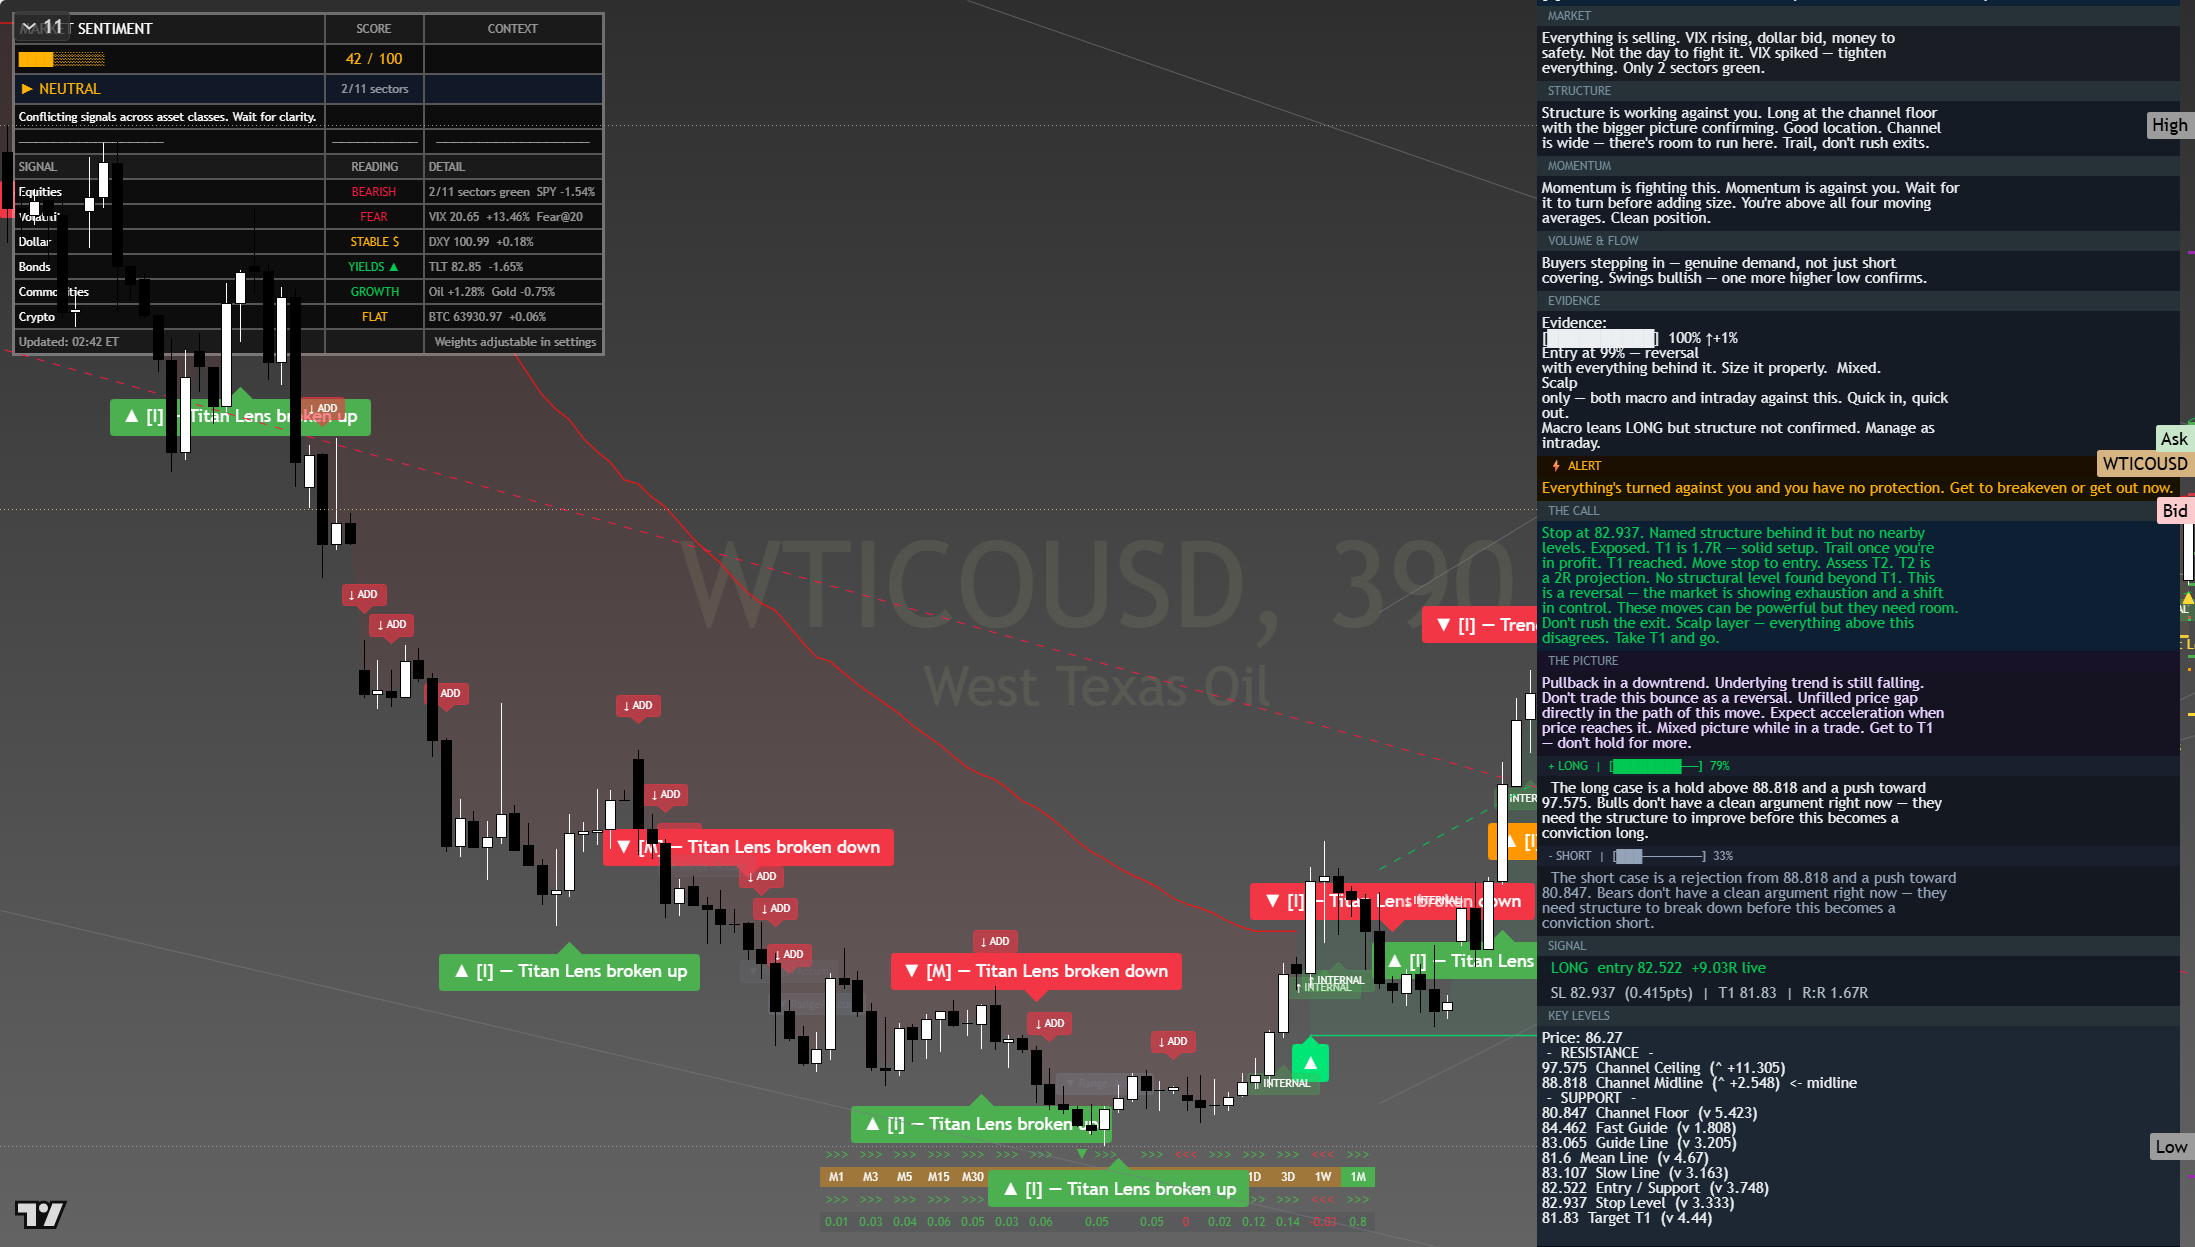
The chart above is the full daily read: structure, momentum, the levels that matter, and where the current price sits against them. Read it top to bottom for the complete picture, and pair it with our session briefs for the wider market context.
This is analysis, not financial advice. It reflects our multi-factor framework and is not a recommendation to buy or sell. Always do your own research and manage your risk.
Wednesday 29 Jul 2026
See chart for latest
Gold holding above its $4,000 shelf is the week’s cleanest haven tell, while crude stays bid on fresh Middle East supply worry, a second and separate source of volatility running under the complex.

The chart above is the full daily read: structure, momentum, the levels that matter, and where the current price sits against them. Read it top to bottom for the complete picture, and pair it with our session briefs for the wider market context.
This is analysis, not financial advice. It reflects our multi-factor framework and is not a recommendation to buy or sell. Always do your own research and manage your risk.
Tuesday 28 Jul 2026
$82.57
Gold holding above its $4,000 shelf is the week’s cleanest haven tell, while crude stays bid on fresh Middle East supply worry, a second and separate source of volatility running under the complex.
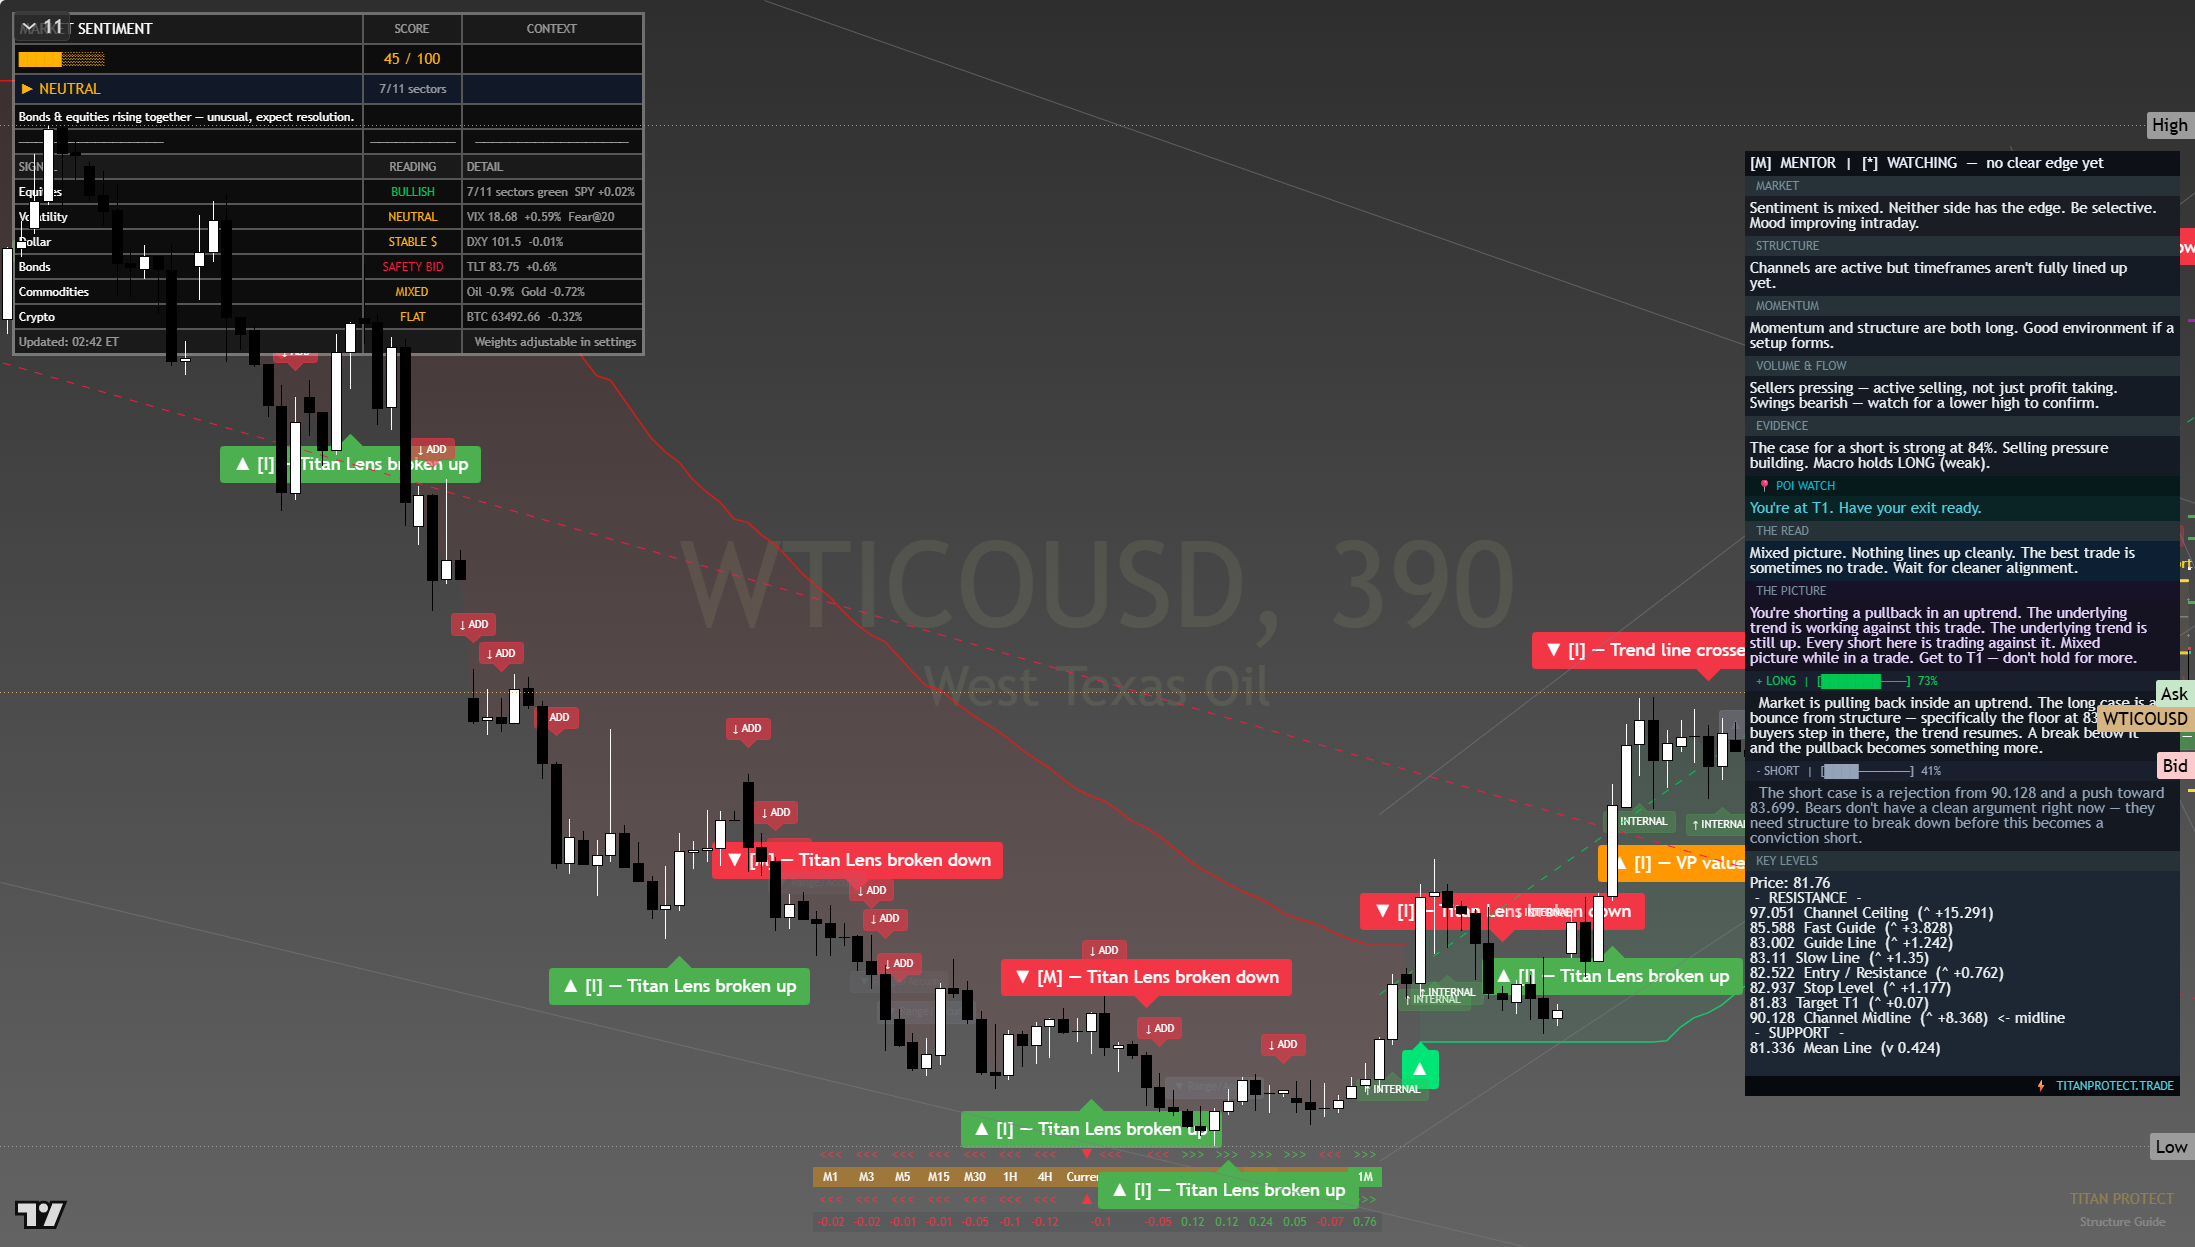
The chart above is the full daily read: structure, momentum, the levels that matter, and where the current price sits against them. Read it top to bottom for the complete picture, and pair it with our session briefs for the wider market context.
This is analysis, not financial advice. It reflects our multi-factor framework and is not a recommendation to buy or sell. Always do your own research and manage your risk.
Monday 27 Jul 2026
$85.08
Gold holding above its $4,000 shelf is the week’s cleanest haven tell, while crude stays bid on fresh Middle East supply worry, a second and separate source of volatility running under the complex.
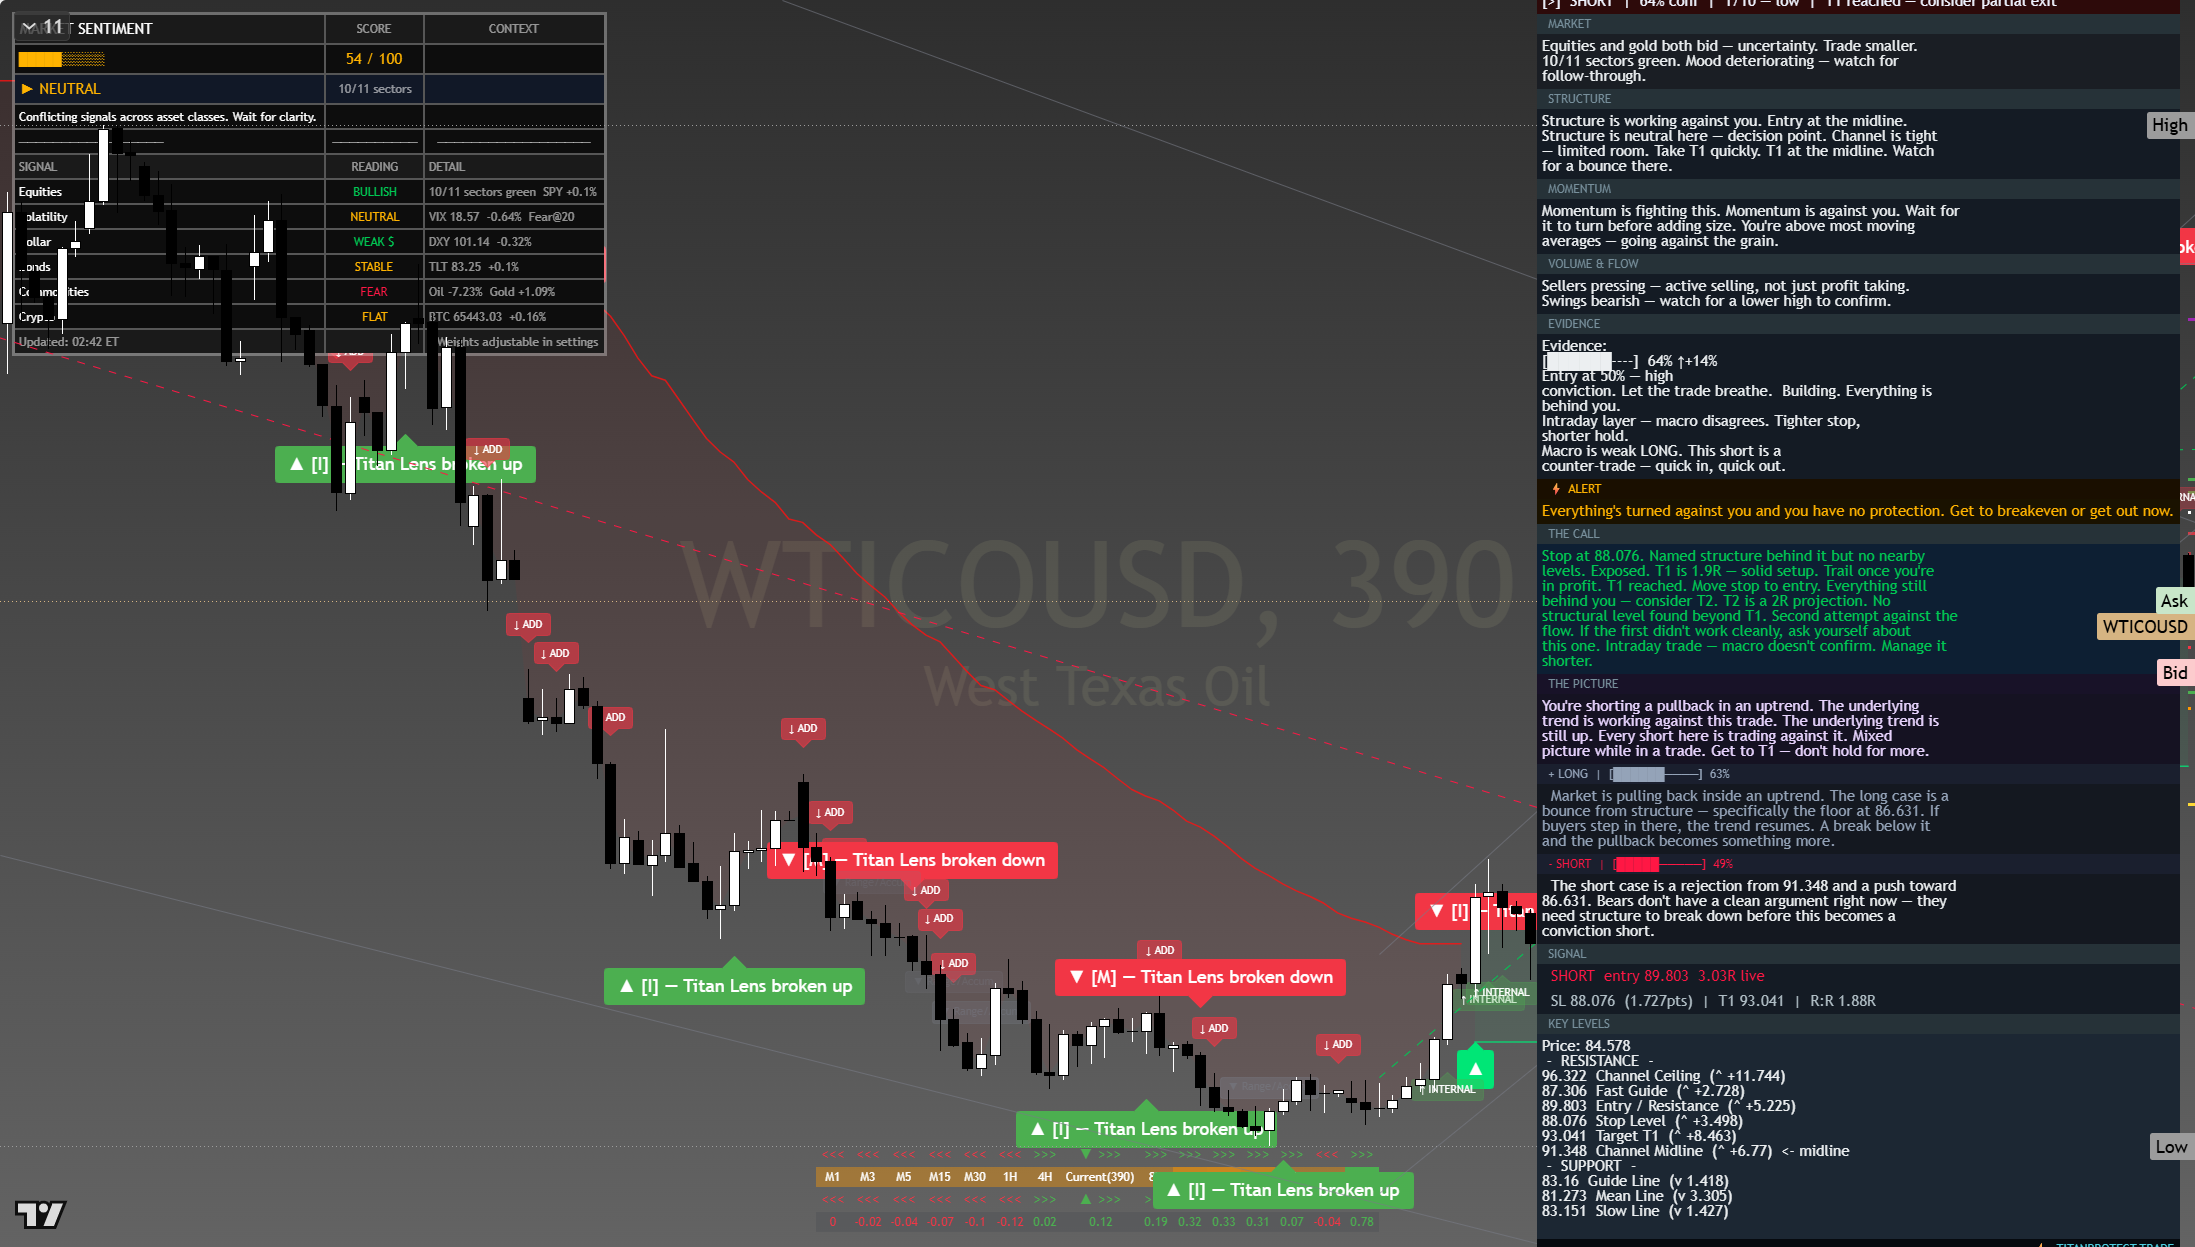
The chart above is the full daily read: structure, momentum, the levels that matter, and where the current price sits against them. Read it top to bottom for the complete picture, and pair it with our session briefs for the wider market context.
This is analysis, not financial advice. It reflects our multi-factor framework and is not a recommendation to buy or sell. Always do your own research and manage your risk.
Sunday 26 Jul 2026
$91.27
Gold holding above its $4,000 shelf is the week’s cleanest haven tell, while crude stays bid on fresh Middle East supply worry, a second and separate source of volatility running under the complex.
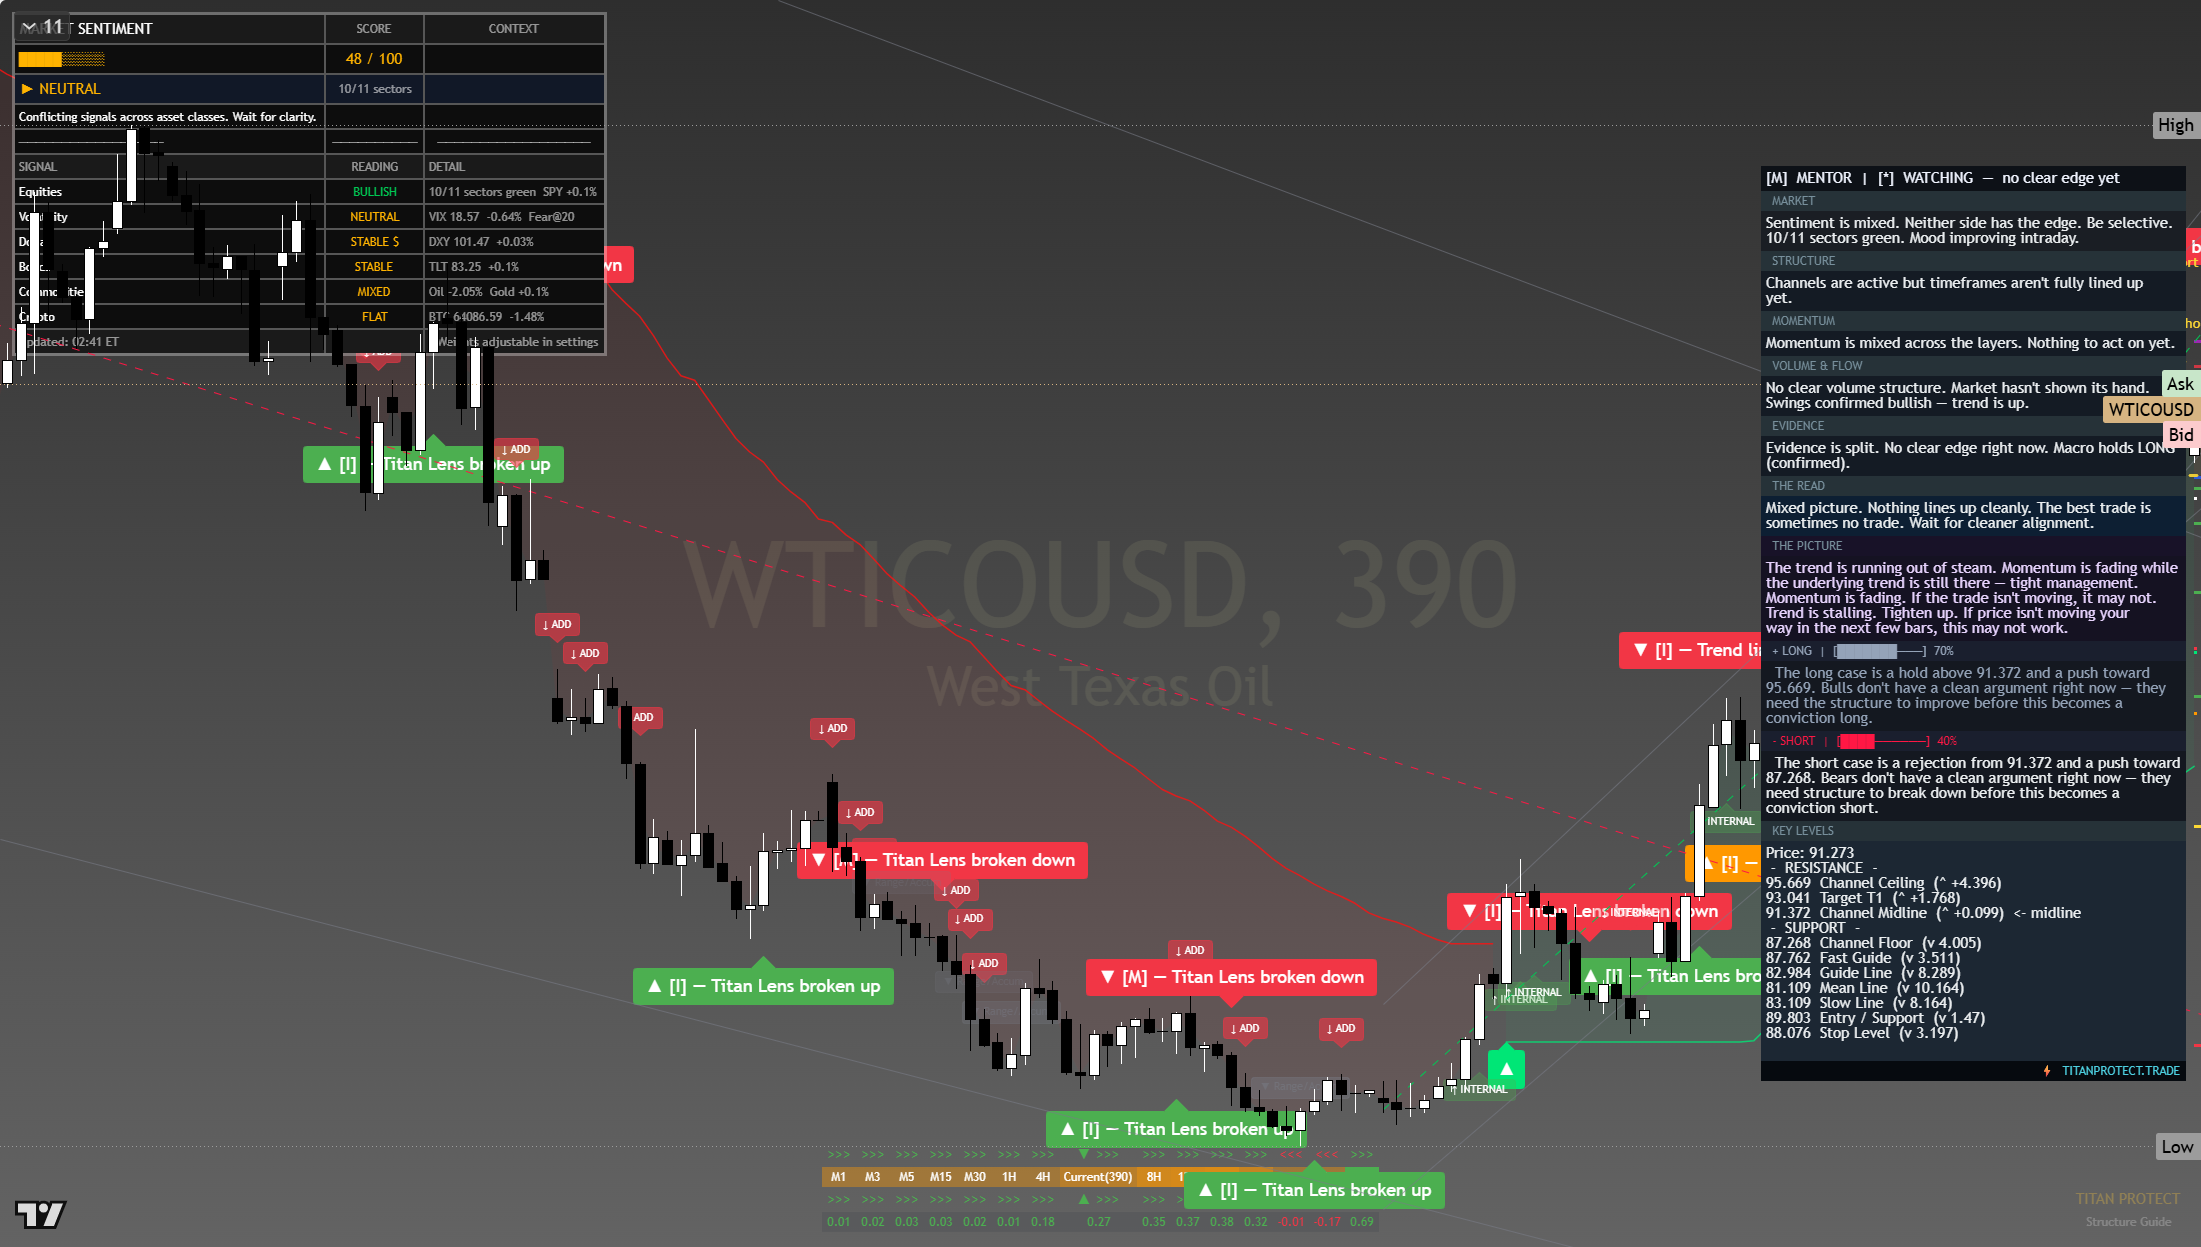
The chart above is the full daily read: structure, momentum, the levels that matter, and where the current price sits against them. Read it top to bottom for the complete picture, and pair it with our session briefs for the wider market context.
This is analysis, not financial advice. It reflects our multi-factor framework and is not a recommendation to buy or sell. Always do your own research and manage your risk.
Saturday 25 Jul 2026
$91.27
Gold holding above its $4,000 shelf is the week’s cleanest haven tell, while crude stays bid on fresh Middle East supply worry, a second and separate source of volatility running under the complex.
The chart above is the full daily read: structure, momentum, the levels that matter, and where the current price sits against them. Read it top to bottom for the complete picture, and pair it with our session briefs for the wider market context.
This is analysis, not financial advice. It reflects our multi-factor framework and is not a recommendation to buy or sell. Always do your own research and manage your risk.
Friday 24 Jul 2026
$92.56
Gold holding above its $4,000 shelf is the week’s cleanest haven tell, while crude stays bid on fresh Middle East supply worry, a second and separate source of volatility running under the complex.
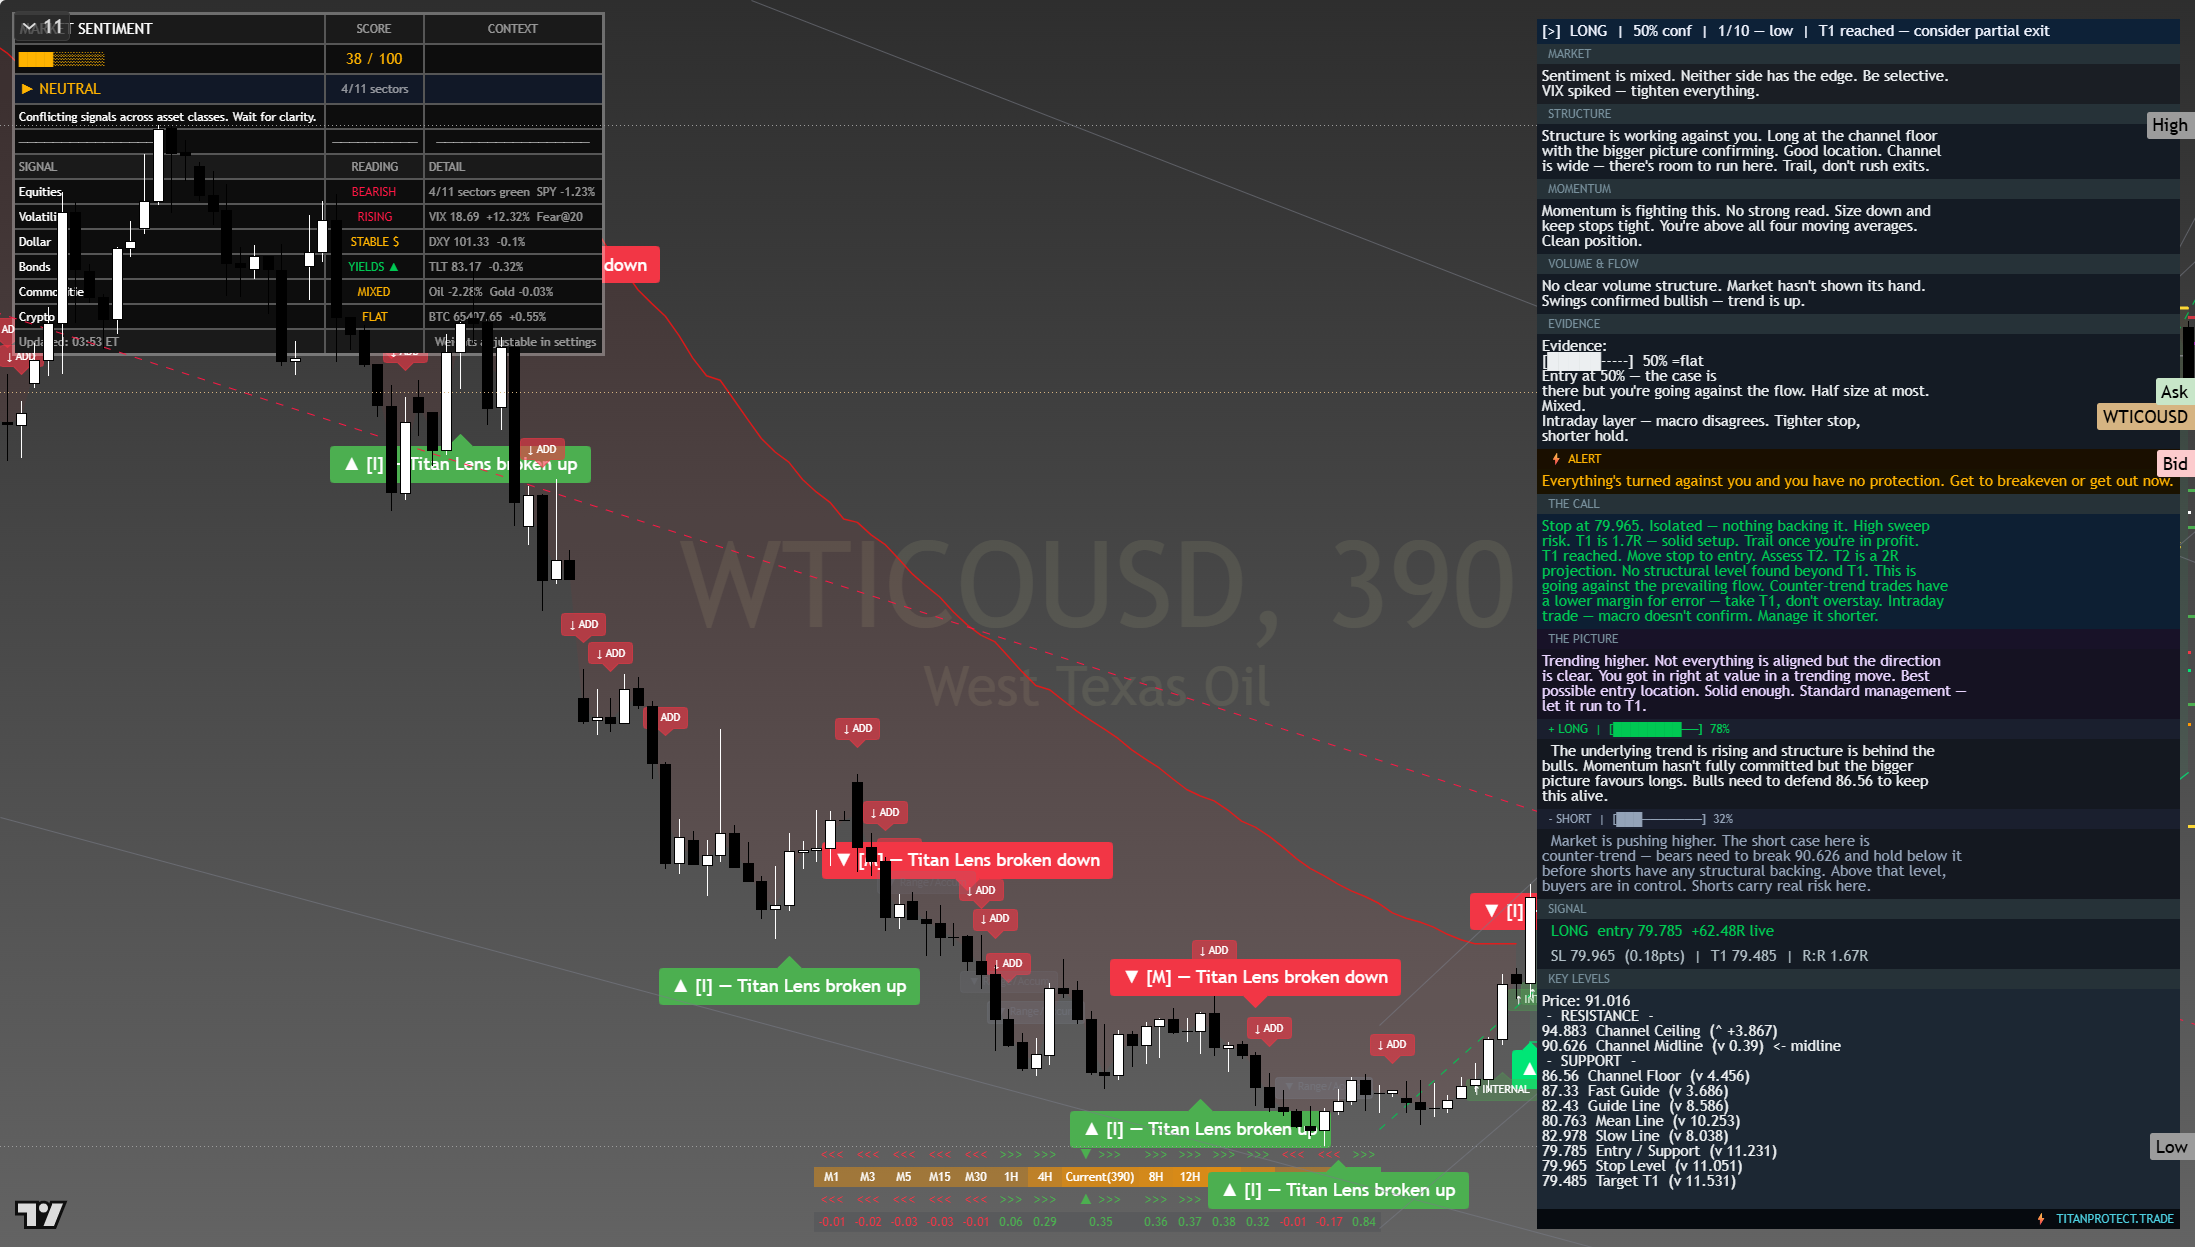
The chart above is the full daily read: structure, momentum, the levels that matter, and where the current price sits against them. Read it top to bottom for the complete picture, and pair it with our session briefs for the wider market context.
This is analysis, not financial advice. It reflects our multi-factor framework and is not a recommendation to buy or sell. Always do your own research and manage your risk.
Thursday 23 Jul 2026
$91.72
Gold holding above its $4,000 shelf is the week’s cleanest haven tell, while crude stays bid on fresh Middle East supply worry, a second and separate source of volatility running under the complex.
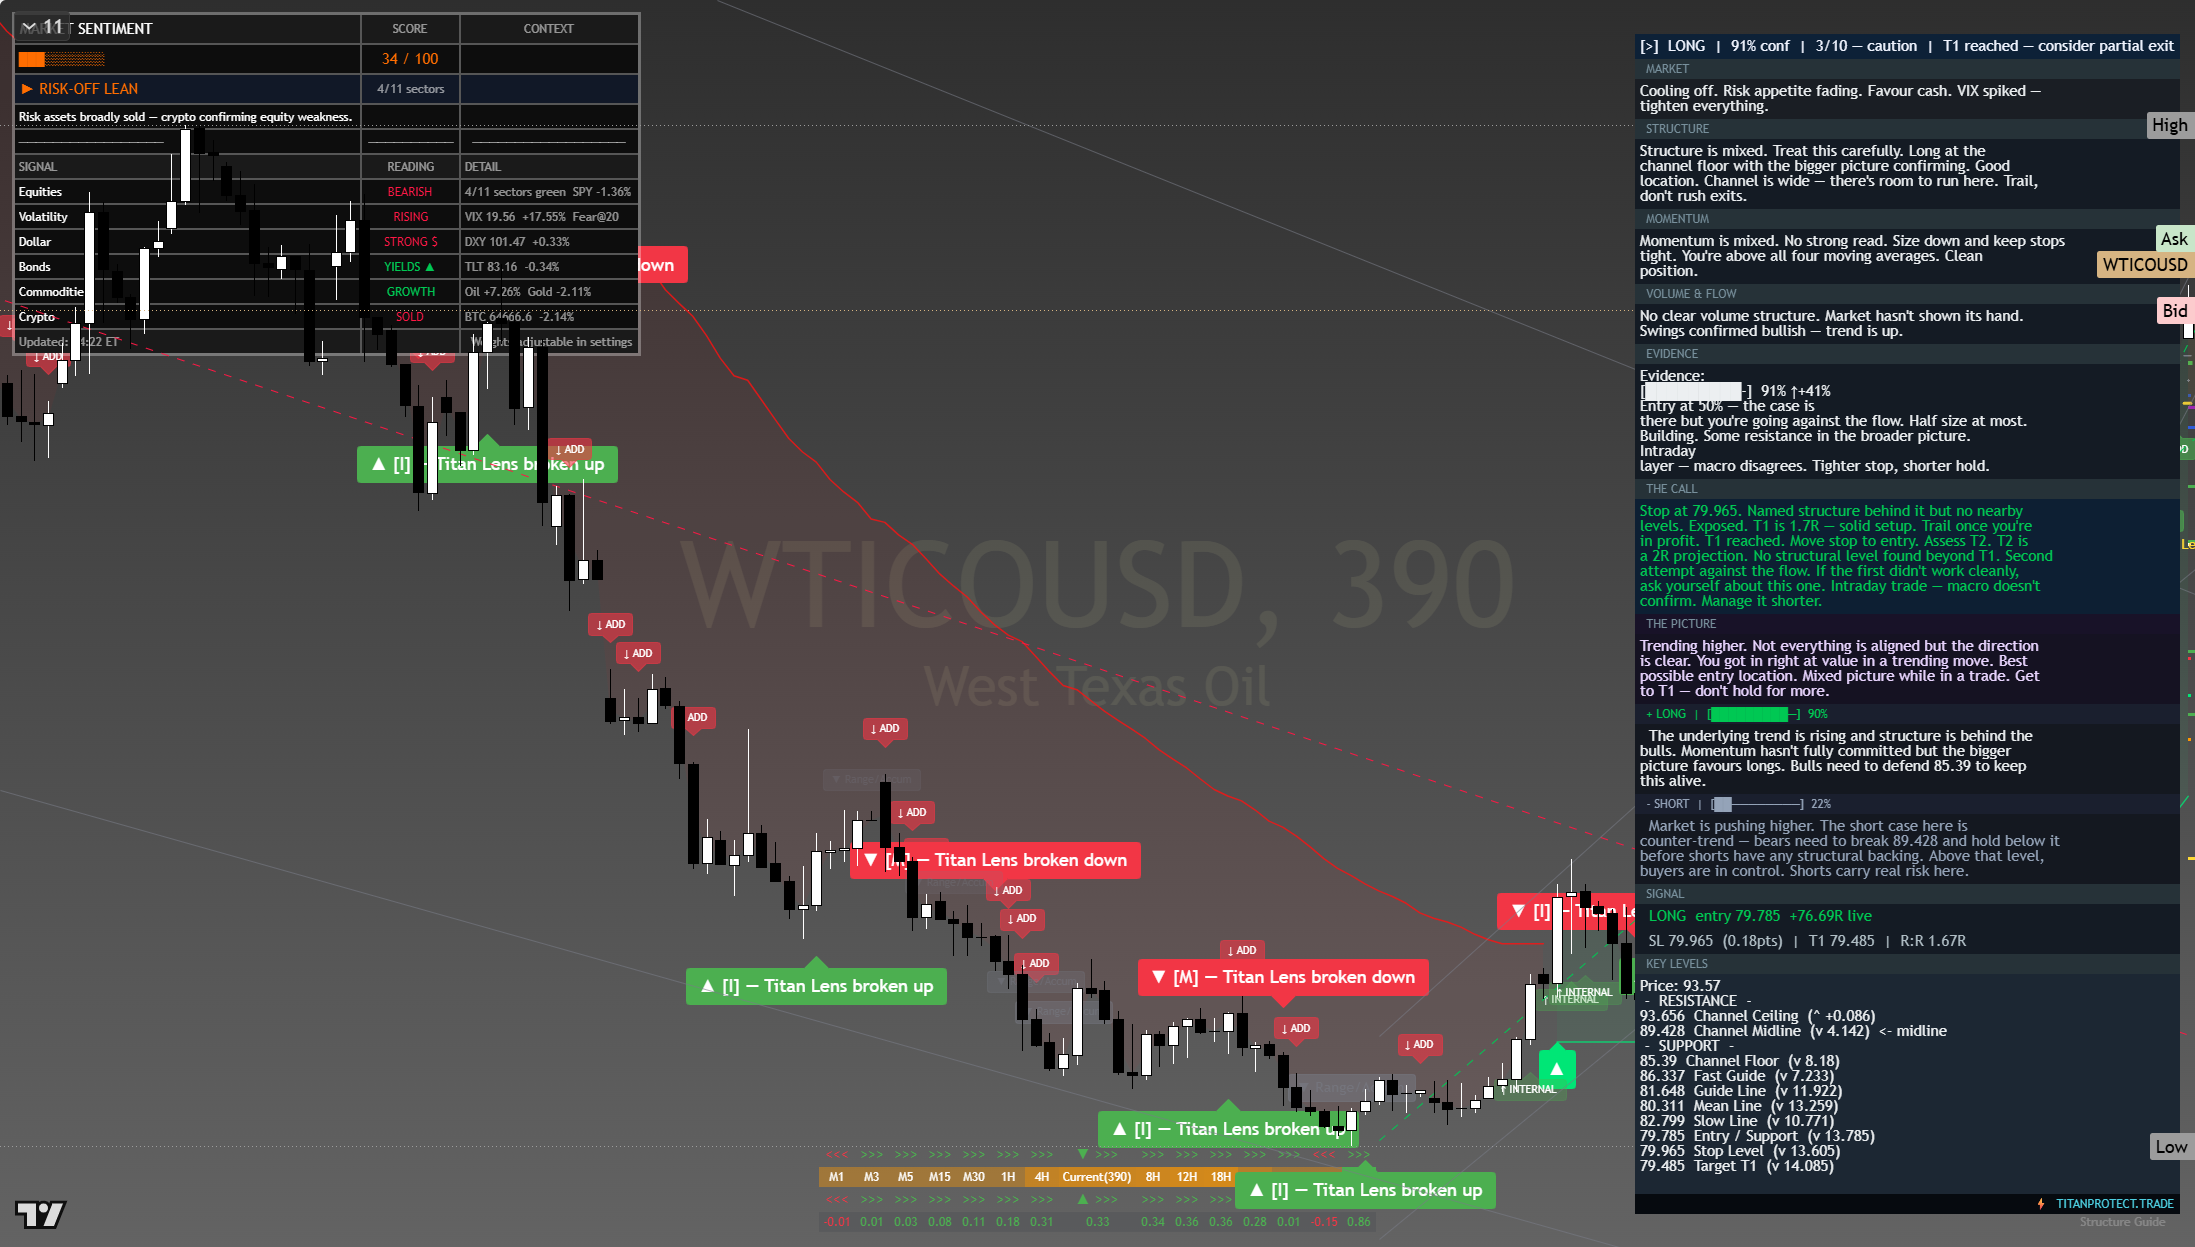
The chart above is the full daily read: structure, momentum, the levels that matter, and where the current price sits against them. Read it top to bottom for the complete picture, and pair it with our session briefs for the wider market context.
This is analysis, not financial advice. It reflects our multi-factor framework and is not a recommendation to buy or sell. Always do your own research and manage your risk.
Wednesday 22 Jul 2026
$86.25
Gold holding above its $4,000 shelf is the week’s cleanest haven tell, while crude stays bid on fresh Middle East supply worry, a second and separate source of volatility running under the complex.
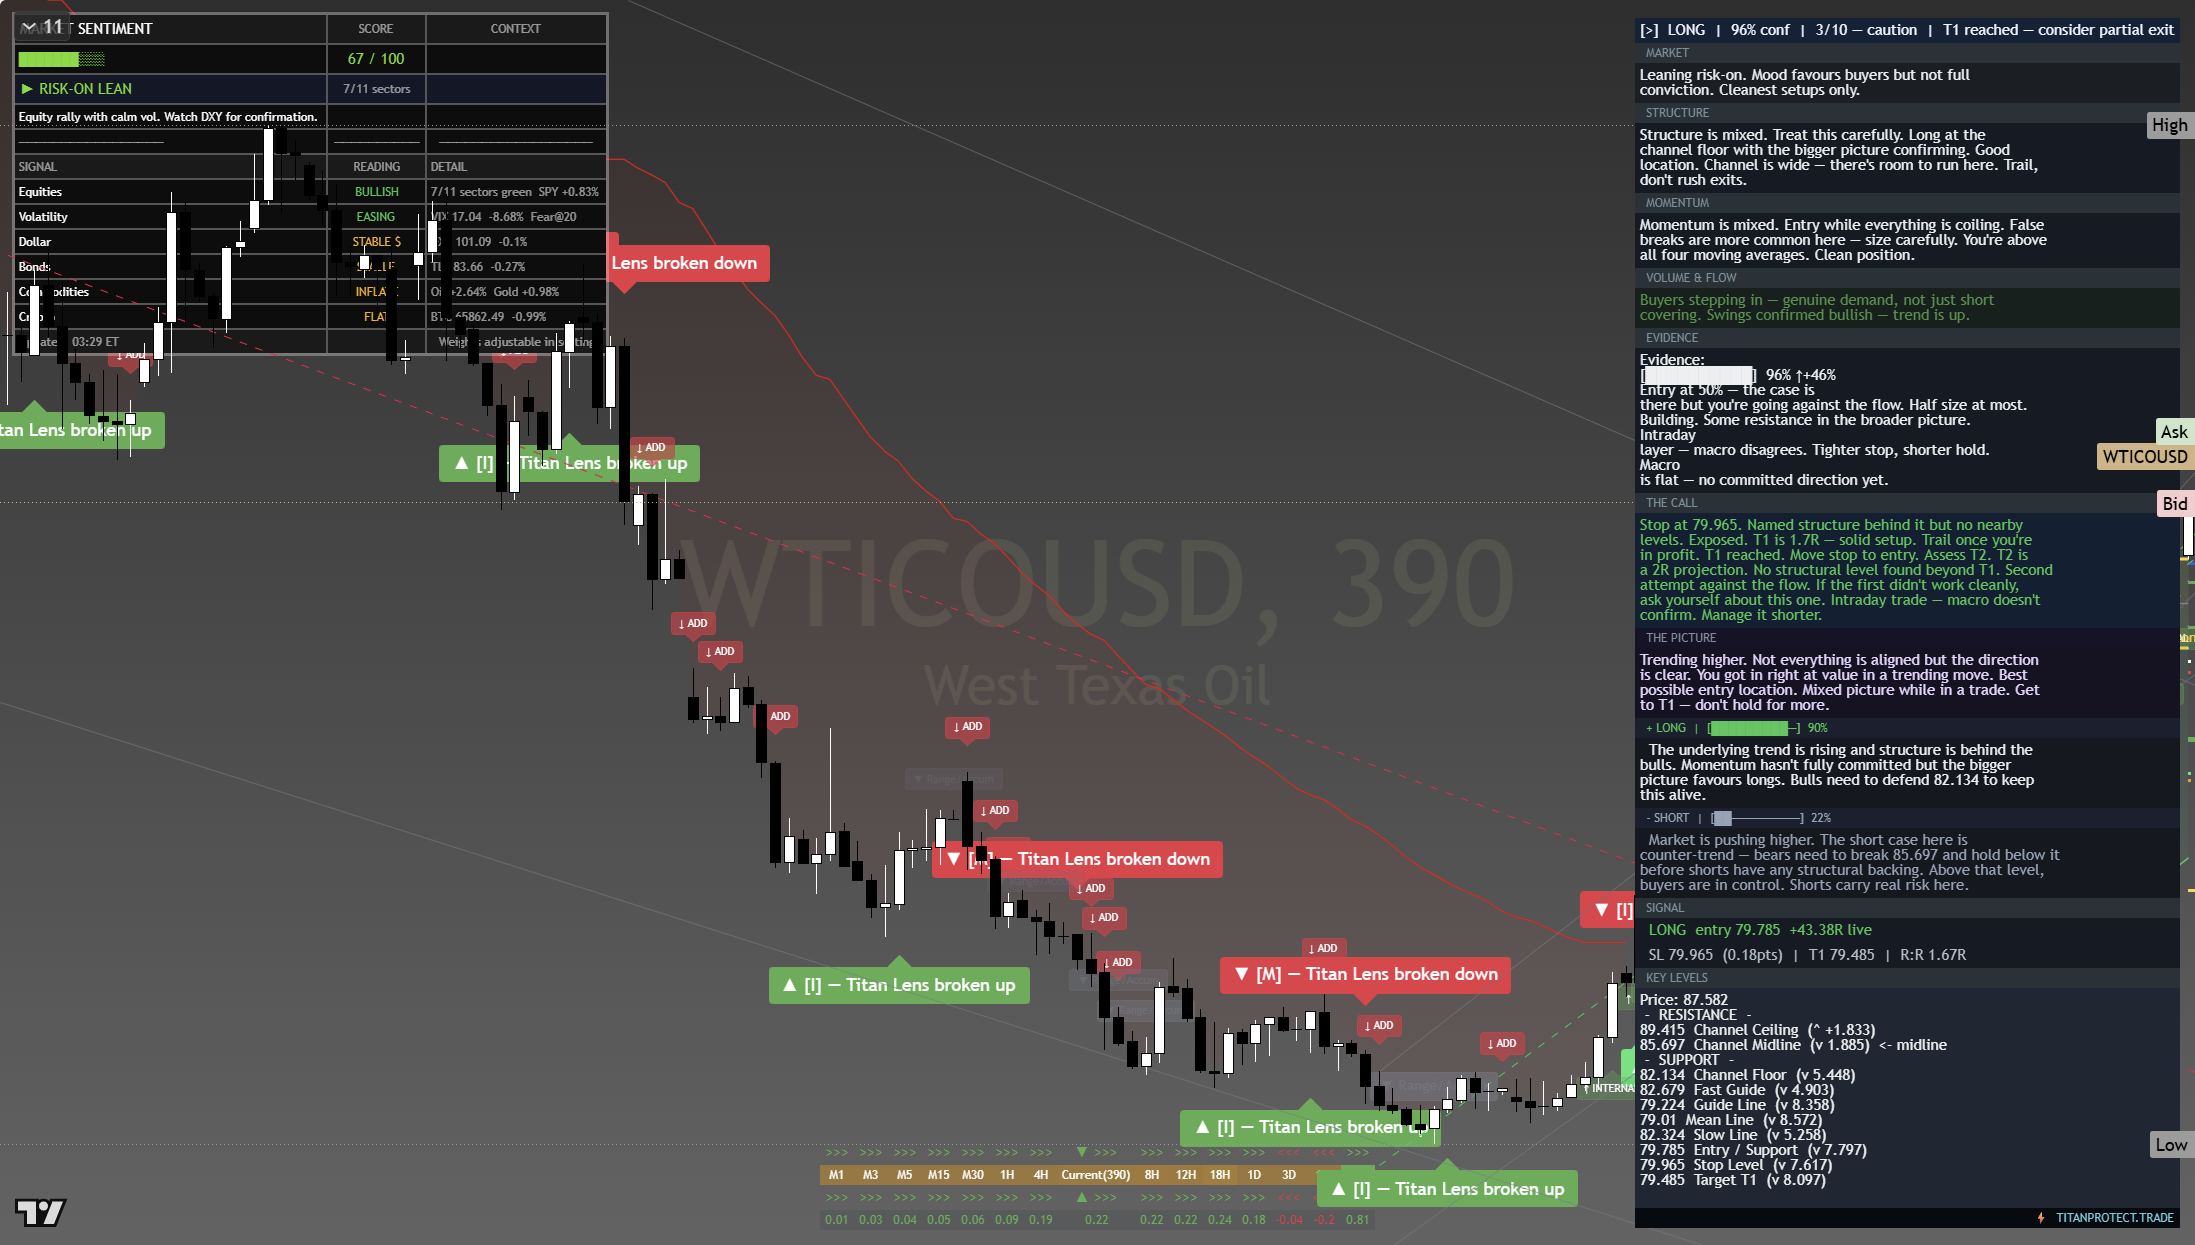
The chart above is the full daily read: structure, momentum, the levels that matter, and where the current price sits against them. Read it top to bottom for the complete picture, and pair it with our session briefs for the wider market context.
This is analysis, not financial advice. It reflects our multi-factor framework and is not a recommendation to buy or sell. Always do your own research and manage your risk.
Monday 20 Jul 2026
$84.74
Gold holding above its $4,000 shelf is the week’s cleanest haven tell, while crude stays bid on fresh Middle East supply worry, a second and separate source of volatility running under the complex.
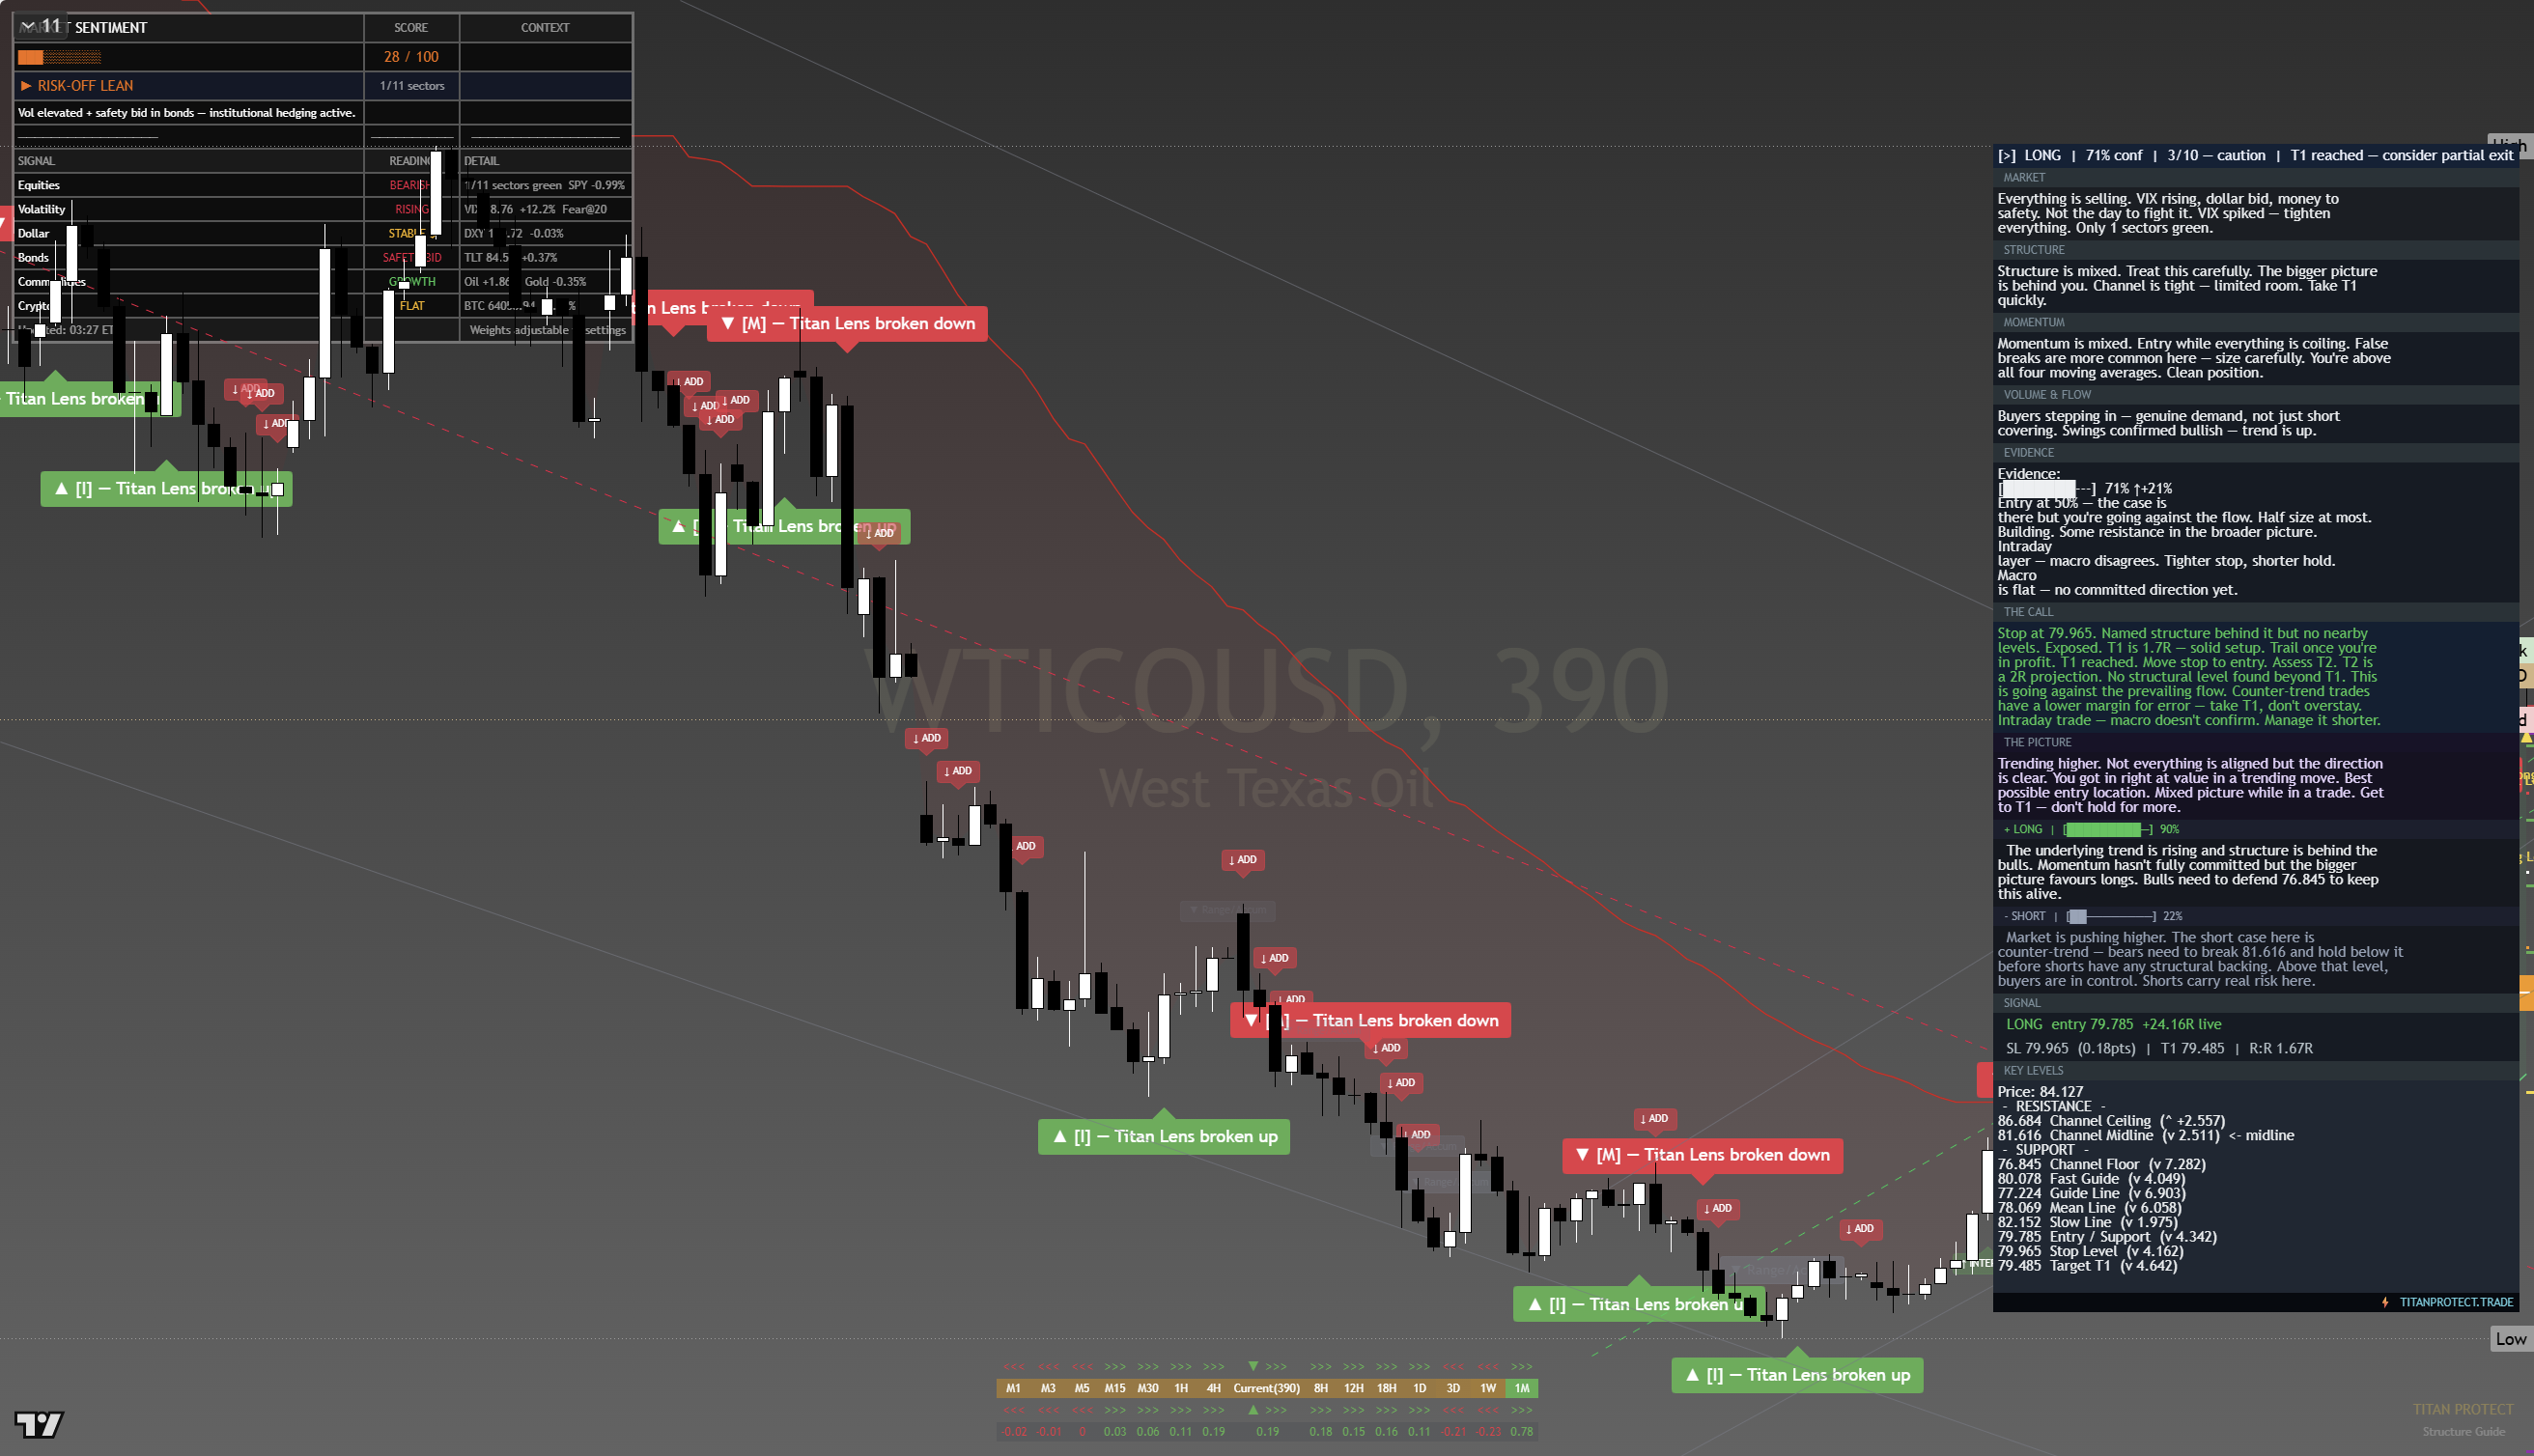
The chart above is the full framework read: structure, momentum, the levels that matter, and where the current price sits against them. Read it top to bottom for the complete picture, and pair it with our session briefs for the wider market context.
This is analysis, not financial advice. It reflects our multi-factor framework and is not a recommendation to buy or sell. Always do your own research and manage your risk.
Wednesday 15 Jul 2026
Crude Oil WTI (CL) Refuses to Cool at 79.82, Up 2.15% as a Live Hormuz Premium Overrides the Dovish CPI Relief
Crude Oil WTI (CL) | Daily Framework Read | Tuesday 14 July 2026
A cool June inflation print flipped the whole tape risk-on this morning, yet crude did not join the relief in the way a softening energy line would suggest. Crude Oil WTI (CL) closed the session near 79.82, up about 2.15% on the day and roughly 1.68 dollars above the prior settlement of 78.14. The official energy component of inflation eased, but the physical barrel did the opposite, held firm by a live shipping premium around the Strait of Hormuz and given a second tailwind by a softer dollar as Treasury yields fell. The result is a market pressing the underside of the 80.00 handle with the burden of proof now on the sellers.
Thesis. While the shipping-lane premium stays live, dips in Crude Oil WTI (CL) are being bought and the path of least resistance points at the 80.00 to 82.50 shelf. The bias is bullish and firm above 79.00. It only flips to neutral on a decisive close back under the 78.14 breakout base, which would signal the premium is bleeding out and the dovish-macro cooling has finally reached the barrel.
Where it sits today
Crude Oil WTI (CL) marked the session at 79.82, a gain of about 2.15% and near the top of its recent range. The measured move ran off the prior close of 78.14, and the barrel spent the late session pinned in a tight band between 79.59 and 79.85, coiling directly beneath the round 80.00 level rather than fading back. That is the tell of the day: on a morning when cooler inflation dragged yields lower and lifted equities, an asset with no fresh bullish catalyst would normally drift. Instead crude pushed up and held.
The international grade is telling the same story. Brent closed near 85.22, up about 2.3%, keeping the premium of the seaborne barrel over the US benchmark wide. When the waterborne grade leads and the spread stays stretched, the market is pricing a supply and logistics worry, not a demand surge. That distinction matters for how you treat the levels below.
What the framework reads
The composite read across the last twenty four hours frames this as a two-tailwind tape for the barrel. The first tailwind is geopolitical: the shipping-lane premium around the Strait of Hormuz has not compressed, and every session it stays bid it re-anchors the floor a little higher. The second is monetary. June inflation printed clearly cool, with the headline down 0.4% on the month against an expected 0.2% dip and the annual rate easing to 3.5% from 3.8%. Yields fell sharply in response, and a softer yield backdrop tends to pull the dollar down with it. A weaker dollar makes every barrel priced in that currency cheaper for the rest of the world, so the same dovish surprise that cooled the official energy line quietly supported the physical price.
That is the core split to hold in mind. The cooling was in the backward-looking, officially measured energy basket. The strength is in the live, forward-looking barrel that trades on tankers and freight. Those two can diverge for weeks, and today they did. The framework reads the divergence as a reason to respect the upside rather than fade it, because the marginal driver of price right now is a risk premium that resolves on headlines, not on a data series.
The structure supports that lean. Holding above the 78.14 base after a 2% up day, and coiling under 80.00 rather than rejecting from it, is the behaviour of a market storing energy for a push, not one exhausting a spike. The framework keeps the bias bullish while price defends 79.00 and treats a loss of the base as the single clean signal that the premium is unwinding.
Key levels
| Level | Type | What it means |
|---|---|---|
| 82.50 | Upper resistance | Prior swing supply and the natural target if the premium stays live and 80.00 gives way. |
| 81.00 | Near resistance | Round-number magnet and first objective on a clean break of the 80 handle. |
| 80.00 | Immediate overhead | Psychological cap the barrel is coiling beneath. Acceptance above opens the shelf. |
| 79.82 | Current | Session mark, up about 2.15% and pressing the underside of resistance. |
| 79.00 | First support | Round-number floor. Buyers defending here keep the bullish structure intact. |
| 78.14 | Breakout base | Prior close and launch point of the move. A decisive close below flips the bias to neutral. |
| 77.00 | Deeper support | The level a full premium unwind and a risk-off flush would reach for. |
Three scenarios into the next shipping-lane headline
Bullish, 55%. The premium stays live and the softer dollar keeps a bid under the barrel. Price accepts above 80.00, clears 81.00 and extends toward 82.50. This is the base case while 79.00 holds on any pullback.
Sideways, 30%. The barrel chops in an 79.00 to 80.50 band as the market waits for the next concrete shipping or supply headline. No clean trend, a range to be traded from the edges rather than chased.
Correction, 15%. The premium begins to bleed, the dovish-macro cooling finally reaches the barrel, and price loses the 78.14 base on a closing basis, opening the way toward 77.00. This is the lower-probability path, but it is fast if the headline that built the premium reverses.
Risk score
Overall risk on a long lean here reads about 58%, elevated but not extreme. The factor breakdown:
- Event sensitivity, high. The dominant driver is a geopolitical premium that resolves on headlines. It can add or remove several percent in a single session.
- Structure, supportive. Holding the base after a 2% day and coiling under resistance is constructive, which offsets some of the event risk.
- Macro cross-current, moderate. The softer dollar helps the long, but the same dovish read that cooled official energy is a reminder that demand-side pressure is easing.
- Location, cautionary. Entering directly beneath the 80.00 cap means chasing into resistance unless you wait for either acceptance above it or a pullback to support.
Opportunity. A hold of 79.00 on a pullback, followed by acceptance back above 80.00, is the cleanest structure the barrel has offered this week. It gives a defined base to lean on and a measured path into the 81.00 to 82.50 shelf while the premium stays bid.
Risk. A risk premium is only worth what the next headline says it is. If the shipping-lane worry eases, the same 1.68 dollars that were added today can leave just as fast, and a close back under 78.14 would confirm the unwind. Size for a market that can gap on news, not one that trends politely.
How to walk it
This is a lean to express with a smaller, event-aware size, not a full-conviction position, because the driver is a premium rather than a durable trend. The higher-quality entry is patience: either a pullback that holds the 79.00 to 79.30 zone, or acceptance above 80.00 that turns the cap into a floor. Chasing straight into the underside of resistance at 79.82 is the lower-quality version of the same idea.
Working from a pullback entry near 79.30, the invalidation sits just below the 78.14 base, at about 78.00. That places the stop roughly 1.6% below entry, a contained distance for an instrument this headline-sensitive. The first objective at 81.00 is about 2.1% of upside, and the 82.50 shelf is about 4.0%, so the structure offers a reward of roughly two to two and a half times the risk taken. If price instead breaks above 80.00 first, the same stop under the base still applies, but the entry is worse and the reward-to-risk compresses, which is why waiting for the better location pays.
The one line that matters: stay long and patient while 79.00 holds and the premium stays live, and stand down the moment the barrel closes back under 78.14, because that is the market telling you the cooling has finally reached the physical price.
Verdict: Bullish and firm above 79.00 while the shipping premium stays live, with the 80.00 to 82.50 shelf the objective and a close below 78.14 the single clean off-switch.
Continue reading
- Raw Materials Radar: the energy complex and the premium that will not compress
- Macro Pulse: cool June inflation, falling yields and what a softer dollar does to commodities
- FX Focus: the dollar leg of the crude trade after the dovish surprise
- Overwatch: reading a barrel driven by headlines rather than demand
Titan Protect framework reads are educational market analysis, not financial advice. Levels and scenarios reflect conditions at the session close on Tuesday 14 July 2026 and will change as the market moves. Always manage your own risk.
Monday 13 Jul 2026
Crude Oil WTI (CL) Erupts 9.2% to $77.99 as Hormuz Supply Fear Reprices the Barrel: Daily Framework Read 13 July 2026
Crude Oil WTI (CL) | Daily Framework Read | Monday 13 July 2026 (US close)
Crude Oil WTI (CL) tore 9.21% higher on the session to settle at $77.99, its largest one-day advance in months, as a supply-risk premium over the Strait of Hormuz flooded back into the barrel. The move ran from a $72.61 low to a $78.58 high, an enormous single-day range that leaves price stretched well above its recent low-70s base of $71.41. This was a risk-off day everywhere else: the fear gauge snapped 14% higher, the NAS100 shed close to two per cent into CPI eve, and gold paradoxically fell. The bias is bullish while the geopolitical bid holds, but after a vertical 9% candle the honest read is that chasing here is the wrong trade. Patience for a controlled pullback is the edge.
Framework thesis: A genuine supply shock has repriced Crude Oil WTI (CL) in one session, and event-driven spikes of this size rarely fully retrace while the trigger is live. Structure is now bullish above the $73.69 gap origin. But a 9% vertical move is not a level to buy into. The framework favours waiting for a retest toward the $76.00 to $75.00 shelf, defining risk below the session floor, and targeting the $82 handle where Brent already trades. Force nothing before tomorrow’s inflation print clears.
Where it sits today
Crude Oil WTI (CL) closed the US session at $77.99, up 9.21% on the day, a gain of $6.58 from the prior settle of $71.41. Price opened at $73.69, was bid relentlessly through the session, tagged a high of $78.58, and never seriously threatened the $72.61 low after the opening hour. That is roughly a six-dollar range on the day, the kind of expansion that only prints when the market is repricing a real supply threat rather than trading noise.
The catalyst is straightforward. Renewed risk to tanker traffic through the Strait of Hormuz, the chokepoint that carries a large share of seaborne crude, pulled a supply-disruption premium straight back into the front of the curve. Brent, the international benchmark, is trading at $83.24, so the global barrel is signalling the same story from a higher base. What matters for the framework is that this is a supply-led rally, not a demand-led one, and supply shocks tend to hold their gains far longer than sentiment squeezes do, right up until the headline that triggered them fades.
The cross-asset picture confirms the fear trade. The market fear gauge jumped 14.17% to 17.16 from 15.03, finally snapping out of a long stretch of complacency that had it averaging around 15.7 over the prior week. The NAS100 fell 1.88% to 29,264 as growth names took the brunt of the rotation, and even gold slipped 2.39% to $4,006, an unusual move that tells you dollar strength and a scramble for liquidity, not a classic flight to safety, drove the tape. The dollar index firmed to 101.31. Crude was the one asset the market wanted to own.
What the framework reads
Strip out the drama and the structure is clean. Crude Oil WTI (CL) has spent recent sessions basing in the low 70s, using $71.41 as a floor. Today it did not drift out of that base, it exploded out of it, closing near the highs at $77.99 with the session high at $78.58 only a fraction above. Closing in the top of the daily range after a move this size is a sign of conviction rather than exhaustion, and it argues that sellers made no meaningful stand into the close.
The composite read is bullish, and the conviction on direction is high while the Hormuz thread stays live. The nuance is entirely about location. When an instrument travels nine per cent in a single session, the reward-to-risk of buying the close is poor no matter how right the direction is, because the first sharp pullback can easily shake out a chased position before the trend resumes. The framework separates the call from the entry: the call is up, the entry is not here.
There is a second-order tell in the way the rest of the board traded. A supply-driven oil spike that also lifts the fear gauge and pressures equities is the textbook stagflationary scare, and it lands on the eve of a US inflation print. That combination means tomorrow’s data does not just move bonds and the NAS100, it feeds directly back into the energy complex through the inflation-expectations channel. A hot number would harden the supply-premium story into a broader cost-of-living narrative and give crude a second leg. A soft number would let some of the fear premium bleed out. The barrel is now partly an inflation instrument, and that raises the stakes on the next 24 hours.
Key levels
Structural pins framing Crude Oil WTI (CL) from the current $77.99 settle, above and below:
| Level | Type | What it means |
|---|---|---|
| $82.00 | Resistance (target) | Round-number magnet and the zone where the WTI barrel closes the gap to Brent near $83.24. Natural profit-taking shelf on a second leg. |
| $80.00 | Resistance | The psychological handle overhead. First real friction above the session high; a clean break here confirms the supply premium is being extended. |
| $78.58 | Resistance (session high) | Today’s peak and the immediate ceiling. Holding above it on any pullback keeps the bulls fully in control. |
| $77.99 | Current settle | Closed near the highs after a 9.21% session. Conviction close, stretched location. |
| $76.00 to $75.00 | Support (entry shelf) | The preferred re-entry zone. A controlled retest into this band offers a far better base than chasing the close. |
| $73.69 | Support (gap origin) | Today’s open and the launch point. A close back below it would mean the breakout has failed and the premium is unwinding. |
| $72.61 / $71.41 | Support (base floor) | Session low and the prior consolidation floor. A full return here neutralises the entire move and resets the read. |
Three scenarios into tomorrow’s inflation print
Tomorrow brings the US inflation print alongside Fed Chair testimony and the first major bank earnings, so Crude Oil WTI (CL) will not trade in isolation. The paths from here:
- Second leg, 45%. The Hormuz headline stays live or the inflation number prints hot. Price holds above $76.00 on any dip, reclaims $78.58, and pushes the $80.00 handle toward the $82.00 gap-to-Brent target. The supply premium hardens into an inflation story.
- Digestion, 35%. The most common sequel to a vertical candle. Price chops between the $73.69 gap origin and the $78.58 high, bleeding off the froth while the base holds. Frustrating to trade, healthy for the trend, and the setup that hands you the clean pullback entry.
- Premium unwind, 20%. The disruption headline is walked back or inflation comes in soft. The fear bid deflates, price loses $73.69, and the move round-trips toward the $72.61 to $71.41 base. The whole spike proves to be a one-day event.
Opportunity: Supply-shock spikes reward patience, not chasing. A controlled retreat into the $76.00 to $75.00 shelf that then holds gives you the trend direction with a defined floor beneath you, the best reward-to-risk this instrument has offered in weeks. The bulls stay in charge as long as $73.69 caps the downside on a closing basis.
Risk: This is a headline-driven barrel, and headlines cut both ways. A single line walking back the Hormuz threat can vaporise several dollars of premium in minutes, and it would land straight into tomorrow’s inflation print, when liquidity thins and gaps widen. Anyone long into that combination without a stop is trading a coin flip on a news wire. Size for the volatility, not the conviction.
Risk score
Framework risk on a fresh long here reads 72%, elevated. The components:
- Overextension: a 9.21% single-session candle sits at the top of its range, the single largest contributor to risk. Chasing strength here is statistically punished.
- Event overhang: the inflation print, Fed Chair testimony and bank earnings all land within 24 hours, any of which can whip the barrel through the inflation-expectations channel.
- Headline dependency: the entire move rests on a live geopolitical thread that can reverse on a single wire.
- Offsetting support: a genuine supply premium and a conviction close near the highs keep the directional bias firmly bullish, which is why this is a location problem, not a direction problem.
How to walk it
Direction bullish, execution patient. The framework does not buy a 9% close. It waits for the market to offer a better price.
| Entry (preferred) | On a controlled pullback into $76.00 to $75.00 that holds, ideally after the inflation print clears. |
| Stop | Below $73.30, under the gap origin and today’s structural floor. That is roughly 2.2% of price below a $75.50 entry, a defined and modest stop distance. |
| Target 1 | $78.58, the session high, for a first partial. |
| Target 2 | $82.00, the gap-to-Brent shelf, giving better than three times the stop distance in reward. |
| Invalidation | A closing break of $73.69 says the breakout has failed. Stand aside and let the base rebuild. |
Sizing sits at the lighter end of tier guidance until the event calendar clears, precisely because the stop can gap through on a headline. Risk a fixed and small percentage of capital on the idea, let the market come to your level, and refuse to pay up for a barrel that has already run nine per cent. If price never offers the pullback and simply breaks $80.00 cleanly on volume, that is a separate momentum decision with its own tighter stop, not a reason to abandon discipline on the pullback plan.
Verdict: Bullish and repriced by a real supply shock, but stretched. Do not chase $77.99, wait to buy the pullback into $76.00 to $75.00 with a stop under $73.30 and eyes on $82.
Continue reading
- How A Live Supply Premium Is Repricing The Energy Complex
- The Fear Gauge Finally Snapped: Reading The Volatility Regime Shift
- Inflation Eve: Why Tomorrow’s Print Runs Through The Barrel
- Raw Materials Radar: Where The Oil Bid Sits In The Broader Board
Titan Protect research is educational market analysis, not individual investment advice. Markets carry risk. Always do your own diligence and manage position size to your own tolerance.
Sunday 12 Jul 2026
Silver (XAG/USD) — Daily Framework Read | Saturday 11 July 2026
Silver (XAG/USD) | Post Close Setup Framework Read | Data basis: 2026-07-11 close
Where It Sits
Structure
Structurally Silver (XAG/USD) has pulled back into the session close. The broader trend remains intact on the daily timeframe but the shorter timeframe has softened. The structure is contested near the 60.1650 level.
Momentum
Momentum is neutral with internal readings near the centre of the range. That is the signature of a market digesting the prior move. The tape needs a fresh catalyst to commit to direction.
Volume & Flow
Flow on the session close was measured. Positioning data suggests steady accumulation rather than aggressive directional commitment. The pattern supports continuation rather than reversal.
Key Levels
| Level | Type | Significance | Action Zone |
|---|---|---|---|
| 63.10 | Resistance | Upper range target, prior supply zone | Take profits / fade if rejected |
| 61.10 | Pivot | Mid-range continuation marker | Hold = constructive; lose = consolidation |
| 60.17 | Session close | Reference anchor for next session | Above = continuation; below = mean revert |
| 58.60 | Support | Recent range floor, demand zone | Buy zone with defined stop |
| 56.70 | Major support | Prior breakout retest level | Stop-out below for longs |
Three Scenarios
Continuation
Silver (XAG/USD) holds 60.1650 and extends higher on supply tightness or safe-haven demand. The structural trend supports continuation. Watch for follow-through above the pivot.
Range
Silver (XAG/USD) opens flat and churns around 60.1650. Digesting the recent move. Range trade with the trend as a tailwind.
Mean Reversion
Silver (XAG/USD) fades on dollar strength or demand concern, breaks below support. Mean reversion within the broader uptrend.
Risk Score
Risk sits at Around 50%
Risk sits around 50 per cent. Vix at 15.0 supports a measured risk posture. sentiment at 50 is neutral. Commodities carry supply-demand headline sensitivity. Standard sizing with defined stops — discipline beats conviction.
How to Walk It
Entry / Stop / Target structure:
- Long 58.60 pullback | Stop 56.70 | Target 61.10 | R:R 2:1
- Long 61.10 breakout | Stop 60.17 | Target 63.10 | R:R 1.5:1
- Fade 63.10 rejection | Stop above resistance | Target 60.17 | R:R 2:1
Experience-level guidance:
Beginner: Reduce size to half your standard. Trade only the cleanest setup from the entries above. If the tape opens against your bias, do nothing — wait for the second hour, when the institutional flow has tipped its hand.
Intermediate: Use the levels table to define the trading range. Fade the extremes with defined stops, take profits before the round-number resistance levels.
Advanced: The vol regime supports defined-risk structures around the key pivot levels. Keep notional small relative to your book — asymmetric speculation, not core positioning.
Continue Reading
The macro frame driving this read is unpacked in the session briefs:
Check the latest session briefs on the site.
This analysis is for educational and informational purposes only. It does not constitute financial advice. Always manage your risk independently and in accordance with your own financial circumstances.
Friday 10 Jul 2026
Silver (XAG/USD) — Daily Framework Read | Friday 10 July 2026
Silver (XAG/USD) | Post Close Setup Framework Read | Data basis: 2026-07-10 close
Where It Sits
Structure
Structurally Silver (XAG/USD) has pulled back into the session close. The broader trend remains intact on the daily timeframe but the shorter timeframe has softened. The structure is contested near the 60.1650 level.
Momentum
Momentum is neutral with internal readings near the centre of the range. That is the signature of a market digesting the prior move. The tape needs a fresh catalyst to commit to direction.
Volume & Flow
Flow on the session close was measured. Positioning data suggests steady accumulation rather than aggressive directional commitment. The pattern supports continuation rather than reversal.
Key Levels
| Level | Type | Significance | Action Zone |
|---|---|---|---|
| 63.10 | Resistance | Upper range target, prior supply zone | Take profits / fade if rejected |
| 61.10 | Pivot | Mid-range continuation marker | Hold = constructive; lose = consolidation |
| 60.17 | Session close | Reference anchor for next session | Above = continuation; below = mean revert |
| 58.60 | Support | Recent range floor, demand zone | Buy zone with defined stop |
| 56.70 | Major support | Prior breakout retest level | Stop-out below for longs |
Three Scenarios
Continuation
Silver (XAG/USD) holds 60.1650 and extends higher on supply tightness or safe-haven demand. The structural trend supports continuation. Watch for follow-through above the pivot.
Range
Silver (XAG/USD) opens flat and churns around 60.1650. Digesting the recent move. Range trade with the trend as a tailwind.
Mean Reversion
Silver (XAG/USD) fades on dollar strength or demand concern, breaks below support. Mean reversion within the broader uptrend.
Risk Score
Risk sits at Around 50%
Risk sits around 50 per cent. Vix at 15.0 supports a measured risk posture. sentiment at 50 is neutral. Commodities carry supply-demand headline sensitivity. Standard sizing with defined stops — discipline beats conviction.
How to Walk It
Entry / Stop / Target structure:
- Long 58.60 pullback | Stop 56.70 | Target 61.10 | R:R 2:1
- Long 61.10 breakout | Stop 60.17 | Target 63.10 | R:R 1.5:1
- Fade 63.10 rejection | Stop above resistance | Target 60.17 | R:R 2:1
Experience-level guidance:
Beginner: Reduce size to half your standard. Trade only the cleanest setup from the entries above. If the tape opens against your bias, do nothing — wait for the second hour, when the institutional flow has tipped its hand.
Intermediate: Use the levels table to define the trading range. Fade the extremes with defined stops, take profits before the round-number resistance levels.
Advanced: The vol regime supports defined-risk structures around the key pivot levels. Keep notional small relative to your book — asymmetric speculation, not core positioning.
Continue Reading
The macro frame driving this read is unpacked in the session briefs:
Check the latest session briefs on the site.
This analysis is for educational and informational purposes only. It does not constitute financial advice. Always manage your risk independently and in accordance with your own financial circumstances.
Thursday 9 Jul 2026
Crude Oil (WTI) — Daily Framework Read | Thursday 9 July 2026
Crude Oil (WTI) | Post Close Setup Framework Read | Data basis: 2026-07-09 close
Where It Sits
Structure
Structurally Crude Oil (WTI) has pulled back into the session close. The broader trend remains intact on the daily timeframe but the shorter timeframe has softened. The structure is contested near the 71.8100 level.
Momentum
Momentum is firm with the daily timeframe showing clear acceleration. Internal readings sit in the upper portion of the range. The risk is not that momentum fails but that it stalls at round-number resistance and triggers profit-taking.
Volume & Flow
Flow on the session close was measured. Positioning data suggests steady accumulation rather than aggressive directional commitment. The pattern supports continuation rather than reversal.
Key Levels
| Level | Type | Significance | Action Zone |
|---|---|---|---|
| 77.40 | Resistance | Upper range target, prior supply zone | Take profits / fade if rejected |
| 73.70 | Pivot | Mid-range continuation marker | Hold = constructive; lose = consolidation |
| 71.81 | Session close | Reference anchor for next session | Above = continuation; below = mean revert |
| 68.80 | Support | Recent range floor, demand zone | Buy zone with defined stop |
| 65.10 | Major support | Prior breakout retest level | Stop-out below for longs |
Three Scenarios
Continuation
Crude Oil (WTI) holds 71.8100 and extends higher on supply tightness or safe-haven demand. The structural trend supports continuation. Watch for follow-through above the pivot.
Range
Crude Oil (WTI) opens flat and churns around 71.8100. Digesting the recent move. Range trade with the trend as a tailwind.
Mean Reversion
Crude Oil (WTI) fades on dollar strength or demand concern, breaks below support. Mean reversion within the broader uptrend.
Risk Score
Risk sits at Around 50%
Risk sits around 50 per cent. Vix at 15.8 supports a measured risk posture. sentiment at 47 is neutral. Commodities carry supply-demand headline sensitivity. Standard sizing with defined stops — discipline beats conviction.
How to Walk It
Entry / Stop / Target structure:
- Long 68.80 pullback | Stop 65.10 | Target 73.70 | R:R 2:1
- Long 73.70 breakout | Stop 71.81 | Target 77.40 | R:R 1.5:1
- Fade 77.40 rejection | Stop above resistance | Target 71.81 | R:R 2:1
Experience-level guidance:
Beginner: Reduce size to half your standard. Trade only the cleanest setup from the entries above. If the tape opens against your bias, do nothing — wait for the second hour, when the institutional flow has tipped its hand.
Intermediate: Use the levels table to define the trading range. Fade the extremes with defined stops, take profits before the round-number resistance levels.
Advanced: The vol regime supports defined-risk structures around the key pivot levels. Keep notional small relative to your book — asymmetric speculation, not core positioning.
Continue Reading
The macro frame driving this read is unpacked in the session briefs:
Check the latest session briefs on the site.
This analysis is for educational and informational purposes only. It does not constitute financial advice. Always manage your risk independently and in accordance with your own financial circumstances.
Wednesday 8 Jul 2026
Crude Oil (WTI, CL) Rips 5.32% to $72.20 as Supply Premium Returns on a Rotation Day
Crude Oil WTI (CL) | Daily Framework Read | Tuesday 7 July 2026 (US close)
Where It Sits
Structure
A 5.32 percent single-session advance is an outsized move for crude by any measure, and the honest read is that it needs to be respected rather than chased blindly. The jump through $70.00 and on to $72.20 clears a supply-premium band that had been dormant for weeks, and the close near the session high is constructive: buyers were still in control into the bell rather than fading the spike. The immediate task for Wednesday is confirmation, does $72.20 hold as a floor on any pullback, or was this a one-day air pocket that mean-reverts once the rotation flow slows.
Momentum
Momentum flipped hard higher on the day and sits stretched in the near term after a move of this size. That is normal after a 5 percent-plus session and does not by itself invalidate the breakout, but it does argue against paying up for further extension without a pullback first. The more constructive path from here is a shallow retracement that holds above the old $68.55 to $70.00 shelf, consolidating the gain rather than giving it straight back.
Cross-Asset Flow
The read here matters more than the candle alone. Tech selling 1.77 percent on the Nasdaq 100 while crude ran 5.32 percent higher, gold eased back, and volatility stayed flat is a textbook rotation day: capital rotating sector to sector rather than fleeing to cash. That is a healthier backdrop for a breakout to hold than a move driven by a genuine risk event, because rotation flow tends to persist over several sessions rather than snapping back overnight.
Key Levels
| Level | Price | Why It Matters | Action |
|---|---|---|---|
| Resistance | $74.50 | Next round-number stretch target above tonight’s high, where the extended move likely meets its first real supply | Trim longs into strength, avoid fresh entries chasing into this zone |
| Pivot | $72.20 | Tuesday’s close and the line in the sand for whether the breakout holds or fades into Wednesday | Hold above keeps the bullish read alive, reclaim on any dip is the buy signal |
| Support | $70.00 | Round-number shelf and the top of the pre-breakout range, first real test of whether buyers defend the gain | Buy zone with a defined stop, loss of this level opens a retest of $68.55 |
Bias
Bullish, with discipline. A 5.32 percent close at the session high, on a day when equities rotated out of tech and volatility stayed flat, is a genuine supply-premium reassertion rather than a fear trade. The bias favours buying confirmed dips toward $70.00 to $72.20 over chasing strength into $74.50, at least until the move has had one session to consolidate.
Multi-Strategy Breakdown
Scalp
Fade wicks above $73.50 back toward $72.20 on the first pullback attempt, tight stops given the elevated intraday range after a move this size.
Intraday
Buy a defended retest of $70.00 to $71.00 for a push back to $72.20 to $74.50, stand aside if price breaks $70.00 with conviction.
Swing
Hold or add on any close back above $72.20 after a pullback, targeting $74.50 and beyond if the rotation into energy extends over coming sessions.
Risk Score
Risk sits at 60% heading into Wednesday.
Risk is elevated because a 5.32 percent single-session move carries genuine two-way snap-back potential, even though the flow behind it was orderly rather than panicked. Size positions down from standard, use defined stops below $70.00 for longs, and avoid adding fresh exposure into $74.50 until Wednesday confirms the gain is holding rather than round-tripping.
Three Scenarios Into Wednesday
Continuation
Crude holds above $72.20 through the session and pushes on toward $74.50 as the tech-to-energy rotation extends into a second day.
Consolidation
Crude digests the move, ranging $70.00 to $72.20 as buyers and profit-takers fight it out without a fresh directional catalyst.
Reversal
Rotation flow stalls or reverses, crude gives back through $70.00 toward $68.55 as tech stabilises and the energy bid unwinds.
Position Sizing
| Sizing | Applies When | Why |
|---|---|---|
| MAX | Not applicable tonight | A 5.32 percent single-day move is not the setting for maximum size on either side |
| STANDARD | Longs entered on a confirmed hold of $70.00 to $72.20 | The rotation backdrop and calm VIX support normal sizing on a defended dip |
| REDUCED | Applies now, this is today’s setting | Elevated volatility after an outsized move warrants smaller size on both fresh longs and any counter-trend shorts |
| AVOID | Chasing strength above $74.50 without a pullback | Paying up into stretched momentum after a 5 percent day offers poor risk to reward |
Continue Reading
The full cross-asset picture behind tonight’s rotation is unpacked in the session recap:
Tuesday Post-Close: Energy In, Tech Out, A Rebalance Not A Risk-Off
This is analysis, not financial advice. Always manage your risk.
Friday 3 Jul 2026
Crude Oil (WTI) – Daily Read
July 2, 2026 | Commodity | Titan Macro Desk
$88.58
The analysis reads accumulation. Smart money appears to be quietly building positions. This typically precedes a markup phase. Ethical screening: FAIL. This security does not pass our values-based screening criteria. The risk-adjusted return profile shows modest positive risk-adjusted returns.

Framework Metrics
This read is generated by the Titan framework and reflects our multi-factor analytical model. It is not financial advice. Past performance is not indicative of future results. Always conduct your own research before making investment decisions.
Thursday 2 Jul 2026
Crude Oil (WTI) – Daily Read
July 2, 2026 | Commodity | Titan Macro Desk
$88.58
The analysis reads accumulation. Smart money appears to be quietly building positions. This typically precedes a markup phase. Ethical screening: FAIL. This security does not pass our values-based screening criteria. The risk-adjusted return profile shows modest positive risk-adjusted returns.
Framework Metrics
This read is generated by the Titan framework and reflects our multi-factor analytical model. It is not financial advice. Past performance is not indicative of future results. Always conduct your own research before making investment decisions.