Crude Oil (WTI) – Daily Read
17 September 2026 | Commodity | Titan Macro Desk
$101.95
WTI is testing the upper edge of its recent range with the trend still firmly higher, but the market is stretched enough that execution matters more than enthusiasm. Last price $101.95, 0.2 percent lower on the day. That modest dip does not alter the broader message: buyers remain in control near the highs, and the next meaningful move should determine whether this is consolidation before another advance or the start of a deeper reset. The clear view is constructive while price holds the nearby psychological zone, although chasing strength without confirmation carries poor risk and reward.
The macro backdrop is supportive but contested. Oil is balancing supply discipline and geopolitical risk against uncertainty around global demand, inflation pressure, and the policy response. Those forces matter because crude is both a physical commodity and a macro barometer. Tightness or disruption can quickly command a premium, while weaker consumption expectations can unwind that premium just as quickly. WTI is pressing the top of its one-month range. The one month average $92.64 sits well beneath the market; price is above it, and the structure reads as a clean uptrend, price above both its one-month and longer averages. Momentum roughly 11.4 percent up over the last two weeks confirms forceful buying, but also raises the chance of profit-taking if fresh catalysts fail to appear.
The immediate battle is around the nearer round number handles at $102.00 and $100.00. Holding above $100.00 would show that buyers are willing to defend the latest leg higher, while acceptance above $102.00 would reinforce the case that supply near the range ceiling is being absorbed. The month swing high $105.63, about 3.6 percent above the current price, is the principal upside gate because it marks where the advance previously met its strongest resistance. Beneath the market, a shelf of support at $79.62, about 21.9 percent below, represents the deeper structural defense. The three month range $68.08 to $105.63 shows how close price is to the upper boundary and how much air exists below if positioning reverses.
The bull path is straightforward: if WTI holds $100.00, reclaims $102.00 with conviction, and then clears the range ceiling, a decisive move above $105.63 opens the path toward $107.63. That sequence would indicate that buyers have converted resistance into acceptance and that the market is repricing toward a higher trading zone. The bear path begins if price repeatedly fails around $102.00 and falls through $100.00. That would signal exhaustion rather than healthy consolidation, with the distance from the one month average $92.64 leaving room for a sharper normalization. If selling eventually overwhelms the major shelf, losing $79.62 exposes $68.08.
The central risk is a catalyst reversal, whether from easing supply concerns, softer demand expectations, or a broader liquidation across commodities. The constructive read is invalidated by sustained failure below $100.00, especially if rebounds become weaker and price starts migrating back toward its underlying structure. The larger bullish regime is not fully broken unless $79.62 gives way, but waiting for that confirmation would concede substantial downside. Net, WTI remains bullish near resistance: respect the trend, demand confirmation above the ceiling, and treat loss of nearby support as an early warning that momentum has outrun conviction.
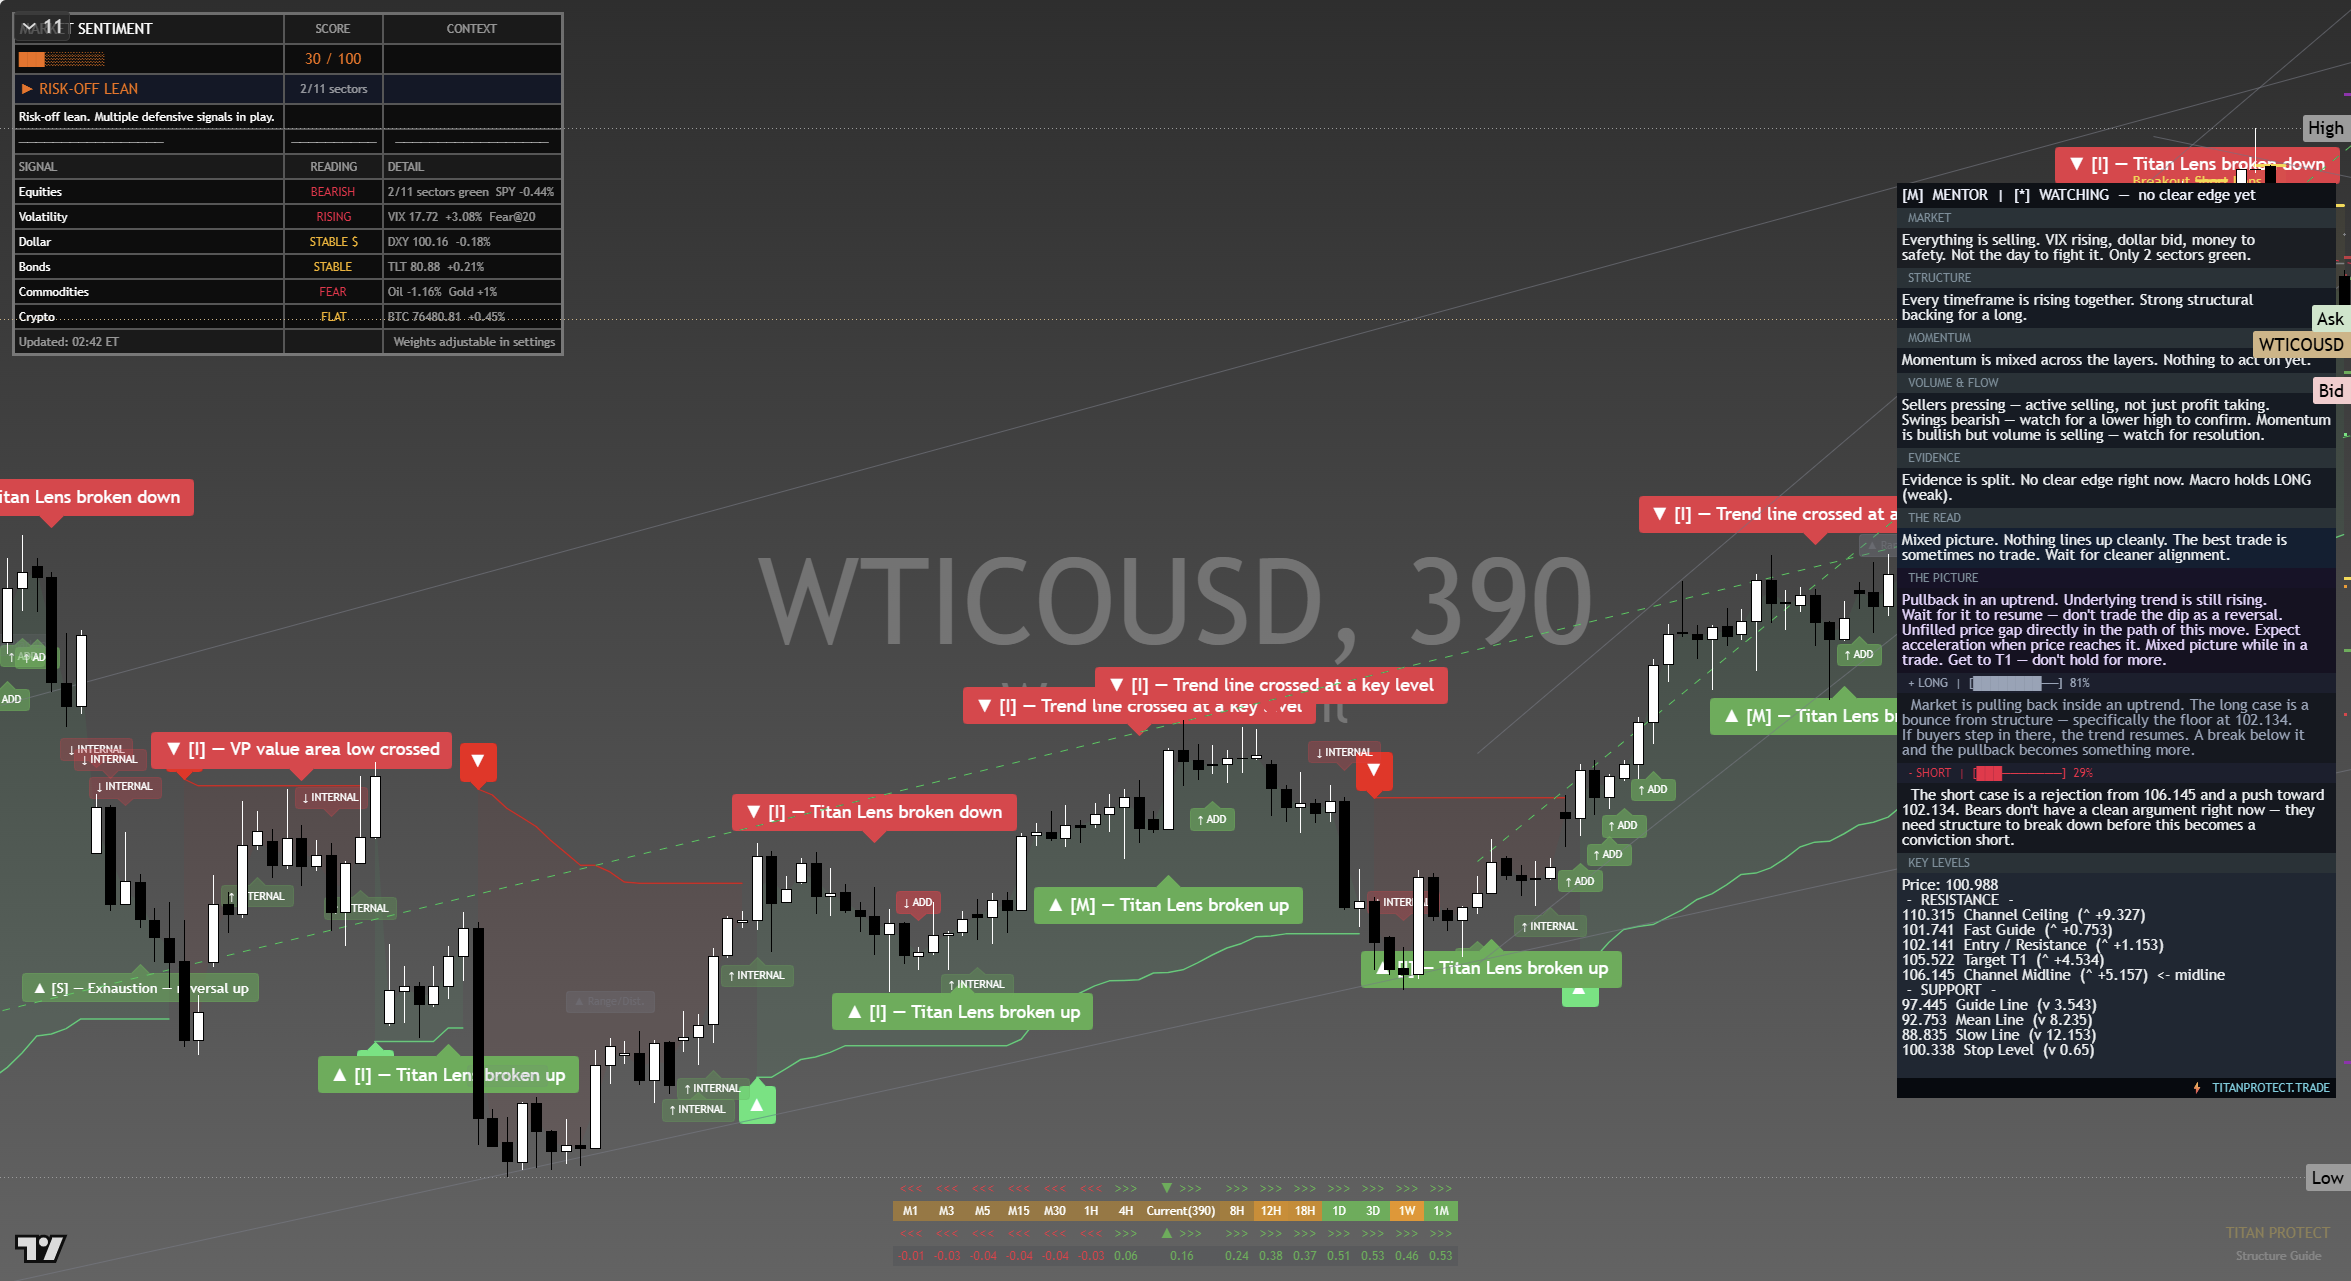
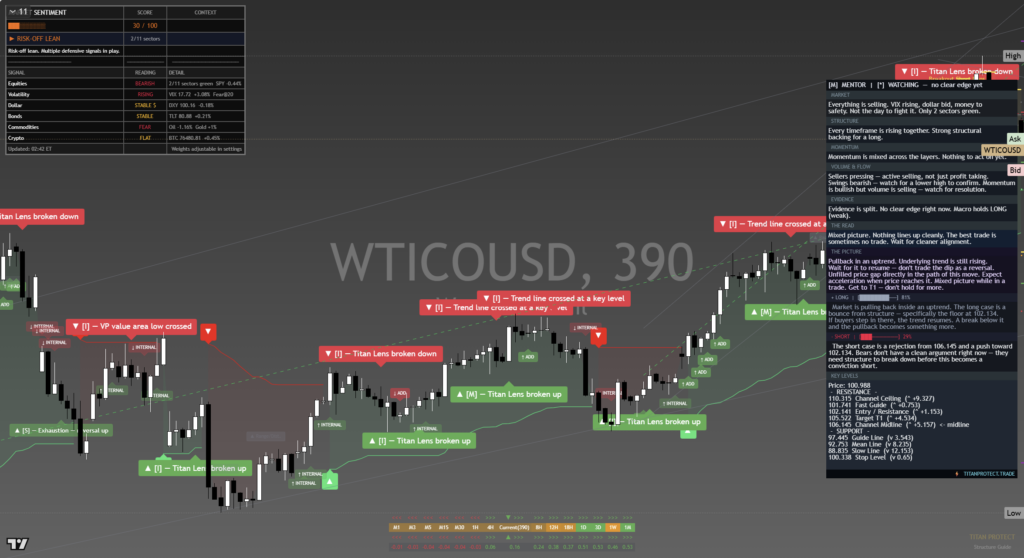
The chart above is the full daily read: structure, momentum, the levels that matter, and where the current price sits against them. Read it top to bottom for the complete picture, and pair it with our session briefs for the wider market context.
This is analysis, not financial advice. It reflects our multi-factor framework and is not a recommendation to buy or sell. Always do your own research and manage your risk.