Crude Oil (WTI) – Daily Read
16 September 2026 | Commodity | Titan Macro Desk
$105.42
WTI is in a forceful upside extension, with the last price at $105.42, 2.3 percent higher on the day, and pressing the top of its one-month range. The clear view is that buyers remain in control, but the market is now testing the point where trend strength must convert into a confirmed breakout. That matters because failure near the range ceiling could trigger fast profit-taking, while acceptance above it would show that demand is still willing to chase increasingly expensive barrels.
The broader macro backdrop is a contest between supply sensitivity and uncertainty around global demand, interest rates, and the dollar. At this stage, price action suggests the oil market is giving greater weight to potential tightness than to growth concerns. Crude is particularly responsive to changes in physical availability, inventory expectations, producer discipline, geopolitical risk, and refining demand. When those forces align with sustained buying, moves can become self-reinforcing as consumers hedge exposure and short positions retreat. Momentum is roughly 15.0 percent up over the last two weeks, so positioning is likely more crowded than it was earlier in the advance. That strengthens the trend, but it also raises the cost of any disappointment.
The one month average is $91.92; price is above it, and the structure reads as a clean uptrend, price above both its one-month and longer averages. That gap shows strong sponsorship, although it also leaves the market vulnerable to a deeper reset if buyers stop defending pullbacks. The month swing high is $105.63, about 0.2 percent above the current price. This is the immediate decision point because it represents the visible boundary of the current range. The nearer round number handles at $106.00 and $104.00 frame the short-term battle. Holding $104.00 would indicate that buyers are absorbing supply close to the highs, while slipping below it would suggest the breakout attempt is losing urgency. A decisive move above $105.63 opens the path toward $106.00, where acceptance would reinforce the case for continued price discovery.
The wider three month range is $68.08 to $105.63, which shows how far the market has travelled and why volatility around the upper boundary may be sharp. A shelf of support at $79.62, about 24.5 percent below, is the major structural defense. It marks the area where a broad correction would need to stabilize to preserve the larger bullish regime. Losing $79.62 exposes $68.08 and would signal that the advance has shifted from correction into structural failure.
The bull path is straightforward: if WTI clears $105.63 decisively, holds above that former ceiling, and then establishes trade through $106.00, the market should remain biased toward continuation as sidelined buyers and defensive hedgers follow the break. The bear path begins if price cannot sustain the challenge, loses $104.00, and starts attracting selling rather than dip demand. If that weakness expands toward $91.92, the move would look increasingly like exhaustion rather than consolidation.
The main risk to the bullish read is a sudden easing of supply anxiety, weaker physical demand, or a macro shock that strengthens the dollar and reduces risk appetite. Durable failure below $91.92 would invalidate the near-term momentum thesis; losing $79.62 would invalidate the broader structure. Net, the trend remains bullish, but confirmation above $105.63 is now more important than enthusiasm beneath it.
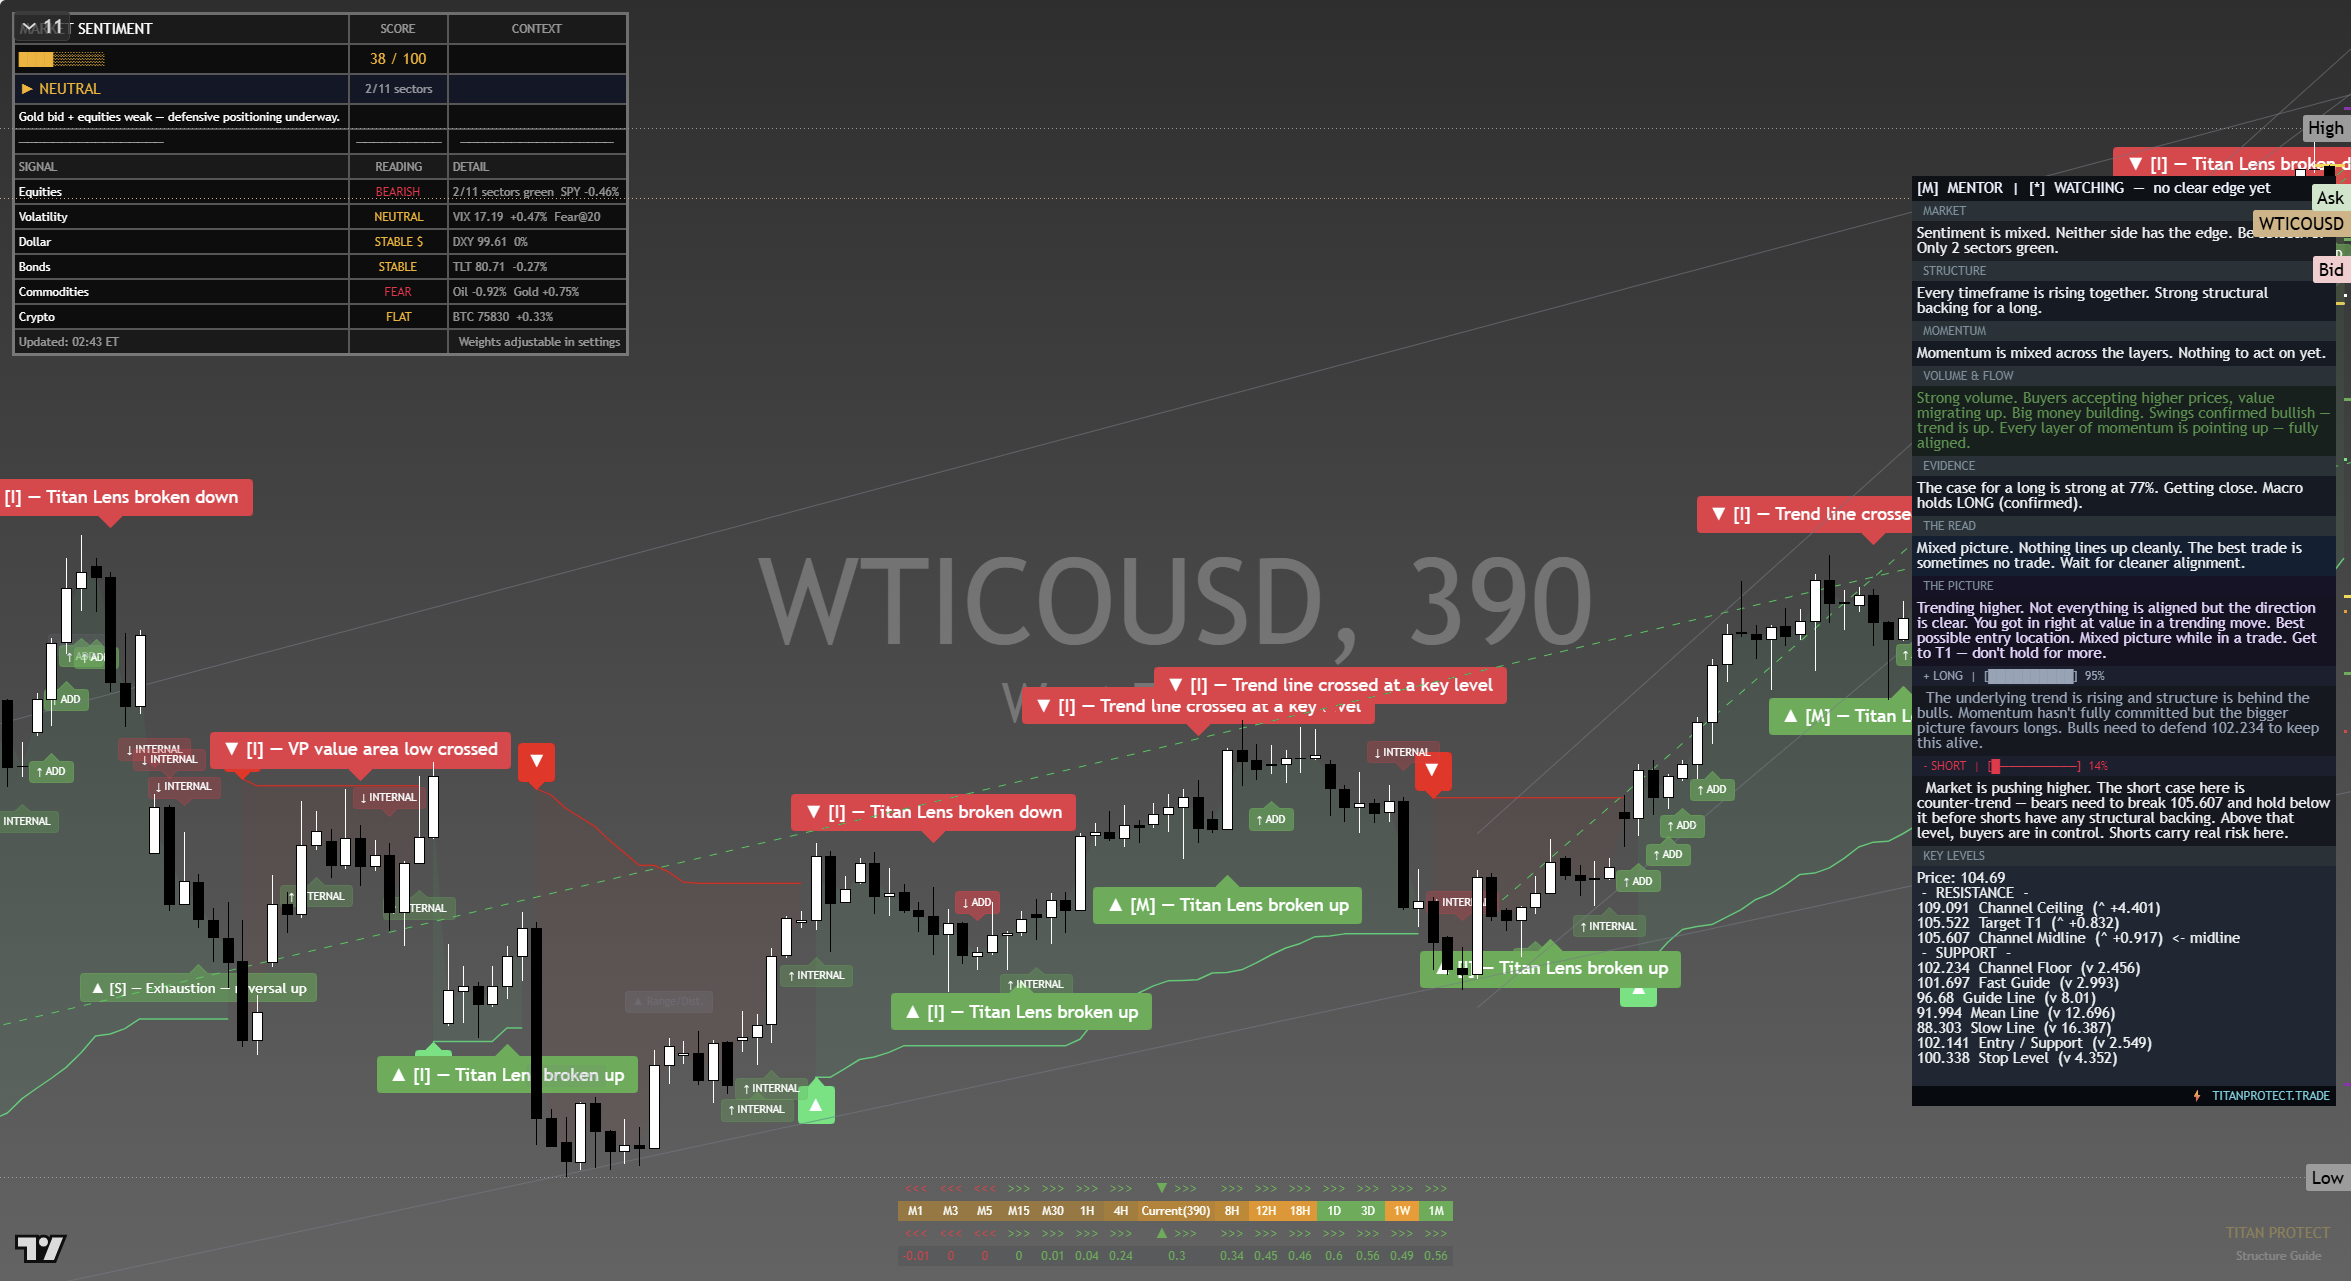
The chart above is the full daily read: structure, momentum, the levels that matter, and where the current price sits against them. Read it top to bottom for the complete picture, and pair it with our session briefs for the wider market context.
This is analysis, not financial advice. It reflects our multi-factor framework and is not a recommendation to buy or sell. Always do your own research and manage your risk.