
The Silver Framework Journal for May 2026, newest read at the top. Each dated entry is our read on the close, kept as a living record so the framework can be judged over time. This is analysis, not financial advice.
Saturday 30 May 2026
Silver (XAG/USD) — Daily Read | Saturday 30 May 2026
Silver (XAG/USD) | Post Close Setup Daily Read | Data basis: 2026-05-30 close
Where It Sits
Structure
Structurally Silver (XAG/USD) sits above its short-term moving averages with the daily trend firmly higher. The recent advance has been orderly with no signs of distribution or topping behaviour. The reference anchor at 75.9700 acts as the bias line.
Momentum
Momentum is neutral with internal readings near the centre of the range. That is the signature of a market digesting the prior move. The tape needs a fresh catalyst to commit to direction.
Volume & Flow
Flow on the session close was measured. Positioning data suggests steady accumulation rather than aggressive directional commitment. The pattern supports continuation rather than reversal.
Key Levels
| Level | Type | Significance | Action Zone |
|---|---|---|---|
| 79.20 | Resistance | Upper range target, prior supply zone | Take profits / fade if rejected |
| 77.00 | Pivot | Mid-range continuation marker | Hold = constructive; lose = consolidation |
| 75.97 | Session close | Reference anchor for next session | Above = continuation; below = mean revert |
| 74.30 | Support | Recent range floor, demand zone | Buy zone with defined stop |
| 72.10 | Major support | Prior breakout retest level | Stop-out below for longs |
Three Scenarios
Continuation
Silver (XAG/USD) holds 75.9700 and extends higher on supply tightness or safe-haven demand. The structural trend supports continuation. Watch for follow-through above the pivot.
Range
Silver (XAG/USD) opens flat and churns around 75.9700. Digesting the recent move. Range trade with the trend as a tailwind.
Mean Reversion
Silver (XAG/USD) fades on dollar strength or demand concern, breaks below support. Mean reversion within the broader uptrend.
Risk Score
Risk sits at Around 55%
Risk sits around 55 per cent. Vix at 15.4 supports a measured risk posture. sentiment at 61 is in greed territory. Commodities carry supply-demand headline sensitivity. Standard sizing with defined stops — discipline beats conviction.
How to Walk It
Entry / Stop / Target structure:
- Long 74.30 pullback | Stop 72.10 | Target 77.00 | R:R 2:1
- Long 77.00 breakout | Stop 75.97 | Target 79.20 | R:R 1.5:1
- Fade 79.20 rejection | Stop above resistance | Target 75.97 | R:R 2:1
Experience-level guidance:
Beginner: Reduce size to half your standard. Trade only the cleanest setup from the entries above. If the tape opens against your bias, do nothing — wait for the second hour, when the institutional flow has tipped its hand.
Intermediate: Use the levels table to define the trading range. Fade the extremes with defined stops, take profits before the round-number resistance levels.
Advanced: The vol regime supports defined-risk structures around the key pivot levels. Keep notional small relative to your book — asymmetric speculation, not core positioning.
Continue Reading
The macro frame driving this read is unpacked in the session briefs:
Check the latest session briefs on the site.
This analysis is for educational and informational purposes only. It does not constitute financial advice. Always manage your risk independently and in accordance with your own financial circumstances.
Thursday 28 May 2026
Crude Oil (WTI) — Daily Framework Read | Thursday 28 May 2026
Crude Oil (WTI) | Post Close Setup Daily Read | Data basis: 2026-05-28 close
Where It Sits
Structure
Structurally Crude Oil (WTI) sits above its short-term moving averages with the daily trend firmly higher. The recent advance has been orderly with no signs of distribution or topping behaviour. The reference anchor at 89.3500 acts as the bias line.
Momentum
Momentum is positive but measured. The advance has been orderly without stretching the range. Internal readings are constructive without flagging exhaustion — supportive of continuation.
Volume & Flow
Flow on the session close was measured. Positioning data suggests steady accumulation rather than aggressive directional commitment. The pattern supports continuation rather than reversal.
Key Levels
| Level | Type | Significance | Action Zone |
|---|---|---|---|
| 97.50 | Resistance | Upper range target, prior supply zone | Take profits / fade if rejected |
| 92.10 | Pivot | Mid-range continuation marker | Hold = constructive; lose = consolidation |
| 89.35 | Session close | Reference anchor for next session | Above = continuation; below = mean revert |
| 85.00 | Support | Recent range floor, demand zone | Buy zone with defined stop |
| 79.60 | Major support | Prior breakout retest level | Stop-out below for longs |
Three Scenarios
Continuation
Crude Oil (WTI) holds 89.3500 and extends higher on supply tightness or safe-haven demand. The structural trend supports continuation. Watch for follow-through above the pivot.
Range
Crude Oil (WTI) opens flat and churns around 89.3500. Digesting the recent move. Range trade with the trend as a tailwind.
Mean Reversion
Crude Oil (WTI) fades on dollar strength or demand concern, breaks below support. Mean reversion within the broader uptrend.
Risk Score
Risk sits at Around 55%
Risk sits around 55 per cent. Vix at 15.7 supports a measured risk posture. sentiment at 60 is in greed territory. Commodities carry supply-demand headline sensitivity. Standard sizing with defined stops — discipline beats conviction.
How to Walk It
Entry / Stop / Target structure:
- Long 85.00 pullback | Stop 79.60 | Target 92.10 | R:R 2:1
- Long 92.10 breakout | Stop 89.35 | Target 97.50 | R:R 1.5:1
- Fade 97.50 rejection | Stop above resistance | Target 89.35 | R:R 2:1
Experience-level guidance:
Beginner: Reduce size to half your standard. Trade only the cleanest setup from the entries above. If the tape opens against your bias, do nothing — wait for the second hour, when the institutional flow has tipped its hand.
Intermediate: Use the levels table to define the trading range. Fade the extremes with defined stops, take profits before the round-number resistance levels.
Advanced: The vol regime supports defined-risk structures around the key pivot levels. Keep notional small relative to your book — asymmetric speculation, not core positioning.
Continue Reading
The macro frame driving this read is unpacked in the session briefs:
Check the latest session briefs on the site.
This analysis is for educational and informational purposes only. It does not constitute financial advice. Always manage your risk independently and in accordance with your own financial circumstances.
Thursday 28 May 2026
Crude Oil (WTI) — Daily Framework Read | Thursday 28 May 2026
Crude Oil (WTI) | Pre Asia Setup Daily Read | Data basis: 2026-05-28 close
Where It Sits
Structure
Structurally Crude Oil (WTI) has pulled back into the session close. The broader trend remains intact on the daily timeframe but the shorter timeframe has softened. The structure is contested near the 89.7100 level.
Momentum
Momentum is firm with the daily timeframe showing clear acceleration. Internal readings sit in the upper portion of the range. The risk is not that momentum fails but that it stalls at round-number resistance and triggers profit-taking.
Volume & Flow
Flow on the session close was measured. Positioning data suggests steady accumulation rather than aggressive directional commitment. The pattern supports continuation rather than reversal.
Key Levels
| Level | Type | Significance | Action Zone |
|---|---|---|---|
| 91.20 | Resistance | Upper range target, prior supply zone | Take profits / fade if rejected |
| 90.20 | Pivot | Mid-range continuation marker | Hold = constructive; lose = consolidation |
| 89.71 | Session close | Reference anchor for next session | Above = continuation; below = mean revert |
| 88.90 | Support | Recent range floor, demand zone | Buy zone with defined stop |
| 88.00 | Major support | Prior breakout retest level | Stop-out below for longs |
Three Scenarios
Continuation
Crude Oil (WTI) holds 89.7100 and extends higher on supply tightness or safe-haven demand. The structural trend supports continuation. Watch for follow-through above the pivot.
Range
Crude Oil (WTI) opens flat and churns around 89.7100. Digesting the recent move. Range trade with the trend as a tailwind.
Mean Reversion
Crude Oil (WTI) fades on dollar strength or demand concern, breaks below support. Mean reversion within the broader uptrend.
Risk Score
Risk sits at Around 55%
Risk sits around 55 per cent. Vix at 16.3 supports a measured risk posture. sentiment at 61 is in greed territory. Commodities carry supply-demand headline sensitivity. Standard sizing with defined stops — discipline beats conviction.
How to Walk It
Entry / Stop / Target structure:
- Long 88.90 pullback | Stop 88.00 | Target 90.20 | R:R 2:1
- Long 90.20 breakout | Stop 89.71 | Target 91.20 | R:R 1.5:1
- Fade 91.20 rejection | Stop above resistance | Target 89.71 | R:R 2:1
Experience-level guidance:
Beginner: Reduce size to half your standard. Trade only the cleanest setup from the entries above. If the tape opens against your bias, do nothing — wait for the second hour, when the institutional flow has tipped its hand.
Intermediate: Use the levels table to define the trading range. Fade the extremes with defined stops, take profits before the round-number resistance levels.
Advanced: The vol regime supports defined-risk structures around the key pivot levels. Keep notional small relative to your book — asymmetric speculation, not core positioning.
Continue Reading
The macro frame driving this read is unpacked in the session briefs:
Check the latest session briefs on the site.
This analysis is for educational and informational purposes only. It does not constitute financial advice. Always manage your risk independently and in accordance with your own financial circumstances.
Tuesday 26 May 2026
Silver (XAG/USD)
REVERSAL SIGNAL
Friday Close · 25 May 2026 · 390-min
The Read
Silver has hit a significant rejection zone and the momentum has visibly turned. The framework flagged a reversal at a key Fibonacci extension, and price has since rolled over sharply. This is not a slow grind — the selling was swift, and that tells you there were leveraged longs caught on the wrong side. When the unwinding of that positioning finishes, Silver tends to base and then make a clean directional move.
What makes Silver different from Gold right now is its dual sensitivity. Silver tracks Gold as a safe haven, but it also responds to industrial demand. With global manufacturing data sending mixed signals, any weakness in the growth outlook hits Silver harder than Gold. The rejection from the highs is therefore not purely macro noise — there is a fundamental question underneath it. That said, the structural support from the precious metals complex overall means any deep sell-off is likely to find buyers relatively quickly.
The retracement level that held previously is the first line to watch. The framework noted that retracement zone as significant, and a failure to hold it cleanly on a closing basis opens the door to a deeper flush. Bulls need to see a stabilisation and a higher low forming before they can step back in confidently. Sellers need to see continuation below the current retracement holding zone. Neither side should be forcing a trade into a weekend close without clear confirmation.
Key Levels
| Level | Price | Notes |
|---|---|---|
| Short Entry | $33.65 | Bounce into rejection zone |
| Stop | $33.90 | Above prior swing high |
| Target 1 | $32.80 | Retracement support base |
| R:R | 3.4:1 | Clean setup structure |
Risk
Around 60% — Silver is notoriously volatile around reversals. The Fibonacci rejection is a genuine signal, but false reversals in Silver happen regularly. The spread between spot and futures can widen over weekends, and thin Sunday-Monday open liquidity has a habit of triggering stops before the real move develops. Size accordingly.
Experience Guidance
Silver suits traders who understand that volatility is a feature, not a bug. If you are comfortable trading wider stops and accepting that the path to your target will not be smooth, the setup here is worth watching. If sharp 2% intraday swings make you want to close early, sit this one out. The best Silver trades come to those who can stay with the position through the noise and trust the structure rather than reacting to every spike.
Saturday 23 May 2026
Silver (SILVER / XAG/USD) — Weekend Daily Read
Framework Bias
LONG BIAS
Silver at $75.89 is in extraordinary price territory. Like gold, silver has been propelled higher by the combination of dollar weakness, safe-haven demand, and a new structural driver: the energy transition. Silver is a critical industrial input for solar panels, electric vehicle batteries, and electronics broadly. Global solar installation capacity is growing at over 20% per annum, and silver is irreplaceable in photovoltaic cell manufacturing.
Friday’s 0.68% decline is slightly larger than gold’s 0.41% drop, which is typical. Silver is the higher-beta version of the gold trade. When metals are strong, silver outperforms gold. When metals dip, silver drops more. The gold/silver ratio at approximately 59.6 (4521/75.89) has compressed significantly from the 80-plus levels of two years ago, reflecting silver’s catch-up trade. Further compression toward 50 remains a medium-term thesis.
The framework is long silver on dips. The $75 round number is the key support level. Above $75, the framework remains constructively positioned for the next leg higher toward $80. Below $73, a more cautious view is warranted pending reassessment.
Key Levels
| Level Type | Price | Note |
|---|---|---|
| Major Resistance | $85.00 | Extension target and historical significance |
| Near Resistance | $80.00 | Round number and near-term target |
| Current Price | $75.89 | Friday close |
| Key Support | $75.00 | Round number — critical bull/bear dividing line |
| Major Support | $72.00 | Prior breakout level and weekly demand |
| Deep Support | $68.00 | Monthly structural demand |
Trade Framework
| Scenario | Entry Zone | Stop | Target | R:R |
|---|---|---|---|---|
| Long on $75.00 support hold | $75.10 to $75.50 | $73.80 | $79.50 | approx 3.3:1 |
| Long on $76.10 break above Friday high | $76.20 | $74.80 | $80.00 | approx 2.9:1 |
| Short on industrial demand collapse | $73.00 break | $74.50 | $68.50 | approx 3.0:1 |
Confidence level: around 66%. Silver’s dual role as precious metal and industrial commodity creates two supportive pillars. The 66% confidence reflects silver’s higher volatility relative to gold and the reliance on continued Chinese industrial demand. Both pillars are intact but silver requires monitoring on both the monetary and industrial sides.
Weekend Context
The gold/silver ratio compression is the key medium-term trade in precious metals. When the ratio falls (silver outperforms gold), it typically reflects a market that is becoming more confident about economic growth and industrial demand. That is the scenario that is playing out now. If the ratio continues to compress from 59.6 toward 50, it implies silver has another 15-20% of catch-up potential even if gold stands still.
The solar energy connection is not a trade; it is a decade-long structural theme. Every major economy has made commitments to solar expansion that require silver. That guaranteed industrial demand pipeline provides a floor under the silver price that simply did not exist five years ago. It is why silver’s long-term bull case is arguably more compelling than gold’s, even though gold gets more media attention.
Over the holiday weekend, Chinese PMI or any manufacturing data surprise would move silver faster than gold. Watch Shanghai metals trading on Monday for early signals. A positive China data point over the weekend (even unofficial) would likely see silver outperform gold on Monday’s Asian open.
Friday 22 May 2026
COMMODITIES | Friday 22 May 2026
Silver: Outrunning Gold and That Is a Signal Worth Watching
Thursday close: $76.90 | Daily change: +0.63% | Bias: Bullish Momentum
Current Read
Silver gained 0.63% on Thursday while gold lost 0.21%. That divergence is the headline here. When silver outperforms gold in a meaningful way, it typically signals one of two things: either speculative appetite for the precious metals complex is rising, or there is industrial demand coming through that gold does not benefit from in the same way. Given that copper was also making moves this week, the industrial demand story appears to be contributing.
Silver at $76.90 is at a level that would have seemed extraordinary even twelve months ago. The metal has been caught in a structural bull market driven by the same forces lifting gold, plus an additional tailwind from its industrial applications in solar panels, electric vehicles, and power grid infrastructure. Demand for silver in the energy transition context is genuinely structural and is not priced in the way it probably should be.
The gold-to-silver ratio is worth monitoring. If silver continues to outperform gold, the ratio compresses, which historically has occurred during the strongest phases of precious metals bull markets. This is the kind of environment where silver’s tendency to move faster and further than gold in both directions becomes a trading advantage rather than just a risk.
Key Levels
What Changed Thursday
Thursday’s 0.63% gain in silver while gold dipped is the chart’s way of telling you that this is not just a safe haven story. Safe haven buyers go to gold when they are nervous. Industrial metal buyers go to silver when they see demand. The fact that silver led on a day with marginally firmer US data and a slight dollar bid suggests the industrial demand story is doing real work here.
Copper’s constructive performance this week supports this reading. When copper and silver both show strength simultaneously, the narrative points toward global manufacturing and infrastructure investment themes rather than pure risk aversion. That is a more durable driver than fear.
Friday Scenarios
Bull Case
Silver extends Thursday’s momentum through $77.50 and tests $78.50. Copper staying firm and gold recovering would both support this outcome. The path toward $80 opens if the industrial demand narrative gains traction through the week’s close. Friday’s low volume could amplify the move.
Base Case
Silver consolidates between $76 and $77.50 after Thursday’s gain. A brief rest after a strong day is natural and does not change the weekly picture. Gold holding above $4,500 would be the companion signal confirming stability in the precious metals complex.
Bear Case
A sharp reversal below $75.50 would erase Thursday’s gains and signal that the outperformance was a one-day anomaly. Silver is more volatile than gold, so the bear case move would be sharper. Watch copper: if copper sells off on Friday, silver is unlikely to hold its gains independently.
Sizing and Approach
Silver is a wilder ride than gold. At $76.90, a 1% move in either direction is nearly $0.77 per ounce. Position sizing needs to account for that volatility. If you are running a long, stops need to be at least below $75.50 to have a fighting chance of surviving intraday noise.
Thursday’s strength gives longs a good entry reference. Any pullback toward $75.50-$76 on Friday would be a better risk-reward entry point for new positions than chasing at $76.90. The $80 target is real but is not going to be reached on a Friday, so patience is the right posture.
Cross-References
- Gold: The most direct companion. When gold dips and silver gains, as on Thursday, the industrial demand story is leading. Watch for convergence or continued divergence.
- Copper: The bellwether for industrial metals demand. Copper at $6.32 and constructive supports the silver industrial thesis.
- DXY: Dollar strength is a headwind for all dollar-denominated metals. Watch 99.50 as the key dollar resistance on Friday.
- Crude Oil: Another industrial commodity that serves as a read on global growth expectations. Crude near $97 is supportive of the broader commodity complex.
Tuesday 19 May 2026
Silver Closes Above $78 But Struggles to Match Gold’s Momentum
Monday 18 May 2026 | Commodities | SILVER
Session Summary
Silver closed at $78.04 on Monday, gaining 1.13% on the day after a wide-ranging session that saw price trade from a low of $74.11 all the way to $78.62 before settling just below the highs. The open was $76.21, meaning Monday’s range spanned nearly $4.50 — more than five times Tuesday’s expected daily move for an asset at this price. Volume of 52,015 contracts confirmed this was not a thin-market drift.
Daily Read
Silver is trading in the shadow of gold rather than leading its own narrative. The gold-silver ratio remains historically elevated, which tells you two things: first, the market is pricing silver more as an industrial metal than a pure monetary hedge right now; second, when safe haven demand is the driver — as it is today — silver underperforms because it carries a heavier growth dependency.
The wide Monday range including the $74.11 low is a warning sign. That early weakness tested the conviction of longs before recovering. A retest of the $74 area on Tuesday is possible and would need to hold cleanly to preserve the bullish structure. The broader dollar softness (DXY at 98.96) is a tailwind, but silver needs independent industrial demand catalysts — specifically continued positive signals from the China trade deal — to convincingly run higher.
Key Levels
| Level | Price | Context |
|---|---|---|
| Resistance | $79.00 — $80.00 | Round number cluster; sellers defended the $78.62 intraday high with a rejection wick |
| Entry (long) | $76.00 — $76.50 | Monday’s open and midpoint of the range; valid re-entry zone if price pulls back overnight |
| Stop | $74.00 | Below Monday’s low; a close under this level resets the bullish structure entirely |
| Target 1 | $78.50 | Retest of Monday’s intraday high; partial profit zone |
| Target 2 | $80.50 | Extension above $80 psychological barrier; R:R approximately 1.8:1 from entry |
Tomorrow’s Setup
Bias: Neutral to cautiously bullish, with wide parameters. The recovery from $74.11 to close near the highs is encouraging, but the size of Monday’s range creates uncertainty about where Tuesday’s anchor is.
- Bull scenario: Asian session holds above $77 and London session takes a run at $79. A clean break of Monday’s high sets up a push towards $80.
- Bear scenario: Overnight consolidation gives way to a re-test of $75 — $74 support. If the $74 low breaks on volume, the Monday range is invalidated and the next meaningful support is around $71.
- Watch for: Any China-related macro commentary on Tuesday. Silver’s industrial component means it is more sensitive to growth expectations than gold.
Experience Guidance
New to silver trading: A $4.50 intraday range tells you this market is not for tight stops right now — size down accordingly or wait for the range to compress.
Developing trader: Silver lagging gold on a safe haven day is a tell — use it as a screening signal rather than a primary trade vehicle when risk-off is the driver.
Experienced trader: The gold-silver ratio compression trade becomes interesting above $80 silver if gold simultaneously presses $4,600 — that is the convergence point to watch for a tactical short on the ratio.
This content is for informational and educational purposes only and does not constitute financial advice. Past performance is not indicative of future results. All trading involves risk. Always conduct your own research before making any investment decisions.
Monday 18 May 2026
Silver Closes Above $78 But Struggles to Match Gold’s Momentum
Monday 18 May 2026 | Commodities | SILVER
Session Summary
Silver closed at $78.04 on Monday, gaining 1.13% on the day after a wide-ranging session that saw price trade from a low of $74.11 all the way to $78.62 before settling just below the highs. The open was $76.21, meaning Monday’s range spanned nearly $4.50 — more than five times Tuesday’s expected daily move for an asset at this price. Volume of 52,015 contracts confirmed this was not a thin-market drift.
Daily Read
Silver is trading in the shadow of gold rather than leading its own narrative. The gold-silver ratio remains historically elevated, which tells you two things: first, the market is pricing silver more as an industrial metal than a pure monetary hedge right now; second, when safe haven demand is the driver — as it is today — silver underperforms because it carries a heavier growth dependency.
The wide Monday range including the $74.11 low is a warning sign. That early weakness tested the conviction of longs before recovering. A retest of the $74 area on Tuesday is possible and would need to hold cleanly to preserve the bullish structure. The broader dollar softness (DXY at 98.96) is a tailwind, but silver needs independent industrial demand catalysts — specifically continued positive signals from the China trade deal — to convincingly run higher.
Key Levels
| Level | Price | Context |
|---|---|---|
| Resistance | $79.00 — $80.00 | Round number cluster; sellers defended the $78.62 intraday high with a rejection wick |
| Entry (long) | $76.00 — $76.50 | Monday’s open and midpoint of the range; valid re-entry zone if price pulls back overnight |
| Stop | $74.00 | Below Monday’s low; a close under this level resets the bullish structure entirely |
| Target 1 | $78.50 | Retest of Monday’s intraday high; partial profit zone |
| Target 2 | $80.50 | Extension above $80 psychological barrier; R:R approximately 1.8:1 from entry |
Tomorrow’s Setup
Bias: Neutral to cautiously bullish, with wide parameters. The recovery from $74.11 to close near the highs is encouraging, but the size of Monday’s range creates uncertainty about where Tuesday’s anchor is.
- Bull scenario: Asian session holds above $77 and London session takes a run at $79. A clean break of Monday’s high sets up a push towards $80.
- Bear scenario: Overnight consolidation gives way to a re-test of $75 — $74 support. If the $74 low breaks on volume, the Monday range is invalidated and the next meaningful support is around $71.
- Watch for: Any China-related macro commentary on Tuesday. Silver’s industrial component means it is more sensitive to growth expectations than gold.
Experience Guidance
New to silver trading: A $4.50 intraday range tells you this market is not for tight stops right now — size down accordingly or wait for the range to compress.
Developing trader: Silver lagging gold on a safe haven day is a tell — use it as a screening signal rather than a primary trade vehicle when risk-off is the driver.
Experienced trader: The gold-silver ratio compression trade becomes interesting above $80 silver if gold simultaneously presses $4,600 — that is the convergence point to watch for a tactical short on the ratio.
This content is for informational and educational purposes only and does not constitute financial advice. Past performance is not indicative of future results. All trading involves risk. Always conduct your own research before making any investment decisions.
Sunday 17 May 2026
SILVER : Friday 16 May 2026
Ticker Review | Commodities | Alpha Insights
Week at a Glance
No support level identified. Unwind not complete. Avoid entirely.
What Happened
Silver fell 9.13% in a single session. That is not a bad day. That is structural destruction of a crowded position.
Here is the mechanism. The COT data for the week of 12 May showed -21,300 contracts in silver. The largest single positioning shift across the entire commodities complex. That is not a natural reduction. That is leveraged longs hitting margin thresholds and being forcibly liquidated. When margin calls trigger, they create forced selling. That forced selling pushes prices lower. Lower prices trigger more margin calls. The cascade runs until leverage is cleared. Friday’s -9.13% suggests the cascade is still running.
Three forces hit silver at once. The dollar bid (DXY +0.39% to 99.27) crushed all USD-priced commodities. China demand fears hit silver specifically : silver is the most China-sensitive commodity in the complex because China is the largest marginal industrial buyer. AUD and NZD both fell heavily, and those currencies are the cleanest proxies for Chinese manufacturing demand. When AUD drops 0.85% and NZD drops 1.07%, it signals Chinese industrial activity is softening. Silver felt that directly.
The third force was the leverage itself. Gold fell 2.61%. Silver fell 9.13%. That 6.5 percentage point gap between gold and silver is entirely explained by position size. Silver had more leveraged longs per unit of market cap. The dollar hit both metals. Silver broke worse because there was more force to unwind.
What the Alpha Insights Said
Hot Zones : Metals FROZEN
Silver was explicitly placed in the FROZEN category. The framework identified a 13.3 percentage point dispersion between energy (+4.20%) and silver (-9.13%) in a single session. That dispersion has a 68% historical base rate of extending for four or more weeks. This is not a one-session event. The historical analogues from June 2022 and September 2023 show metals staying down for quarters when rate-driven rotation triggers the unwind.
Institutional Flow Read : Liquidation, Not Distribution
The distinction matters. Gold at -14,600 contracts is active institutional distribution. Silver at -21,300 contracts is forced liquidation cascade. Institutions chose to reduce gold. They were forced out of silver by margin mechanics. Forced liquidation takes longer to exhaust than voluntary distribution. Secondary positions that did not get hit on Friday are approaching margin thresholds now. More selling is coming.
Global Grid : Silver Is the Most Severe Dollar Tax Expression
The Global Grid analysis specifically described silver as the most extreme expression of the dollar-strength script in the entire session. USD-priced plus China demand proxy plus crowded leverage. Three compounding headwinds in one instrument. The global grid thesis requires DXY to reverse below 98.80 before any of these headwinds lift. That has not happened.
Sector Flow : Materials FROZEN, Historical Precedent Clear
Sector analysis placed materials in structural break territory. The June 2022 analogue showed energy versus materials dispersion that held six months. The rate-driven loser did not recover until 2024 rate cuts arrived. You are looking at a potential multi-month impairment, not a bounce setup. Do not try to catch this one.
Raw Materials Radar : Unwind Not Complete, Secondary Positions at Risk
The cascade is early-to-mid stage. The largest initial positions were hit on Friday. Secondary positions : those that did not immediately breach margin thresholds : are now closer to the line after Friday’s move. Further mechanical selling is expected. The completion signal is not a price level. It is three specific conditions simultaneously.
Key Levels
| Level | Price | Status |
|---|---|---|
| Overhead Resistance | $79-$80 | Where any dead-cat bounce exhausts. Do not chase it. |
| Friday Close | $77.16 | -9.13%. Structural damage confirmed. |
| Support | None Identified | No level confirmed. Unwind determines floor, not price action. |
| Re-entry Condition 1 | DXY below 98.80 | Dollar must reverse with conviction. Not met. |
| Re-entry Condition 2 | COT cleared | Next Friday’s COT data must show positioning materially reduced. Not met. |
| Re-entry Condition 3 | No new session lows | Confirmed over multiple sessions. Not met. |
Bias: No position. There is no support level you can rely on when a leveraged unwind is mid-cascade. Picking a level is guesswork.
Signal + Bias
Mean-reversion into a leveraged unwind is how capital disappears. There is no edge here until three specific conditions are met simultaneously.
The signal is not short. Not long. Not wait for a level. The signal is zero involvement. Every time silver has bounced during a macro-driven leveraged unwind, the next leg lower has exceeded the bounce. The risk-reward of trying to time the bottom is negative.
You are not missing opportunity by avoiding silver. You are protecting capital for crude, NVDA, and GBP where the edge is clear. This is the discipline that compounds.
Three Conditions for Re-engagement (ALL three required simultaneously)
- DXY closes below 98.80 with conviction (not a tick, a close)
- Next Friday COT data shows silver positioning has materially cleared
- Silver stops making new session lows, confirmed across multiple sessions
All three are required. One or two is not enough. One or two without the third means the unwind is still running.
Next Week Setup
Silver will likely see a dead-cat bounce at some point next week. Every instrument that falls 9% in a day gets a technical bounce. Do not chase it. The COT data is still clearing. The secondary positions that did not hit margin on Friday are closer to the line now.
The two resolution events are China industrial data Monday overnight, and the COT release Friday afternoon. China data matters because silver’s China demand story is structural, not cyclical. If the data shows manufacturing softening, the bid that would normally absorb the forced selling is not there.
Friday’s COT release is the first chance to see whether the -21,300 position has been cleared or is still working through. That data will answer the key question: is this a two-day event or a two-week event?
FOMC minutes on Wednesday are secondary for silver specifically but matter through their impact on DXY. Hawkish minutes extend dollar strength. Dollar strength extends the silver headwind. Dovish surprise starts the recovery process : but even then, wait for all three conditions before entering.
What to Watch (Not What to Trade)
Risk Score
The underlying instrument carries around 75% risk for any directional long attempt right now. Leveraged unwind mid-stage, DXY at 99.27, China demand weakening, COT -21,300 still working through, negative seasonal, no institutional dark pool support, no support level identified. Every factor points the same direction: stay out. The risk is not just losing on a bad trade. The risk is that you lose on a bad trade and miss the setups where the edge actually exists.
The One Rule for Silver
Wait for all three re-engagement conditions simultaneously. Until then, there is no trade here. Deploy your capital where the framework is pointing : crude is MAX, NVDA is STANDARD, GBP is STANDARD. Silver will still be there when the unwind is complete.
Alpha Insights : Friday 16 May 2026. For informational purposes only. Not financial advice. All trading involves risk of loss.
Saturday 16 May 2026
Silver (XAG/USD) — Daily Read | Friday 15 May 2026
Friday close | Silver $76.30 (-10.15%) | Largest single-day loss in the instrument universe | Not financial advice
WHAT CHANGED FROM YESTERDAY
Yesterday silver was at $85.45, already down 3.87% on the session — the channel floor that was the identified support had broken on CPI day, contradicting the 90% long conviction read from Wednesday. The Thursday read acknowledged it directly: a high-conviction read failed when the macro event resolved differently. Today silver moved from $85.45 to $76.30, a further -10.15% collapse. Two consecutive days of severe losses. From Wednesday’s read at $87.26 to Friday’s close at $76.30 is a -12.6% move in 48 hours. This is an inflation-exit liquidation, not a routine pullback. Silver went from the highest conviction long to the biggest loser in two sessions.
HEADLINE STATE: EXTREME SELL — Silver -10.15%, Inflation-Exit Flush, Leveraged Positions Unwound
A -10.15% single-day move in silver is not a normal market day. This is a liquidation event. CPI confirmed lower inflation on Thursday. Lower inflation removes the urgency of inflation hedging. Silver, which carries a larger speculative inflation premium than gold, is the first to get hit. Leveraged long positions in silver that were positioned for persistent inflation are being unwound rapidly. The $76.30 close is significant: silver at this level has surrendered a substantial chunk of the multi-week inflation-trade rally. The Overwatch correctly identified this as the inflation-exit signal.
| Date | Price | Day Move | Read at the Time |
|---|---|---|---|
| Wed 13 May | $87.26 | N/A | 90% long conviction |
| Thu 14 May | $85.45 | -3.87% | Read failed on CPI day — acknowledged |
| Fri 15 May | $76.30 | -10.15% | Inflation-exit liquidation |
| 2-day total | $87.26 to $76.30 | -12.6% | Liquidation confirmed |
KEY LEVELS INTO NEXT WEEK
- $76.30 — Friday close. The starting point for next week’s assessment. After a -10.15% day, the first question is whether the selling is exhausted.
- $80 — round number overhead resistance. Any bounce next week that reaches $80 tests whether buyers have returned or are just short-covering.
- $72-73 — next structural support if the sell-off extends. This level represents a fuller unwinding of the inflation trade.
- Gold/Silver ratio — watch this next week. When silver underperforms gold this severely, the ratio spikes. Normalisation of the ratio would be a silver recovery signal.
OVERWATCH CONTEXT
The Overwatch explicitly named silver as the inflation-exit signal for Friday. When silver drops 10.15% on the back of a lower CPI print, it is not coincidental. The market is removing the inflation premium it embedded in silver during the elevated CPI period. This is a rational repricing, not a panic. The investors who owned silver as an inflation hedge are selling because the reason for the hedge has diminished. That selling pressure, combined with leveraged positions closing, creates the -10.15% in a single session. It is violent but it is explainable. That does not mean the bottom is in. It means the selling had a reason.
WHAT TO WATCH NEXT WEEK
- Is the $76.30 level a flush or a floor? Monday’s Asian session is the first data point.
- Gold direction. If gold recovers, silver follows — typically with higher beta. A 3% gold recovery could mean 5-6% in silver.
- Inflation data next week. Any upside surprise to CPI-adjacent data brings the inflation bid back and silver recovers faster than gold.
- Industrial demand context — silver has industrial use cases that gold does not. Manufacturing data next week feeds silver demand expectations independently of the inflation narrative.
Friday 15 May 2026 | Not financial advice. For informational purposes only.
Friday 15 May 2026
Silver (XAGUSD) — Daily Read | Friday 15 May 2026
Post-CPI close | $83.81 — both pillars removed, speculative flush, where is the floor? | Not financial advice
WHAT CHANGED FROM YESTERDAY
Yesterday the read was an honest account of a called setup being wrong: the 90% long conviction from Wednesday had been directly contradicted by CPI-day selling, with silver at $85.45 (-3.87%) mid-session after the prior close of $87.26. The Overwatch then closed the picture: silver fell 9.26% in two sessions, was the only major diverger in the 8/3/1 global grid, and the Overwatch described it as the week’s honest voice. The Thursday close lands at $83.81 (-5.72% on Thursday alone). This is the full story: two-pillar demand destruction. CPI removed the inflation hedge bid (Pillar 1) and the industrial speculation bid was already fading (Pillar 2). Silver lost both buyers simultaneously in one macro event. The $85.50–$86.00 physical support level identified in Thursday’s read has been breached and closed below. The question is no longer “will it hold the level” — it did not. The question is where industrial demand re-enters as a floor.
HEADLINE STATE: BOTH PILLARS REMOVED — Industrial Demand Is Now the Only Bid Left
Silver at $83.81 is not telling a bearish story about the market. It is telling a precise story about what drove its price: inflation anxiety. That anxiety has been confirmed as unnecessary by CPI. Silver’s -5.72% on Thursday was not a crash — it was a re-rating. The inflation premium that had been embedded in the price has been removed in two sessions. What remains is the industrial demand story. That story is real (solar panels, electronics, industrial manufacturing) but it requires a positive economic outlook to sustain. Retail Sales today is the first data point that either confirms or questions whether industrial demand will return as a second-stage bid. The Overwatch said this explicitly: the unresolved question is whether industrial demand returns at $83–$84, or whether silver continues declining without a new monetary catalyst.
Key Levels
| Level | Price | Significance |
|---|---|---|
| Thursday close | $83.81 | -5.72% — prior $85.50–$86 support broken and closed below |
| Wednesday close | ~$89.00 | Two-session decline: -9.26% total — both pillars removed |
| Industrial demand zone | $81–$83 | Physical demand at this level historically — if it holds, second-stage bid builds |
| Continued selling target | $78–$80 | If industrial demand does not re-enter — next meaningful support zone |
| Recovery target (2nd stage) | $87–$89 | Industrial demand returns — prior support becomes resistance |
| vs Gold | Gold -0.92% | Silver -5.72% | Speculative exit was silver-specific — gold structural buyers held |
Structure · Momentum · Flow
Structure
Broken. The two-session decline has broken the prior rising structure. Silver needs to find a new structural floor — the $81–$83 industrial demand zone is the candidate. A close below $81 removes that floor too.
Momentum
Heavily negative. The selling was aggressive and the basis (futures premium vs spot per Overwatch) was still elevated going into the session, suggesting more futures selling is possible before the basis normalises.
Flow
Inflation hedge bid: gone. Safe-haven bid: gone. Speculative positioning: being unwound. Only industrial demand remains. That bid is slower, less aggressive, and price-sensitive. Do not expect a V-shaped recovery.
THE TWO QUESTIONS SILVER NEEDS ANSWERED
1. Does industrial demand return at $83–$84? Strong Retail Sales today is a positive demand signal for silver’s industrial bid. A resilient US consumer = continued industrial output = silver demand. Watch whether physical silver buying emerges at this level next week.
2. Does the futures basis normalise? The Overwatch noted the futures premium was still elevated versus spot as of Thursday’s close. When that basis narrows, the futures selling pressure eases. Until it does, silver remains vulnerable to further technical selling regardless of physical demand.
| Bias | BEARISH SHORT-TERM — watching $81–$83 for industrial floor |
| Risk estimate | Around 65% downside — both pillars removed, basis elevated, floor unconfirmed |
| Floor watch | $81–$83 industrial demand zone — hold = recovery. Lose = $78 target |
| Lesson | High conviction on a macro event day = catalogue the risk. The 90% call was right on structure; the macro event overrode the structure. |
| Week carry | Unresolved — industrial demand return vs continued sell is next week’s read |
This content is for educational and informational purposes only and does not constitute financial advice. Past analysis does not guarantee future results. Always conduct your own research before making any trading decisions.
Thursday 14 May 2026
Silver (XAGUSD) — Daily Read | Thursday 14 May 2026
Post-CPI mid-session | Speculative flush accelerates | Not financial advice
WHAT CHANGED FROM YESTERDAY
Yesterday silver was the single highest conviction long in the entire instrument universe — 90% long read, channel floor entry, price at $87.26. Today silver is at $85.45 (-3.87%). The 90% long conviction has been directly contradicted by the market’s behaviour on CPI day. The channel floor that was the identified support level has been broken. This is a significant read failure and an important lesson about high-conviction reads on macro event days — the catalyst can override even the strongest technical setup.
HEADLINE STATE: SPECULATIVE FLUSH — Down 3.87%, Prior Long Thesis Broken
Silver is the worst-performing asset in this entire read today. Down 3.87% while gold is down 0.24% tells you the exact nature of the selling: this is speculative money leaving, not strategic selling. Silver trades like gold plus risk. On a day when equities rally and inflation falls, the inflation-hedge premium in silver collapses. The “good CPI” trade removes two of silver’s tailwinds simultaneously: the inflation hedge premium and the safe-haven premium. What is left is the industrial demand story — and that is not enough to hold price on a day like today.
Key Levels
| Level | Price | Significance |
|---|---|---|
| Current price | $85.45 | -3.87% — worst performer in the read today |
| Prior close | $87.26 | Prior read: 90% long, channel floor entry — broken |
| Channel floor (prior) | Broken | Prior support level — CPI selling pushed through it |
| Gold comparison | Gold -0.24% | Silver losing 16x more than gold = speculative exodus |
| Next support area | ~$83-84 | Next structural zone to watch if selling continues |
Structure · Momentum · Flow
Structure
The channel floor that was the basis for the 90% long read has been broken. Structure is now negative. The prior long thesis required holding the channel floor — it has not held. A new structural level needs to form before the long thesis can be re-assessed.
Momentum
Momentum is sharply negative. A 3.87% intraday move on silver is significant. That is not a small correction — that is forced selling or speculative exits at scale. Momentum will not flip positive quickly from a move like this.
Flow
Speculative exits. The gold/silver ratio widening aggressively today confirms this is retail and speculative money leaving silver, while institutional money stays in gold. The flow is outward from silver specifically.
TODAY’S BIAS: STEP ASIDE — Prior Long Thesis Invalidated, No New Setup Yet
The 90% long read from yesterday has been invalidated by today’s price action. This is an honest read: the channel floor did not hold. Anyone who was long silver from the channel floor entry either stopped out or is sitting on a significant loss. The right call now is to step aside and let silver find a new structural level. Do not average into a broken setup. Wait for the selling to exhaust and a new support level to form before re-assessing.
Risk: Around 70%
Highest risk score in today’s read. The prior long thesis has been structurally broken. There is no clear floor yet. Trying to catch a falling knife in a speculative asset on a macro event day is the highest risk trade available. Stay flat until structure reforms.
By Experience Level
New to this
This is one of the most important lessons in trading: even a 90% conviction read can be wrong when a macro catalyst overrides the technical picture. The right response is not to blame the analysis — it is to respect the stop and not argue with the market. When price says you are wrong, you are wrong. Full stop.
Developing
Silver’s 3.87% drop vs gold’s 0.24% drop is a masterclass in how different silver and gold are as assets despite being called “precious metals.” Silver has a much larger speculative component than gold. When speculators exit together, silver drops fast. That volatility is what makes silver both an opportunity and a danger.
Experienced
The speculative flush continuing from yesterday’s context is the relevant question. If this is a one-day forced liquidation, silver bounces hard when the selling exhausts — often +3-5% the day after a flush. Watch whether $83-84 holds as a new floor. If it does with volume drying up, the contrarian long thesis begins to rebuild from a lower level with a defined risk.
This is a daily analysis read for educational and informational purposes only. Nothing here is financial advice. Past performance is not a guide to future results. Trading carries significant risk of loss. Always apply your own risk management.
Wednesday 13 May 2026
Silver (XAGUSD) — Daily Framework Read | Wednesday 13 May 2026
analysis as of pre-market | CPI 3.8% shock context | Not financial advice
HEADLINE STATE: HIGH CONVICTION LONG — 90% Read, Channel Floor Entry
Silver is the strongest conviction long across the entire instrument universe today. 90% long read with a channel floor entry means the framework is giving you a well-defined, high-probability setup with natural risk management. Price closed at $87.26 — up 2.5% — after bouncing from the channel floor. The channel floor is where you want to buy: defined support, defined stop, direction confirmed. This is the cleanest setup of the day.
Key Levels
| Level | Price | Significance |
|---|---|---|
| Current close | $87.26 | Up 2.5% — strongest metals performer today |
| Session high | $88.58 | Intraday resistance — break targets higher |
| Session low / channel floor | $86.66 | Entry zone — stop goes below this |
| Prior close | $85.13 | Support reference — should hold on any pullback |
| Long bias read | 90% | Highest conviction in today’s universe |
| Copper confirmation | +2.34% | Industrial metals rally — silver supported |
Structure · Momentum · Flow
Structure
Channel floor entry is a textbook structure trade. Price found support exactly where the framework projected. A bounce from a defined floor with 90% long conviction behind it is the highest-quality structural setup available. The channel defines your stop and your target simultaneously.
Momentum
2.5% gain on the session confirms momentum is with the longs. Silver moved significantly while Gold gained only 0.69% — silver is the more aggressive expression of the metals trade today. The momentum is outperforming its peers, which typically sustains.
Flow
Metals broadly bid: silver +2.5%, copper +2.34%, gold +0.69%. That is an industrial and precious metals rally happening simultaneously — driven by CPI inflation data (hedge demand) and risk-on flows (growth optimism). Silver sits at the intersection of both — both an inflation hedge and an industrial metal. Best of both worlds today.
Long Case vs Short Case
LONG CASE (primary)
- 90% conviction — highest read today
- Channel floor entry — textbook structure with defined risk
- Already moved 2.5% — momentum confirmed
- Copper leading — industrial demand narrative intact
- CPI 3.8% = inflation hedge premium active
SHORT CASE (weak)
- 10% short bias — minimal, not the read today
- Already moved 2.5% — chasing after a strong move carries risk
- If gold fails to confirm, silver loses its leading peer
- A pullback to $86.66 before the next leg is possible
- Shorts have no framework support at 10% bias
Sizing Guidance
This is the setup of the day. Full position size is warranted for a pullback entry to the $86.66 channel floor. Stop sits below that level — well-defined risk. If price pulls back to the floor during the session, that is the entry. If it does not pull back and continues higher, the trade is still valid on a break of $88.58 with a wider stop.
Silver is the highest-conviction instrument today. Size reflects that conviction — but only on a clean entry, not by chasing the move after a 2.5% day.
Tuesday 12 May 2026
Daily Framework Read · Tuesday 12 May 2026
Silver (XAGUSD) — Daily Framework Read | Tuesday 12 May 2026
Published pre-market · Time-gated member content
Current State
LONG — 80% Confidence
Directional bias: 90% long. Channel floor with bigger-picture confirmation. High-conviction setup — let it breathe.
Key Levels
| Level | Price | Notes |
|---|---|---|
| Entry | 74.08 | Channel floor trigger |
| Stop Loss | 73.74 | Below channel floor |
| Target 1 | 74.71 | Channel midpoint resistance |
| Risk:Reward | 1.87R | Near 2R — solid setup |
Structure Read
Silver is sitting at a defined channel floor — a level where buyers have historically stepped in to defend price. The bigger-picture structural read confirms the bullish case: the larger trend is supportive and this pullback to the floor is the kind of location where the trend resumes rather than breaks. That macro confirmation is what elevates this from an ordinary level play to a high-conviction setup.
Momentum Read
Momentum is aligning with the long case at the channel floor. The pullback that brought price to this level has been orderly — not a sharp sell-off signalling a breakdown, but a controlled retracement into structure. That orderly behaviour at a key level is exactly the environment where momentum starts to rebuild and the next leg of the move begins.
Volume & Flow Read
Flow at the channel floor is bullish — the 90% long bias reflects genuine buyer interest at this level. Buyers are stepping in rather than stepping aside, which is the confirmation you want to see when price reaches a structural location. The flow here supports not just the entry but the decision to hold the trade and give it room to breathe toward T1.
The Verdict
Silver is the highest-quality trend-aligned setup on the board today. Channel floor, macro confirmation, strong buyer flow, orderly momentum — everything a good long setup needs. At 80% confidence with a 90% directional bias, this is the kind of trade you put on and leave alone. The natural instinct to fiddle with the stop or exit early is the enemy here. Set the levels, trust the structure, let the trade breathe to T1 at 74.71.
Long Case vs Short Case
90%
Channel floor. Macro structure confirming. Strong buyer flow. Orderly pullback.
10%
Channel floor breaks — invalidates the structural setup entirely.
Position Sizing Guidance
At 80% confidence with macro confirmation, this justifies standard full risk — 1% to 1.25% of account. Entry at 74.08, stop at 73.74 (0.34 points), T1 at 74.71 (0.63 points gain). The tight stop from a clear floor means position size can be generous while keeping dollar risk fixed. Resist the urge to exit early — the 1.87R doesn’t work if you close at 0.5R because of a shaky candle.
This content is for educational and informational purposes only. Nothing here constitutes financial advice or a recommendation to buy or sell any instrument. Trading involves substantial risk of loss. Past performance is not indicative of future results. Always conduct your own due diligence and manage risk appropriately.
Tuesday 5 May 2026
Silver (XAG/USD) — Daily Framework Read | Tuesday 5 May 2026
Silver opens the London session at $73.07, hugging the lower edge of last week’s range and offering nothing decisive in either direction. Gold sits flat at $4,527, the dollar bid is firm, and VIX has perked back up above 18 with the term structure no longer in deep contango. None of that is a green light to chase silver lower, and none of it is an excuse to buy weakness either. The analysis reads WATCHING with a soft downside lean, and that is the honest call.
Yesterday Versus Today
| Metric | Saturday 3 May | Tuesday 5 May | Read |
|---|---|---|---|
| Spot | ~$73.40 | $73.07 | Drift lower, no impulse |
| Bias | WATCHING | WATCHING | No regime change |
| Conviction | Low | Low to medium (down) | Slight downside tilt |
| Structure | Distribution into reaction | Lower-range compression | Range tightening |
| Volume profile | Sellers in control on rallies | Thinner participation | Buyers absent, not desperate |
Structure Read
Silver is still working off the late-April rejection. The framework printed a sequence of lens-broken-down events and a clean filament-retracement reversal across the 76 to 78 zone, and price has not been able to repair any of that. What we have now is a market that traded down, paused, tried to base, and then drifted lower again into Tuesday’s open. The action is corrective rather than impulsive, but every relief bid since Thursday has been faded.
The structural floor that matters is the $72.00 to $72.50 shelf. That is where the framework caught the last credible defensive bid and where line-cross signals fired in favour of buyers. Below it sits an air pocket toward $70 to $71 where price moves quickly because there is no recent volume to slow it down. Above the tape, the first wall is $74.50, and only a clean reclaim of $75.50 with momentum behind it puts the bullish thesis back on the table.
Momentum And Flow
Momentum is the cleanest tell on silver right now, and it is not flattering. Every bounce has come on lighter volume than the rejection that preceded it. That is the signature of a market where sellers are passive but persistent. They are not panicking, they are simply willing to keep capping rallies until something fundamental shifts. The framework’s flow read has not picked up any institutional accumulation in the last three sessions, and the gold/silver ratio is grinding higher, which historically signals the safer metal is preferred while risk appetite stays mixed.
Realised volatility is higher than the calm late-April baseline but not yet at the level that triggers reflexive mean-reversion buying. That is the awkward middle. Too much chop to trend, too little fear to fade.
Key Levels
| Level | Price | Why It Matters |
|---|---|---|
| Reaction high | $77.50 | Where the rejection began. Bulls need this back to claim trend. |
| Reclaim trigger | $75.50 | First evidence the corrective move is done. |
| Overhead supply | $74.50 | First wall on any bounce. Sellers active here all week. |
| Spot | $73.07 | Lower-range, no edge. |
| Defensive shelf | $72.00 to $72.50 | Where the framework expects buyers to step in first. |
| Air pocket | $70.00 to $71.00 | Loss of $72 opens a quick move into thin volume. |
The Call
Plan B: If $72 cracks on volume, do not pre-empt the bounce. Wait for $70.50 to $71.00 and let the air pocket flush. That is where the framework expects exhaustion buyers, not before.
Plan C (counter-trend short): Only on a failed retest of $74.50 with rejection. Stop above $75.20, target back to $72.50. Tight, fast, and only if the tape gives it.
No edge zone: $73 to $74. Stand aside. This is where the chop lives.
What We Called Yesterday
The previous read flagged silver as WATCHING with a downside lean while sellers stayed in control of rallies. Price drifted from roughly $73.40 toward $73.07. That is consistent with the call: no impulsive break, but no recovery either. The framework’s read held up. The lesson is the boring one. When the structure is corrective and conviction is low, patience pays. Forced trades in the $73 to $74 zone last week all ended in chop.
Risk Assessment
Risk score: around 55%. Drivers: realised volatility is elevated but not extreme, the dollar is bid which caps any reflexive metals rally, the gold/silver ratio is grinding against silver, and there is a known air pocket below $72 that punishes anyone long without a defined stop. The factor that could change the read fast is a soft US data print this week that knocks the dollar back and lets gold and silver decompress together. Watch the macro calendar before sizing.
Cross-Reference
Pair this read with today’s Raw Materials Radar for the full commodity-complex context, and with the Macro Pulse for the dollar and rates backdrop that drives the metals tape. Gold’s flat finish around $4,527 is the corroborating signal here. Both metals are coiling rather than trending.
This is educational analysis, not financial advice. Trade your own plan and respect your own stops. Markets do what they do regardless of what any framework says.
Continue with Titan Protect
Twenty-plus instruments. One framework.
We read more than twenty instruments daily across four sessions. The framework’s sunrise call landed across the day — the Pre-NY case study shows what the lines drew, what New York did, and where the read stands.
Core
£59/mo
Indicator suite plus daily framework reads.
Edge Popular
£109/mo
Core plus Shield dashboard and member-only briefs.
Elite
£179/mo
Edge plus weekly 1:1 call and early access to new tools.
Save 15% on annual billing
Want to see the framework in action? Free Explorer tier — no card required.
Join the live community: Discord channel · Shield dashboard
Education, not financial advice. Trade your own analysis.
Sunday 3 May 2026
Silver (XAG/USD) — Daily Framework Read | Sunday 3 May 2026
Silver (XAG/USD) | Monday Open Framework Read | Data basis: Friday 1 May 2026 close
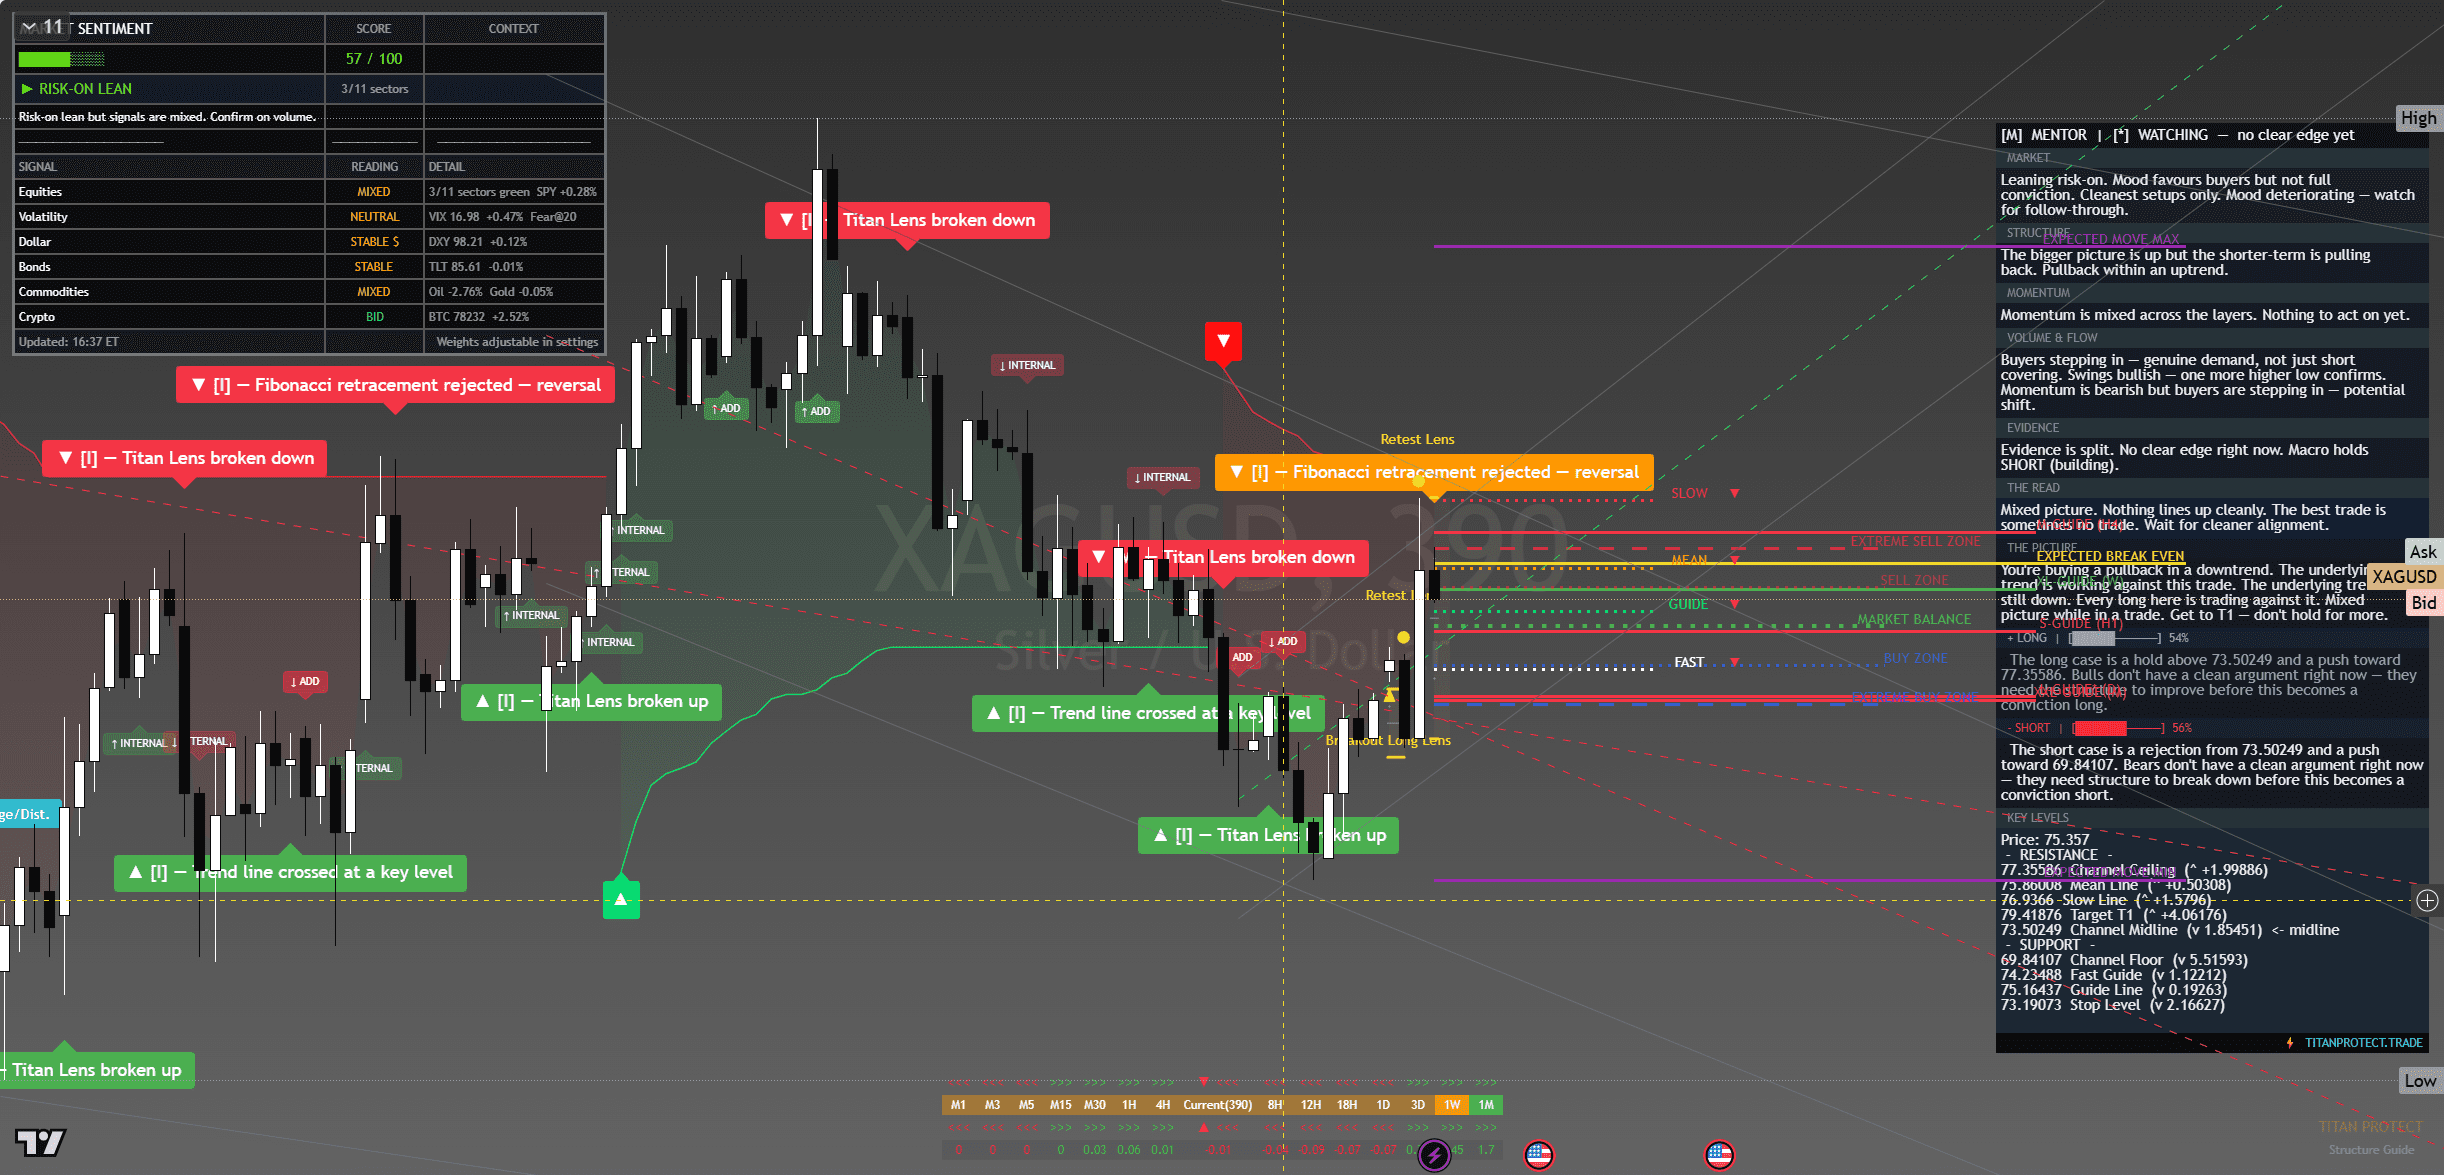
Silver (XAG/USD) — chart with framework overlay. The Lens annotations show structural breaks, reversal triggers and confluence zones at the levels referenced below.
Where It Sits
Structure
Structurally silver is in a clear uptrend with higher highs and higher lows on daily and 4-hour timeframes. Friday’s close sits comfortably above the rising 20-day MA. The structure is constructive.
Momentum
Momentum is firm with the daily timeframe accelerating. Internal momentum readings sit in the upper half of range — supportive of continuation.
Volume & Flow
Silver futures flow has been steady on the recent advance with ETF flows supportive. Industrial demand commentary from solar and electric vehicle sectors remains constructive.
Key Levels
| Level | Type | Significance | Action Zone |
|---|---|---|---|
| 58.00 | Resistance | Round number, swing high zone | Take profits if reached |
| 57.20 | Pivot | Recent rejection cluster | Hold above = bullish bias |
| 56.40 | Friday close | Reference anchor | Bias line for Monday open |
| 55.40 | Support | Recent breakout retest | Buy zone with defined stop |
| 54.20 | Major support | Prior congestion floor | Stop-out below for longs |
Three Scenarios Into Monday Open
Continuation
Silver opens firm, holds 56.40, takes 57.20 cleanly on industrial demand bid and gold strength. Runs to 58.00 by NY. Constructive close above 57.50.
Range
Silver opens flat, churns 55.80-57.00 through the session. Magnet to Friday close. Range trade tracking gold.
Mean Reversion
Silver opens weak on USD strength or industrial demand softening, fades to 55.40 support. Mean-reversion within the trend.
Risk Score
Risk sits at Around 60% heading into Monday open.
Risk is elevated for silver because the metal carries dual exposure — precious-metal bid from gold’s strength plus industrial-demand bid that is sensitive to growth shifts. Volatility is higher than gold’s. The constraint is that silver moves bigger and faster than gold in both directions. Smaller position sizes than gold equivalents, defined stops mandatory.
How to Walk It
Entry / Stop / Target structure:
- Long 55.60-55.90 pullback | Stop 55.20 | Target 57.00 | R:R 2.5:1
- Long 57.25 breakout | Stop 56.70 | Target 58.00 | R:R 1.4:1
- Short 58.10+ rejection | Stop 58.50 | Target 56.40 | R:R 4:1
Experience-level guidance:
Beginner: The Monday open after a Friday record close is exactly the situation where over-confidence costs money. Reduce size to half your standard. Trade only the cleanest setup from the entries above. If the tape opens against your bias, do nothing — wait for the second hour, when the institutional flow has tipped its hand.
Intermediate: Use the levels table to define the trading range. Fade the extremes with defined stops, take profits before the round-number resistance levels. Do not carry directional positions through the day if you cannot watch the tape — Monday opens are prone to fast reversals.
Advanced: The vol regime is supportive of trending moves. Defined-risk options structures around the key pivot levels capture the asymmetry cleanly. Keep notional small relative to your book — Monday after a record-close week is asymmetric speculation, not core positioning.
The Sunday Composite — How This Read Sits Inside The Cross-Asset View
This single-instrument framework read is one slice of the larger Sunday weekend synthesis. The composite takes positioning, macro, sentiment, volatility, sector dispersion and trade structure as separate analytical layers and arrives at a unified composite verdict for Monday open. Each layer below is unpacked in full.
Read the full composite for the cross-asset context driving this instrument:
The institutional positioning split — Asset Managers vs Leveraged Funds in size
PCE clearance and the macro case for Monday’s carry
The three-layer sentiment disagreement — surface greed, retail neutral, professionals hedged
The vol curve term structure and what VVIX is signalling
Sector dispersion and the breadth problem behind the record close
The Monday position-management playbook — sizing tiers and trade plans
Sunday Overwatch — the unified composite verdict
Continue Reading
The macro frame driving this read is unpacked in the weekend briefs:
Sunday Setup — Reading The Tape Into Monday Open
PCE Cleared, VIX Crushed, SPY Closed 720 — Friday Post-Close Recap
This analysis is for educational and informational purposes only. It does not constitute financial advice. Always manage your risk independently and in accordance with your own financial circumstances.


