
The Silver Framework Journal for April 2026, newest read at the top. Each dated entry is our read on the close, kept as a living record so the framework can be judged over time. This is analysis, not financial advice.
Thursday 30 Apr 2026
Silver Held 71 When Gold Broke, Then Added 3.5 Percent Thursday to 74.09 — The Relative Outperformance Has a Message
Silver (XAG/USD) | Daily Framework Read | Thursday 30 April 2026
Wednesday’s commodity session sorted the precious metals into two buckets. Gold lost its structural floor at 4,615, closing at 4,536 on the dollar repricing and the Powell hawkish-symmetric hold. Silver held the 71 handle, closed at 71.40, and outperformed gold on a relative basis for the first time in four sessions. That divergence was the tell. When silver holds while gold breaks, it is typically the industrial demand floor beneath silver that is absorbing the pressure the purely monetary asset cannot. Thursday confirmed the signal: silver added 3.52 percent to 74.09 as gold recovered, with silver’s percentage gain exceeding gold’s intraday and the gold-silver ratio compressing from 63.5 toward approximately 62.7. Silver is now positioned as the higher-beta recovery trade if gold confirms its floor repair through PCE Friday.
Thursday thesis. Silver’s relative strength through Wednesday’s gold breakdown is the key structural signal. The gold-silver ratio compressing on the recovery says silver is leading, not following. A cool PCE tomorrow could push silver toward 77 and put the all-time high of 78.30 (from two weeks ago) back in view. The risk is that the industrial demand floor is less reliable than gold’s central bank bid if sentiment turns sharply negative on a hot PCE print. Silver falls harder than gold in risk-off scenarios because the industrial demand floor has elasticity that the central bank floor does not.
Where It Sits Today
Current Price
74.09
+3.52% on session
Session Range
71.65 – 74.26
2.61-dollar intraday swing
Prior Close
71.57
Wed cash: 71.40
Gold-Silver Ratio
~62.7
Compressing from 63.5 Wed
Silver’s 5-day context runs from a close in the 70-dollar area at the start of the week, through the 71.40 hold on Wednesday’s dollar-driven shock, to the 74.09 print Thursday. The percentage gain on Thursday — 3.52 percent — exceeded gold’s 2.31 percent recovery by more than one percentage point. In relative terms, silver is the leading precious metal today and that matters because silver outperformance ahead of a structural catalyst (PCE Friday) is a constructive signal, not just a catch-up trade.
The gold-silver ratio tells the fuller story. At 63.5 on Wednesday, silver was relatively cheap versus gold — the ratio was above the 60-62 zone that has marked equilibrium during the current bull run. A ratio compression toward 62.7 Thursday says the market is correcting that misalignment, which is silver’s normal behaviour when the precious complex recovers. If the ratio compresses further to 60–61 on a sustained PCE cool, silver has a larger percentage upside than gold from here. That is the relative value case.
The industrial demand context: copper (HG) added 1.87 percent Thursday to 5.99, which is constructive for silver’s industrial half. When the base metals complex bids alongside a dollar fade, silver gets both the monetary and industrial tailwind simultaneously. This is the silver sweet-spot setup: dollar down, gold up, copper up. All three conditions are present Thursday.
What the Framework Reads
The structural read on silver is bullish with a higher volatility profile than gold. Silver’s trend centre has been pulling price toward the channel ceiling since the base was built in the 63–65 dollar range in Q1 2026. The current price at 74.09 is inside the upper portion of the established channel, not above it. The all-time intraday high at 78.30 represents the channel ceiling, and silver has room to the ceiling if the macro conditions hold.
Wednesday’s outperformance tells a structural story. When the precious complex sells off on a monetary shock (hawkish Fed, dollar repricing), gold underperforms because it is the primary monetary metal and gets sold first by the macro funds adjusting their currency hedge book. Silver is partly spared because the industrial buyers, who have different time horizons and different reasons for holding, do not sell at the same time. The result is that silver’s floor is structurally higher relative to gold in a Fed-driven dip. This is what the framework picked up Wednesday and it is why silver’s relative hold was worth noting in the Raw Materials Radar.
The PCE angle matters specifically for silver. If PCE tomorrow prints cool, the narrative is: inflation is coming down, the Fed can eventually cut, real rates will fall, and monetary metals rally. That is gold’s story. But it is also silver’s story with a multiplier — because a rate-cut cycle that is back on the table also improves the manufacturing and solar panel demand outlook, which is the industrial demand floor’s macro driver. Silver wins the PCE cool scenario on both its monetary and industrial legs simultaneously. That double-trigger potential is why the risk-reward on silver can exceed gold’s on a favourable print.
Structural read: constructive, higher beta than gold
Silver sits at 74.09 with the ratio compressing and the industrial complex supporting. The framework reads the current position as inside the channel, trend constructive, and biased higher if PCE cooperates. The higher beta means the upside in the bull scenario is larger, but the downside in the correction scenario is also larger. Size accordingly.
Key Levels
| Level | Price | Role | Meaning |
|---|---|---|---|
| All-time intraday high | 78.30 | Channel ceiling / resistance | Printed two weeks ago. A close above here puts silver in uncharted territory. |
| Bull continuation target | 77.00 | PCE cool target | Measured move if 74.26 session high is confirmed and PCE prints cool. Trim zone for swing longs. |
| Session high / current level | 74.09 / 74.26 | Decision level | A close above 74.26 confirms the Thursday recovery and sets up a move toward 77. |
| Structural floor — held | 71.00 | Support | The round-number and structural level that held on Wednesday’s gold breakdown. Must hold or the relative strength thesis breaks. |
| Bear target 1 | 68.50 | Correction floor | If PCE hot breaks 71, 68.50 is the Q1 structural base. This requires a genuine risk-off flush, not just a data miss. |
Three Scenarios into PCE Friday
Bull — 38%
PCE cool, DXY fades below 98.00, copper holds 5.90. Silver leads gold on the recovery, moves to 77 Friday, targets 78.30 inside a week. Gold-silver ratio drops to 60–61.
Sideways — 35%
PCE in-line. Silver consolidates 72–75, digests Thursday’s gains. Gold-silver ratio holds 62–63 range. Industrial demand holds the floor, monetary demand is cautious.
Correction — 27%
PCE hot. Dollar bids hard. Silver falls more than gold in percentage terms — the industrial demand floor is not as strong as the central bank bid. 71 tests quickly, 68.50 becomes a realistic target.
Risk Score
Risk: around 60%
Silver’s higher beta adds five percentage points to the risk score versus gold. The structural case is sound, the relative strength is real, and the gold-silver ratio compression is constructive. The 60% risk score comes from three places: silver’s industrial component means it can fall harder than gold on a hot PCE, the 3.52 percent intraday move has already captured most of the technical recovery, and entering at 74 with a PCE binary in 18 hours means the stop placement requires a wider buffer to avoid being clipped by the data noise. Know your maximum daily loss before you size this position.
How to Walk It
STANDARD SIZE — Post PCE
Wait for PCE. If cool: enter on pullback to 73.50–74.00
Stop: below 71.50
Target 1: 77.00
Target 2: 78.30
R:R approx 4:1
REDUCED SIZE — Today’s close
If already positioned, hold with a stop below 71.00 overnight. The relative strength thesis is intact while silver holds above 71. Do not add into the PCE binary.
AVOID — Chasing 74
Do not buy silver at the session high with PCE 18 hours away. The asymmetry does not work. A hot print can take silver back to 71 before you can exit. Wait for the data.
For scalpers: The intraday range 72.50–74.26 is the band to work. Short rejections of 74.26 with 10-cent stops. Long pullbacks to 72.80–73.00 if volume confirms. Silver moves quickly — do not hold scalps through news events or AAPL’s print tonight.
For swing traders: The relative outperformance thesis is the edge. Silver led the recovery Thursday. If it continues to lead gold on the upside after PCE, the gold-silver ratio trade (long silver, short gold) is the cleanest expression of the thesis with defined risk parameters.
Beginners: Silver is more volatile than gold and has a lower institutional demand floor. If you are new to precious metals, start with gold’s more defined structural levels before taking on silver’s higher-beta moves. Read the gold ticker read alongside this one for the context that governs both instruments.
Continue Reading
Wednesday’s full precious and energy commodity picture — including the gold-silver ratio analysis at 63.53 and what the split between energy and precious told us — is in our Raw Materials Radar brief Wednesday 29 April 2026.
The Fed’s policy stance and the real-rate environment that governs both gold and silver is covered in our Macro Pulse brief Wednesday 29 April 2026.
Today’s full session context, including the gold call confirmation and the commodity hedge book narrative, is in our Pre-NY Brief Thursday 30 April 2026.
This analysis is for educational purposes only and does not constitute financial advice. Markets involve risk and capital can be lost. Always manage your risk appropriately.
Sunday 26 Apr 2026
Silver At Seventy-Five Sixty-Nine. Cleaner Long Than Gold, And The Ratio Knows It.
Daily Ticker Read | Silver (XAGUSD) | Sunday 26 April 2026
Silver is doing the unglamorous work this weekend. Gold gets the headlines. The gold-to-silver ratio at 62.22 sits in a tight band that says capital is buying protection without panicking on the cycle. Silver carries the same defensive bid as gold, with industrial demand still intact and spec positioning that has not yet hit the late-cycle wall gold is already standing against. Raw Materials Radar already flagged the long. This read sets the levels.
Friday’s Print
| Metric | Reading | Read |
|---|---|---|
| Silver spot (XAGUSD) | $75.6945 | Holding the seventy-five handle into Sunday close |
| Gold spot (XAUUSD) | $4,709.75 | Sustained defensive bid, dollar resistance ignored |
| Gold-silver ratio | 62.22 | Tight band, no panic distortion |
| DXY | 98.51 | Refusing to break out, ceiling capping moves both ways |
| Copper | $5.99 / lb | Cycle indicator holding the six-dollar handle |
| VIX | 18.71 | Elevated against a greed reading, room for a metals bid into uncertainty |
Range Location
The framework read off the daily chart shows silver pulled back from a recent run-high and tested a structural support zone earlier in the session before reclaiming. Several signatures are stacked on the print. A trendline rebreak to the upside off the lows. A retracement that the Fibonacci grid rejected, which the framework flagged as a reversal candle. Above that, the higher band of the structural envelope was tested and lost on a prior leg, which then formed the base of the current bid.
Range location: silver sits in the upper third of its three-week range but inside the ten-day mid-band. Not extended at the top of the recent leg, not breaking down through support. The position is constructive without being stretched. That is the precise condition where a defensive bid finds size before momentum followers arrive.
Structural Read
The structural picture has three things working in the same direction. Sentiment on the framework reads short with a partial-exit warning at the panel level, which is contrarian information when the price is already holding above a tested support. Multi-market context is mixed but tilted bullish on the metals block. Volatility is elevated enough to support a defensive bid but not so extreme that the spread destroys risk-reward.
The 390-minute timeframe shows the trendline broken back to the upside after a clean retest. The four-hour structure carries higher lows since the prior week’s low and a cluster of unfilled gaps just above the current price that act as magnets if the bid extends. The daily structure is the only frame still in question. Above $77.20 the daily flips constructive across all three timeframes and the trade ages into a multi-week swing rather than a tactical bounce.
Gold-Silver Ratio Context
The ratio at 62.22 is the entire dual-nature story in one number. Below 60, silver is leading on reflation and industrial demand. Between 60 and 70, the metals block is balanced, with both metals bid for safety and silver still benefiting from cycle exposure. Above 75, capital has chosen pure fear and silver lags badly because the industrial leg gets repriced lower.
62.22 inside this regime says capital wants protection without abandoning the cycle. That is the cleanest setup for silver. Gold drags the ratio higher and silver gets pulled along with it. Copper holding the six-dollar handle confirms the cycle leg is intact. The dollar refusing to break out removes the headwind that would otherwise compress both metals. Three independent reads pointing the same way.
Three Key Levels
| Level | Price | Why it matters |
|---|---|---|
| Resistance | $77.20 | Prior swing high and the daily-structure flip line. A clean break opens the higher band of the recent range and turns the trade into a swing. |
| Pivot | $75.20 | The reclaim point off the trendline retest. Above this, the bid stays in control. Below it on a daily close, the structure resets to the next demand band. |
| Support | $73.40 | Tested twice on the four-hour, prior consolidation floor. A loss here removes the long bias outright and flips the trade to range-bound. |
Two Trade Ideas
Trade One. Long silver on the reclaim, swing horizon
Risk score: around 55%
Entry: $75.20 to $75.80 zone. Pulse buys on a clean four-hour close back through $75.40 with the dollar still capped under 99.20.
Stop: $73.40, below the tested four-hour floor.
Target one: $79.50, the resistance shelf above the prior swing.
Target two: $82.00, the higher band of the multi-week range.
Risk-reward at T1: roughly 1.9 to 1. At T2: roughly 3.2 to 1.
Kill conditions: Hormuz reopens with a confirmed US-Iran communication that simultaneously removes the geopolitical premium and lifts the dollar through 99.20. Either signal alone trims size by half. Both signals together cancel the trade.
Trade Two. Long silver against short gold, ratio compression pair
Risk score: around 50%
Entry: long silver $75.20 to $75.80, short gold $4,710 to $4,725 area, sized to dollar-neutral. The pair pays on ratio compression toward 60 while both legs stay constructive.
Stop: ratio close above 64.00 on the daily.
Target one: ratio at 60.50.
Target two: ratio at 58.00 if the cycle leg accelerates.
Risk-reward at T1: roughly 1.4 to 1. At T2: roughly 2.6 to 1.
Kill conditions: Gold spec long unwinds violently and drags silver down faster than gold falls, pushing the ratio above 64. A confirmed risk-off panic that takes copper through the five-dollar handle also cancels the pair, since pure fear regimes blow the ratio out toward 75 plus.
Time Horizons
| Horizon | View | Action |
|---|---|---|
| Intraday (Asia and London) | Range | Trade between $75.00 and $76.50 with tight stops. No break expected before the New York handover. |
| Swing (1 to 5 days) | Constructive long | Trade One sized to survive Powell volatility on Wednesday. Carry through the Fed press only with a partial trim before the print. |
| Positional (1 to 4 weeks) | Constructive | Above $77.20 on the daily, scale into the higher band of the range with stops trailed under $74.00. |
| Long term (3 to 12 months) | Mixed | Bull thesis depends on whether the industrial leg holds through any growth slowdown. Re-evaluate at each ratio extreme. |
Risk Score: around 55%
Three concurrent macro events on the same five-day calendar, with metals positioned to pay on most of them but with the dollar refusing to commit either way. The dual-nature exposure cuts both ways. If the geopolitical bid fades and the cycle holds, silver outperforms gold. If pure fear takes over and copper breaks down, silver underperforms gold. The ratio is the live tell either way. Reduced size, defined stops, kill conditions written before entry.
Catalyst Stack
- Gold relative. Silver tracks gold tick for tick on safe-haven flow. Watch the ratio at 62 to 63 as the live trigger. A move toward 60 is silver outperforming, and is the cleanest signal that the long is working. A move toward 65 plus is gold pulling away and silver lagging, which trims the long.
- Industrial demand. Copper is the proxy. Holding above $5.95 keeps the cycle leg under silver. A break of $5.85 forces a re-evaluation of the dual-nature thesis. Watch the Southern Copper print on Tuesday for the institutional read on the cycle.
- DXY. 98.51 is the line in the sand. Above 99.20 the dollar headwind starts compressing both metals and silver loses faster than gold because of the cycle leg. Below 97.80 the dollar tailwind extends both legs and the ratio compresses toward 60.
- Powell Wednesday. A dovish lean lifts both metals together and compresses the ratio. A hawkish lean pulls gold higher on the policy-uncertainty leg while silver lags on the rate-sensitive cycle exposure. Position size before the print should reflect which way you want to be wrong.
- Hormuz tape. Escalation extends the safe-haven bid in both metals and the ratio holds where it is. A clean reopening removes the geopolitical premium from gold faster than from silver, which compresses the ratio short term but trims the absolute bid.
Cross-Reference
Raw Materials Radar published earlier today flagged silver as the cleanest metal long for the week, citing spec positioning that has not yet reached the late-cycle wall gold is standing against, and the gold-to-silver ratio at 62.22 sitting in a tight band. This ticker read isolates the levels and the kill conditions. Macro Pulse framed the three-body problem of Powell, Mag 7 prints and the Hormuz blockade. Positioning Pressure documented the institutional accumulate-and-hedge signature in equities that mirrors the same conviction-with-insurance pattern visible in the metals block.
Silver is the trade where all three briefs point in the same direction without a contradiction.
What We Called vs What Happened
| Call (22 Apr) | Outcome (by 26 Apr) | Verdict |
|---|---|---|
| Long bias on the dual-demand thesis, target $80 then $82. | Spot drifted from $77.66 to $75.69 over the four sessions. Neither target tagged. Direction wrong on the leg. | Missed |
| Outperforms gold, the catch-up move is starting. | Silver fell roughly 2.5 percent while gold fell roughly 1 percent. The ratio widened rather than compressed. | Reversed |
| Use the $75.50 to $76.50 pullback band for entries. | Friday close at $75.69 sits inside the zone after the pullback played out cleanly. | Confirmed |
| Structural support at $73.80 holds. | Lows over the four sessions never broke into the $73 handle. | Confirmed |
| Stop below $72.00 invalidates the trend. | Never threatened. Stop sat untouched. | Confirmed |
Track record: three of five calls confirmed over the four-session window, with the upside thesis missed and the catch-up call reversed because gold outperformed silver across the run.
This is analysis, not financial advice. Always manage your risk.
Thursday 23 Apr 2026
Daily Framework Read | Thursday 23 April 2026 | Published 22:00 London / 17:00 New York / 07:00 Tokyo
GBPUSD
1.3466 -0.32%
Cable slipped as the dollar recovered. GBP/USD dipped below 1.35 on the session as risk-off sentiment boosted dollar demand. Sterling remains in a broader uptrend but today’s move suggests the pair is taking a breather after recent gains. UK economic data was light, leaving the pair driven by dollar dynamics.
Framework Read
| Layer | Reading | Interpretation |
|---|---|---|
| Direction | LONG (medium-term) | Uptrend intact above 1.3400 |
| Structure | Correcting | Pullback from recent highs. Higher lows holding |
| Momentum | Cooling | Overbought on daily unwinding. Weekly still bullish |
| Flow | Neutral | No strong flow signal in either direction today |
| Evidence | Bullish with patience | Pullback in an uptrend. Wait for support confirmation |
Yesterday vs Today
Yesterday cable pushed higher on broad dollar weakness. Today the dollar recovered and cable gave back a third of a percent. The move was orderly and tracked the EUR/USD decline closely. Sterling-specific factors were absent, making this a pure dollar story.
The Read
GBP/USD at 1.3466 is well above April’s lows. The BOE rate path remains more hawkish than the ECB, which gives sterling relative support on crosses. Against the dollar, the pair moves with risk sentiment. A sustained equity recovery would push cable back toward 1.36. A deeper equity selloff tests 1.34.
The call: buy dips to 1.3400-1.3420. Stop below 1.3350. Target 1.3600 on the next swing.
Key Levels
| Level | Price | Significance |
|---|---|---|
| Target 2 | 1.3650 | Extension target on breakout |
| Target 1 | 1.3600 | Prior high and resistance |
| Entry Zone | 1.3400-1.3420 | Pullback entry area |
| Support 1 | 1.3350 | Structural support |
| Stop Zone | 1.3300 | Below here the uptrend breaks |
| Support 2 | 1.3200 | Deep support level |
What We Called vs What Happened
The framework was bullish on cable with 1.3400 as support. Price remains above that level at 1.3466. The call stands. The pullback has not challenged the support zone yet.
Risk Assessment
Domain risk: Around 30% (low-moderate)
Sterling fundamentals are stable. The BOE is in no rush to cut aggressively. Dollar dynamics drive the short-term but the structural case for cable remains intact. Risk is contained above 1.34.
Bottom line: GBPUSD dipped on dollar recovery but the uptrend holds above 1.3400. Buy pullbacks to 1.3400-1.3420. Target 1.3600. Sterling fundamentals are supportive.
Cross-reference: Today’s FX Report for cross-pair analysis and flow data.
This is analysis, not financial advice. Always manage your risk.
Thursday 23 Apr 2026
Daily Framework Read | Wednesday 22 April 2026 | Published 22:00 London / 17:00 New York / 07:00 Tokyo
1.3502 -0.22%
Cable slipped modestly as weak UK PMI data weighed on sterling. The move was contained, just 22 pips of real weakness, but the direction was clear. The framework says WATCHING. The dollar is firming, UK data is soft, and the pound has no catalyst to rally. But the move is small enough that it could reverse on any positive UK headline.
Framework Read
| Layer | Reading | Interpretation |
|---|---|---|
| Direction | WATCHING | Modest slip. No conviction in either direction |
| Structure | Range-bound | Stuck in a narrow range. No breakout, no breakdown |
| Momentum | Flat to mild bear | Slight downward lean but nothing actionable |
| Flow | Neutral | No clear institutional positioning visible |
| Evidence | Inconclusive | Weak UK data vs modest dollar strength. Neither side has conviction |
Yesterday vs Today
Yesterday cable was flat. Today it dipped on UK PMI weakness. The move was small but the direction mattered because it confirmed that the pound has no domestic catalyst. The US rally pulled the dollar higher and sterling had nothing to fight back with. A 22-pip move is noise on most days, but when it is backed by weak data, it carries more weight.
The Read
UK PMI was disappointing. Services held but manufacturing slipped further. The Bank of England is in a difficult position: inflation is sticky but growth is weak. That uncertainty translates directly into range-bound price action for cable. Neither the hawks nor the doves have a clear mandate.
The call: no trade. The evidence is split, the range is narrow, and the risk of a whipsaw is high. Wait for either a clean break of 1.3550 or a drop below 1.3450 before committing capital.
Key Levels
| Level | Price | Significance |
|---|---|---|
| Resistance | 1.3550 | Range ceiling. Break above signals GBP strength |
| Pivot | 1.3520 | Session midpoint. Intraday decision level |
| Support 1 | 1.3450 | Range floor. Must hold for bulls |
| Support 2 | 1.3380 | Deeper support. Break signals a trend shift |
What We Called vs What Happened
Yesterday was a watch call and it remains the right call today. Cable is stuck. The PMI data confirmed the domestic headwind but the move was too small to trigger a trade. Patience is correct here.
Risk Assessment
Domain risk: Around 50% (moderate)
Range-bound with no catalyst. The risk is getting whipsawed in a narrow range while paying spread. UK data is soft, dollar is bid, but the move is too small to trade with confidence. Wait for the range to break.
Bottom line: GBP/USD is a watch. Range-bound, no catalyst, weak UK data. Wait for a clean break of 1.3550 or 1.3450 before committing. The best trade here is no trade.
Cross-reference: Today’s FX Report for UK PMI impact and BOE positioning.
This is analysis, not financial advice. Always manage your risk.
Tuesday 21 Apr 2026
Daily Framework Read | Tuesday 22 April 2026
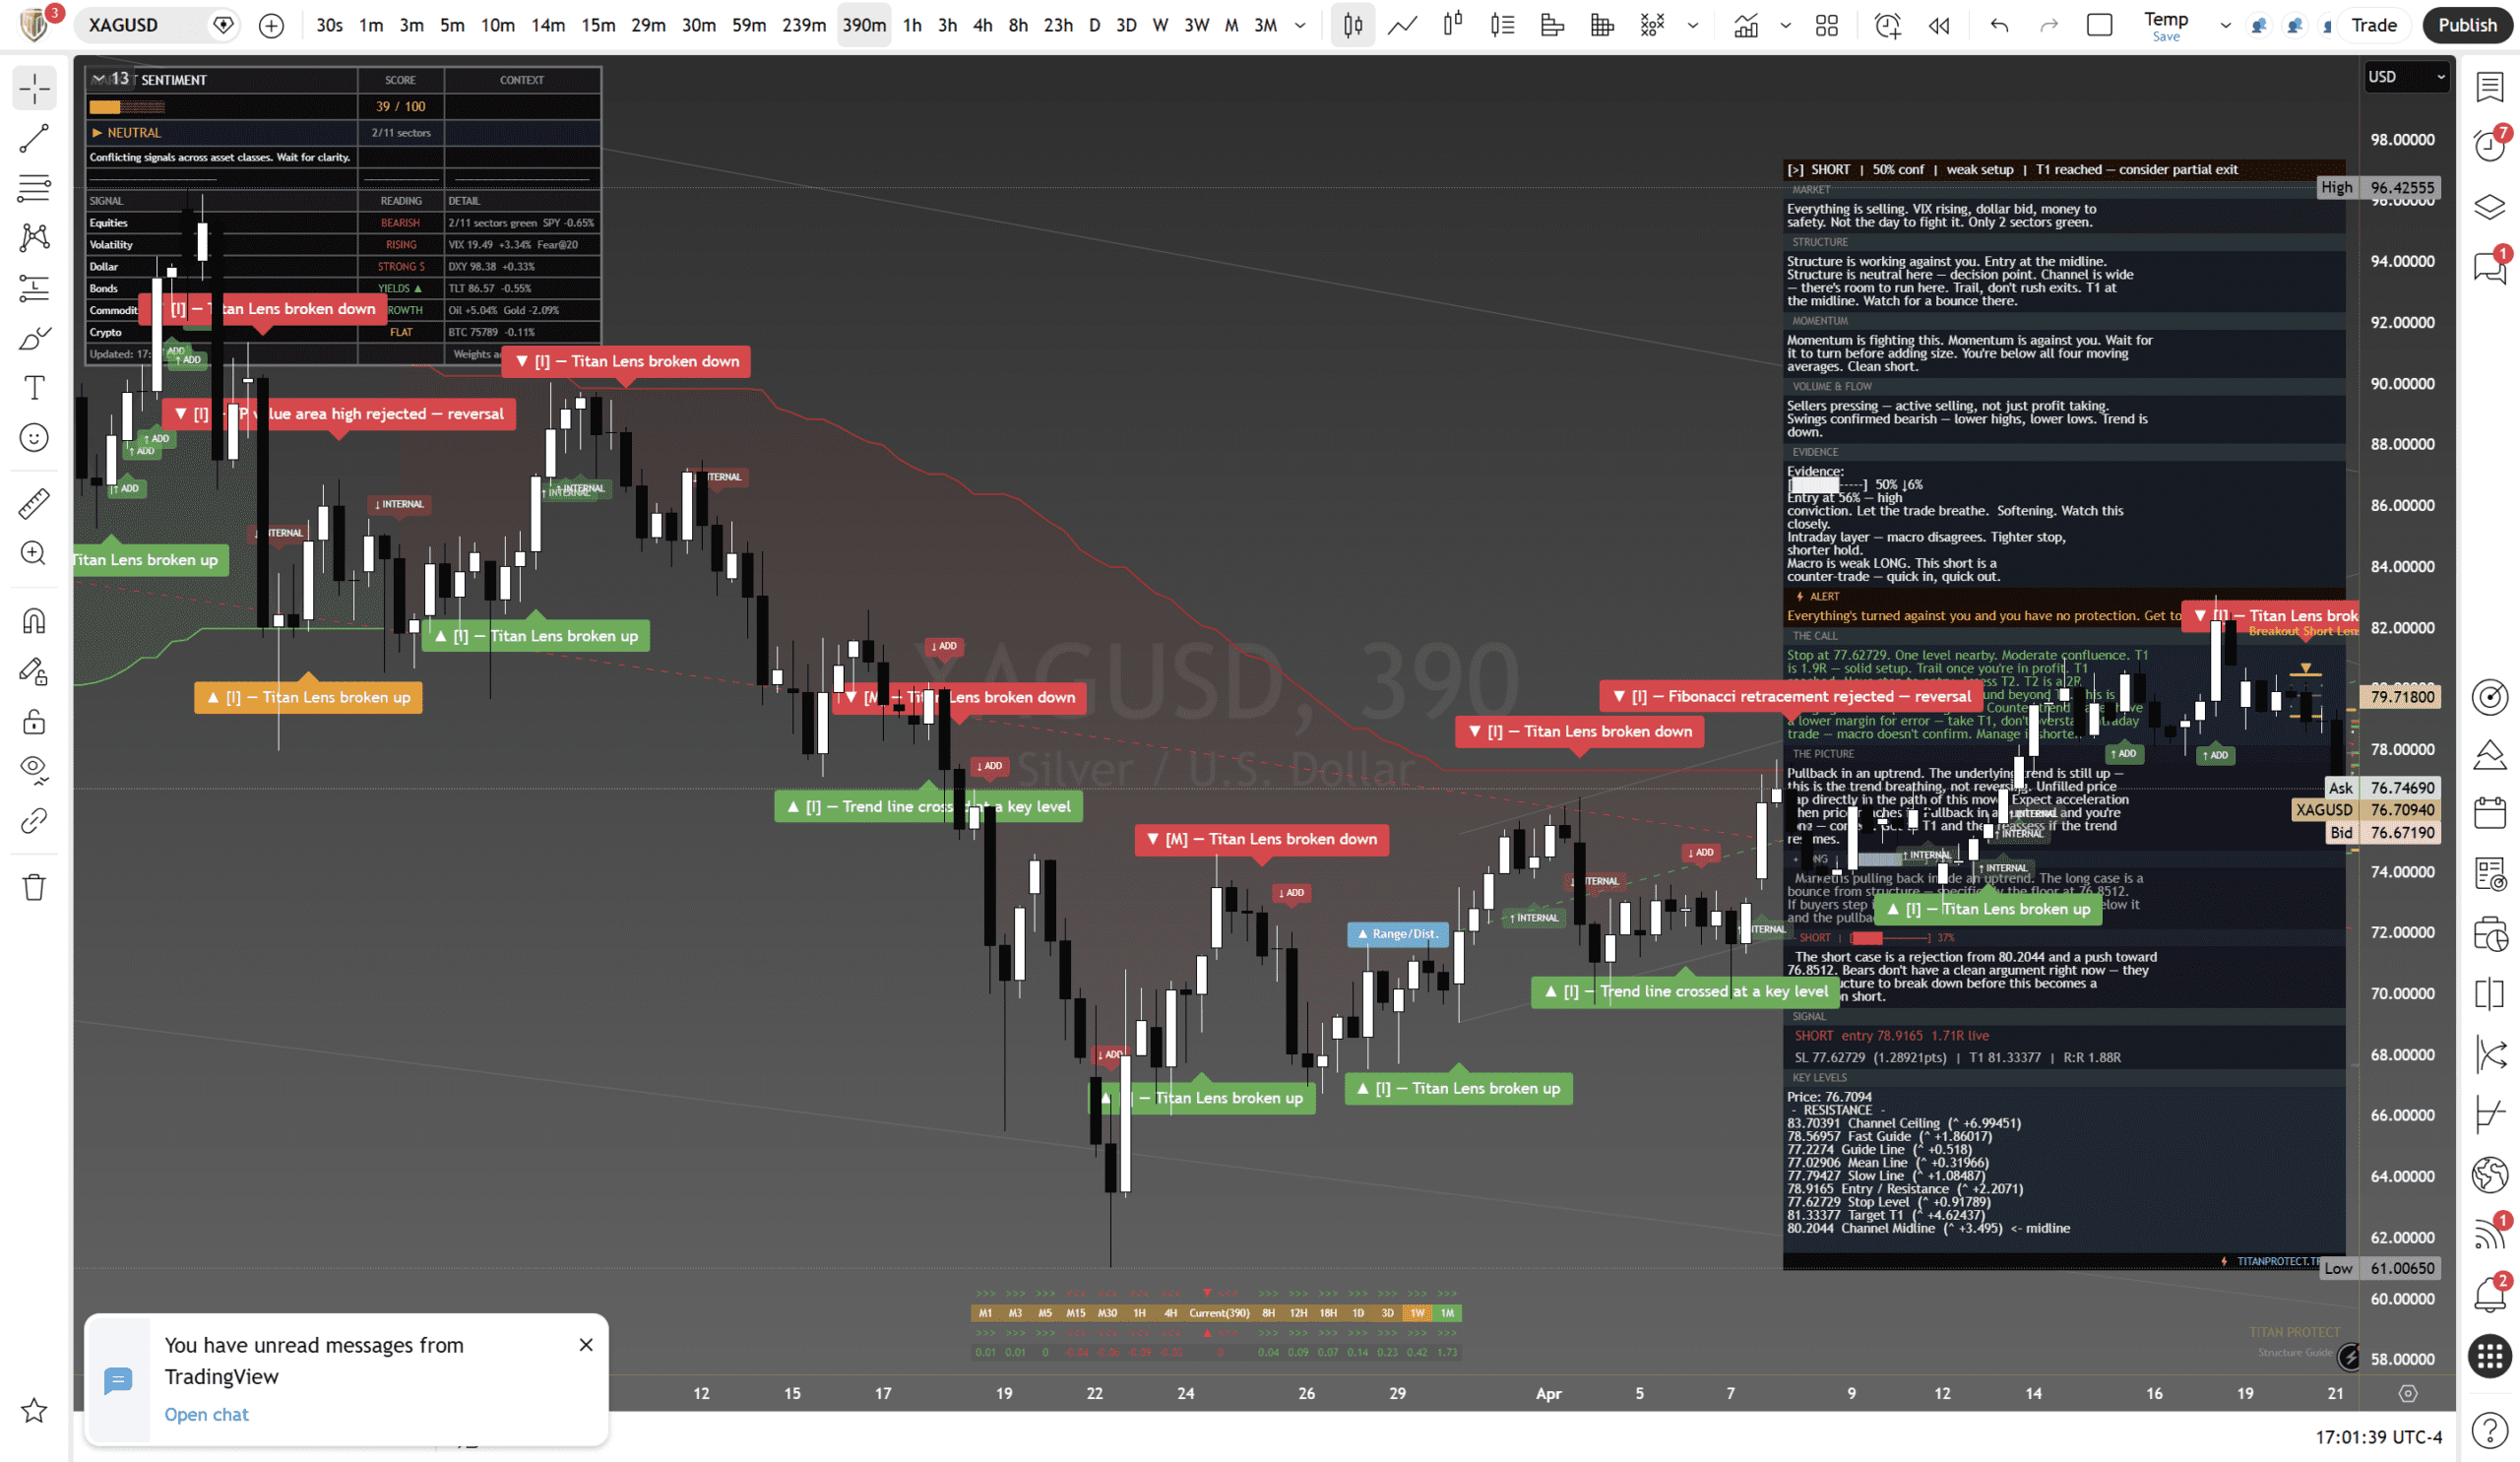
Silver got hammered — down over 5% in a single session, the worst performer in the metals complex. The pullback is within an uptrend, but the severity of the selloff demands caution. Below all four moving averages on the short timeframe. The macro trend remains bullish above the channel floor, but today changed the near-term picture entirely.
Structure
Structure is broken on the intraday. Below all four moving averages. Active selling, not just softening. The broader trend is still up, but today changed the near-term picture completely.
Momentum and Flow
Momentum is fully aligned short on the intraday. Sellers pressing. Let the trade breathe but do not hold if it reverses. Watch for exhaustion signals after a move this sharp.
Active selling with committed volume. This is not thin-market drift — sellers are pressing with conviction. The severity of the move demands respect.
The Two Cases
Pullback in an uptrend. The underlying macro trend still favours silver. But you need structure to confirm the pullback is complete before re-entering. Need to reclaim the midline first.
Rejection from the upper range and a push toward the target. Bears have momentum, structure, and volume. T1 at 75.70. The risk is this is a counter-trend pullback that resolves back to the uptrend.
Key Levels
| Resistance | 86.20 | Channel Ceiling |
| Resistance | 82.63 | Entry / Resistance |
| Pivot | 81.04 | Fast Guide |
| Support | 79.71 | Current Price |
| Support | 75.70 | Target 1 |
| Support | 71.37 | Channel Floor |
Market Context
Silver -5.39%. Gold -2.29%. Industrial metals under pressure. DXY +0.51%. Risk-off selloff hitting high-beta commodities hardest.
Analysis from our institutional research desk. Educational content only — not financial advice. Market data as of 21 April 2026. Past performance is not indicative of future results. All trading involves risk — manage yours. Independent analysis — no affiliation with any broker. Always do your own research before trading.


