
The Silver Framework Journal for July 2026, newest read at the top. Each dated entry is our read on the close, kept as a living record so the framework can be judged over time. This is analysis, not financial advice.
Friday 31 Jul 2026
$58.57
Gold holding above its $4,000 shelf is the week’s cleanest haven tell, while crude stays bid on fresh Middle East supply worry, a second and separate source of volatility running under the complex.
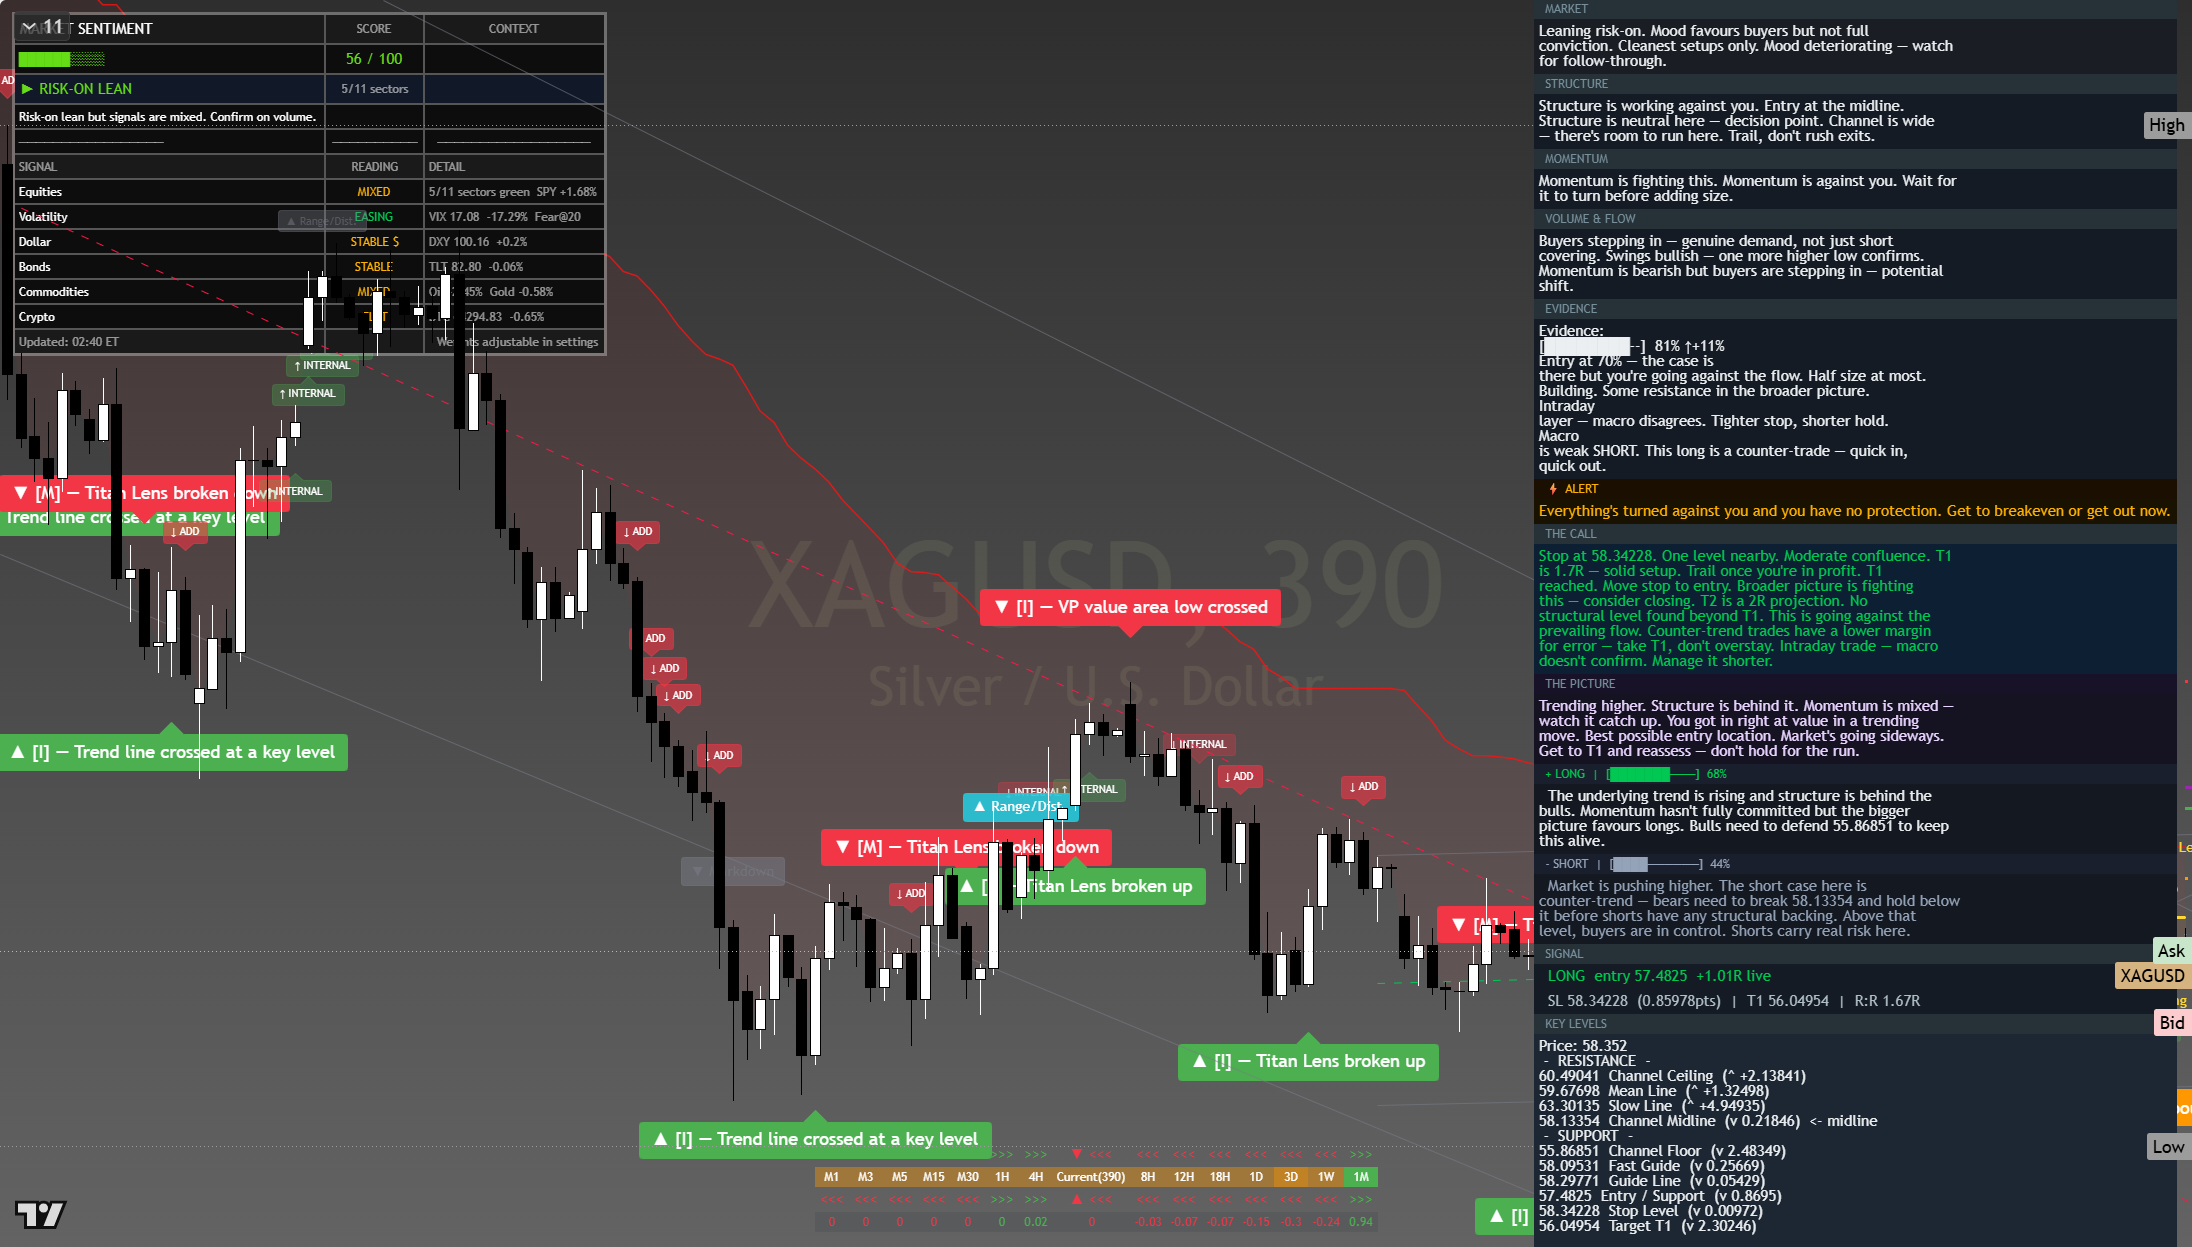
The chart above is the full daily read: structure, momentum, the levels that matter, and where the current price sits against them. Read it top to bottom for the complete picture, and pair it with our session briefs for the wider market context.
This is analysis, not financial advice. It reflects our multi-factor framework and is not a recommendation to buy or sell. Always do your own research and manage your risk.
Thursday 30 Jul 2026
$57.44
Gold holding above its $4,000 shelf is the week’s cleanest haven tell, while crude stays bid on fresh Middle East supply worry, a second and separate source of volatility running under the complex.
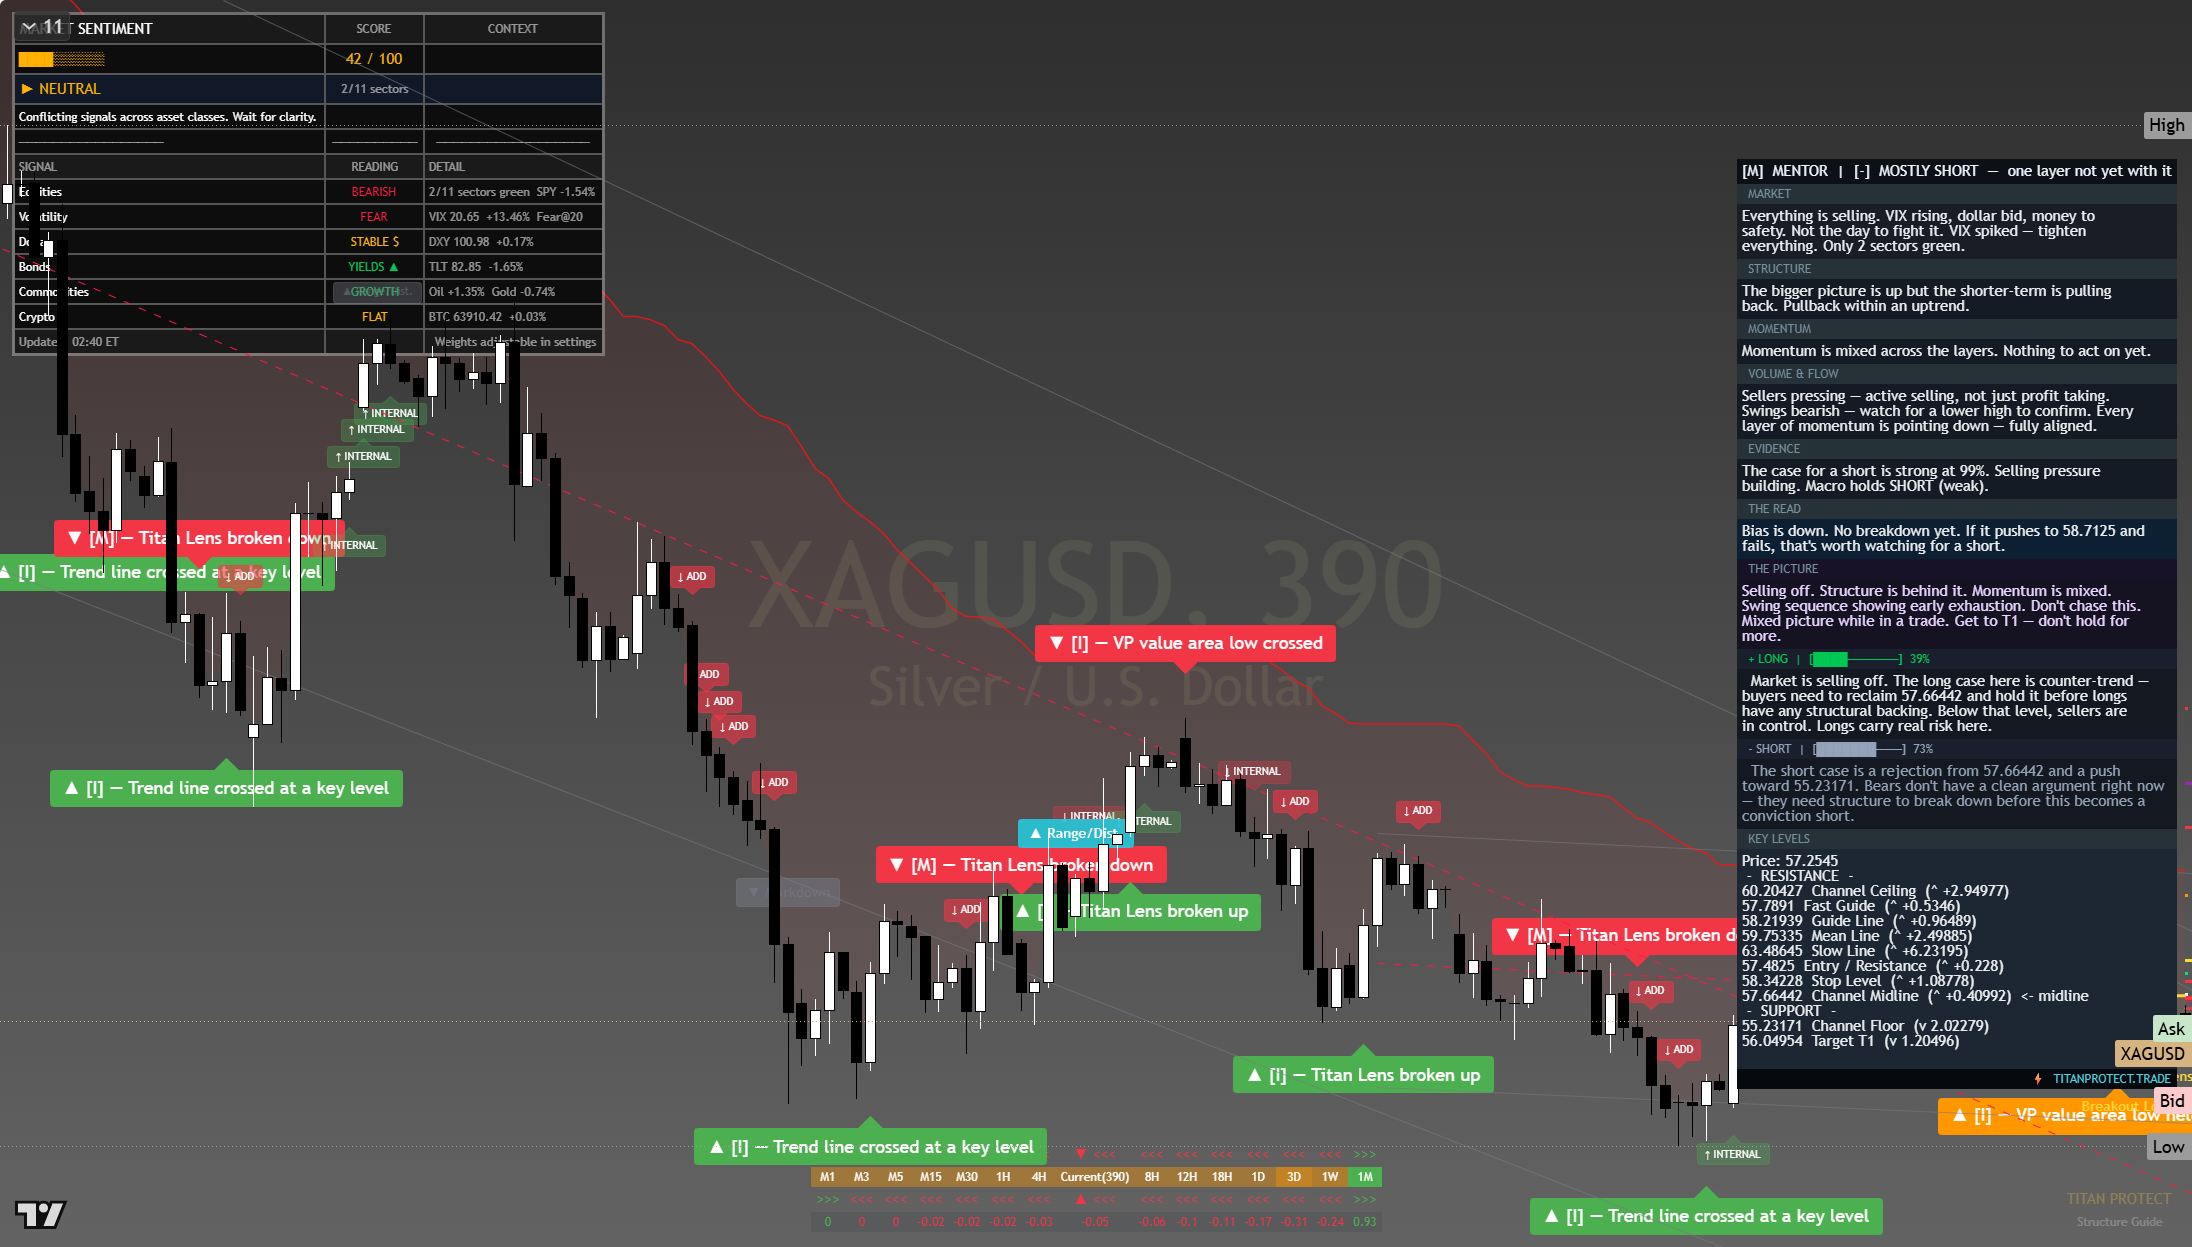
The chart above is the full daily read: structure, momentum, the levels that matter, and where the current price sits against them. Read it top to bottom for the complete picture, and pair it with our session briefs for the wider market context.
This is analysis, not financial advice. It reflects our multi-factor framework and is not a recommendation to buy or sell. Always do your own research and manage your risk.
Wednesday 29 Jul 2026
See chart for latest
Gold holding above its $4,000 shelf is the week’s cleanest haven tell, while crude stays bid on fresh Middle East supply worry, a second and separate source of volatility running under the complex.

The chart above is the full daily read: structure, momentum, the levels that matter, and where the current price sits against them. Read it top to bottom for the complete picture, and pair it with our session briefs for the wider market context.
This is analysis, not financial advice. It reflects our multi-factor framework and is not a recommendation to buy or sell. Always do your own research and manage your risk.
Tuesday 28 Jul 2026
$56.90
Gold holding above its $4,000 shelf is the week’s cleanest haven tell, while crude stays bid on fresh Middle East supply worry, a second and separate source of volatility running under the complex.
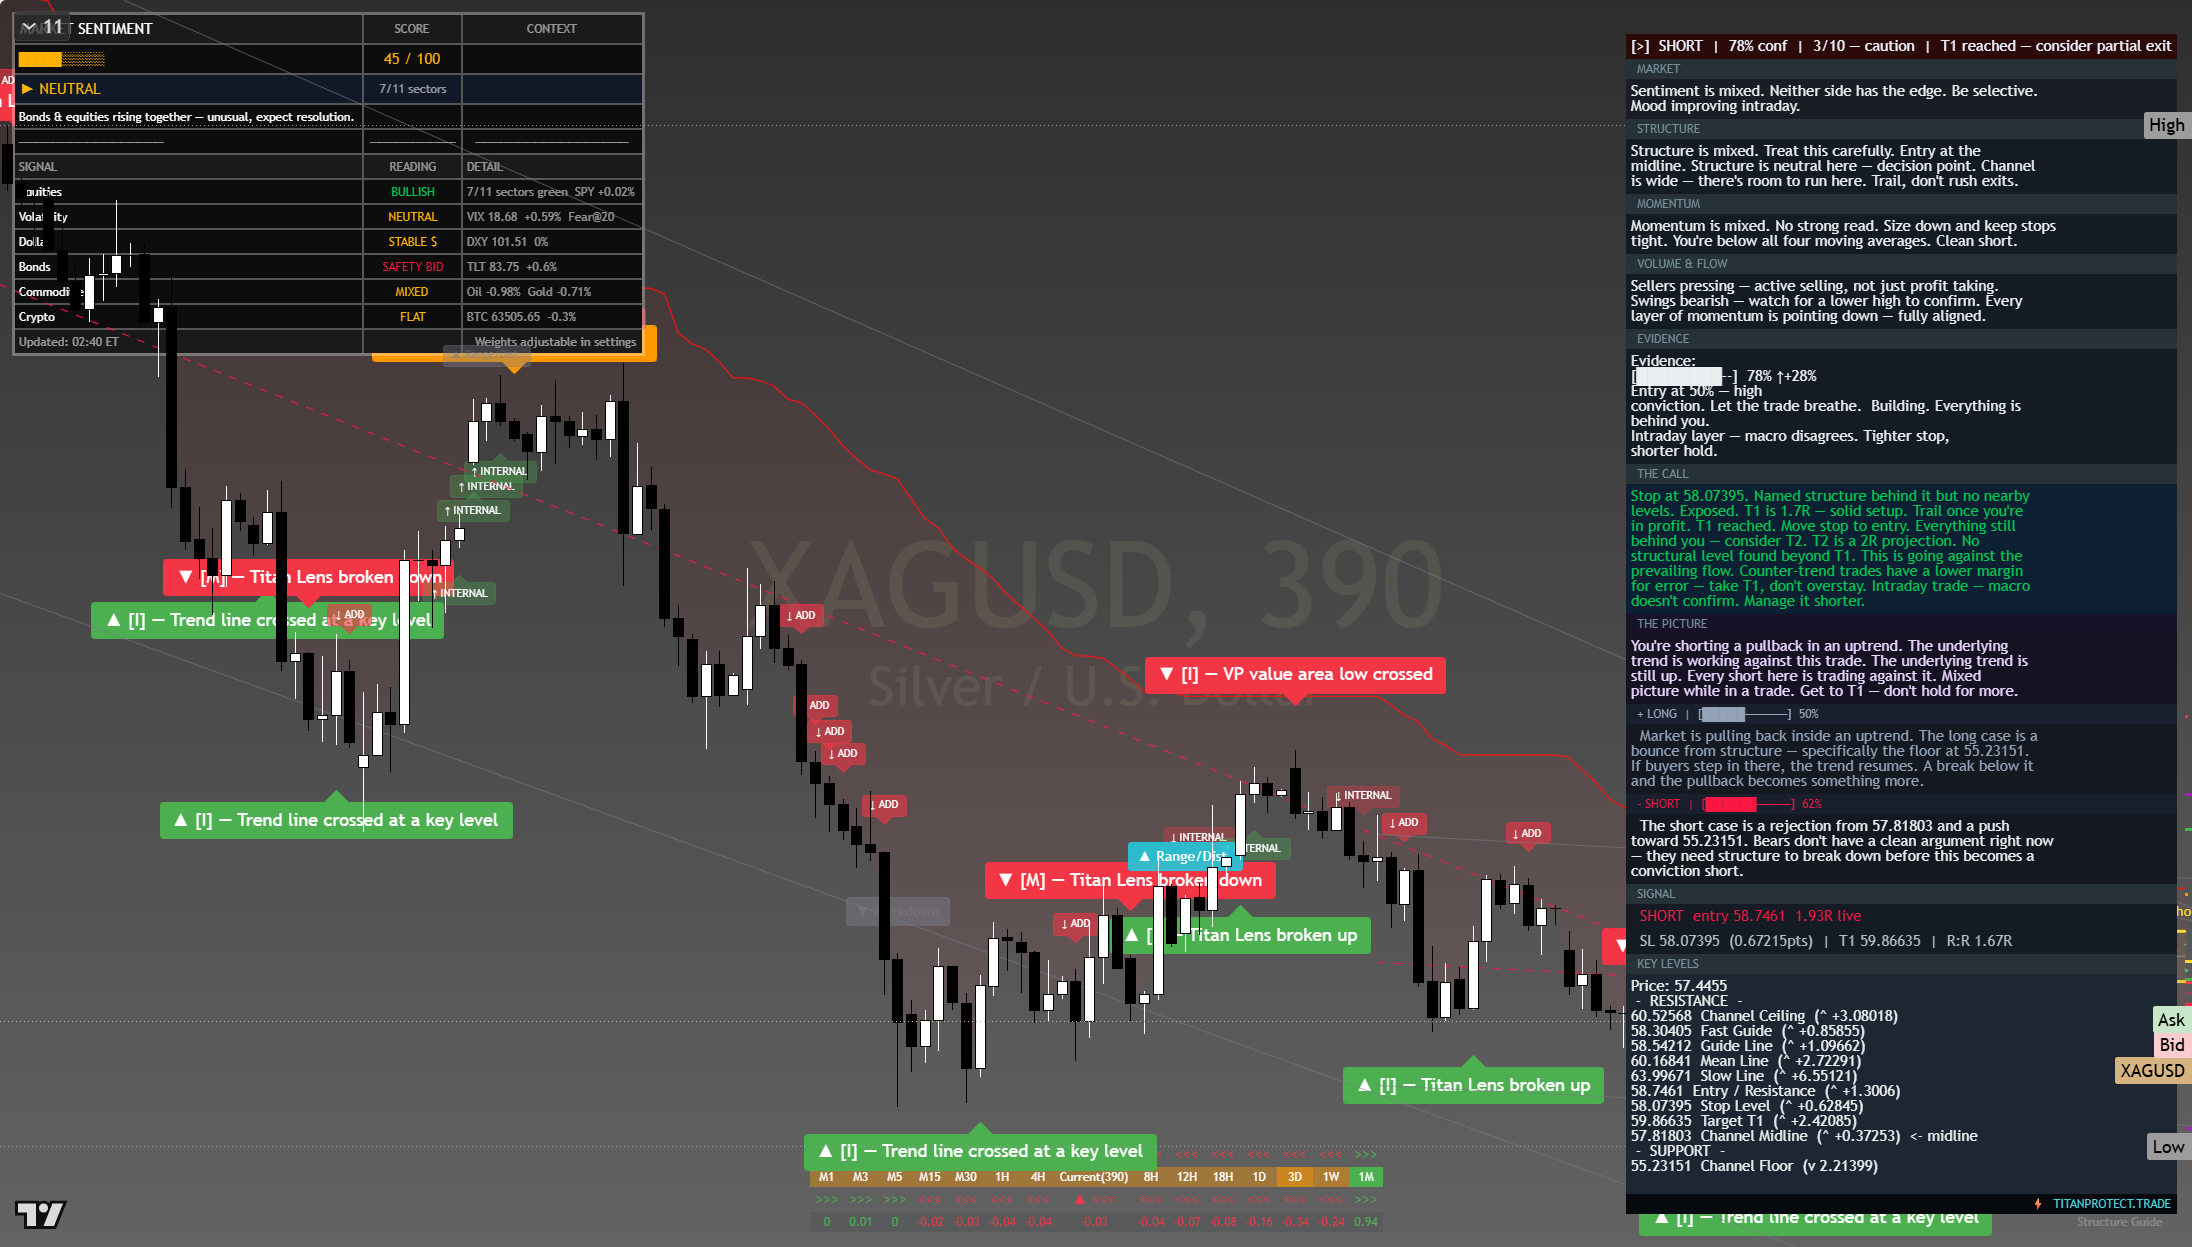
The chart above is the full daily read: structure, momentum, the levels that matter, and where the current price sits against them. Read it top to bottom for the complete picture, and pair it with our session briefs for the wider market context.
This is analysis, not financial advice. It reflects our multi-factor framework and is not a recommendation to buy or sell. Always do your own research and manage your risk.
Monday 27 Jul 2026
$59.31
Gold holding above its $4,000 shelf is the week’s cleanest haven tell, while crude stays bid on fresh Middle East supply worry, a second and separate source of volatility running under the complex.
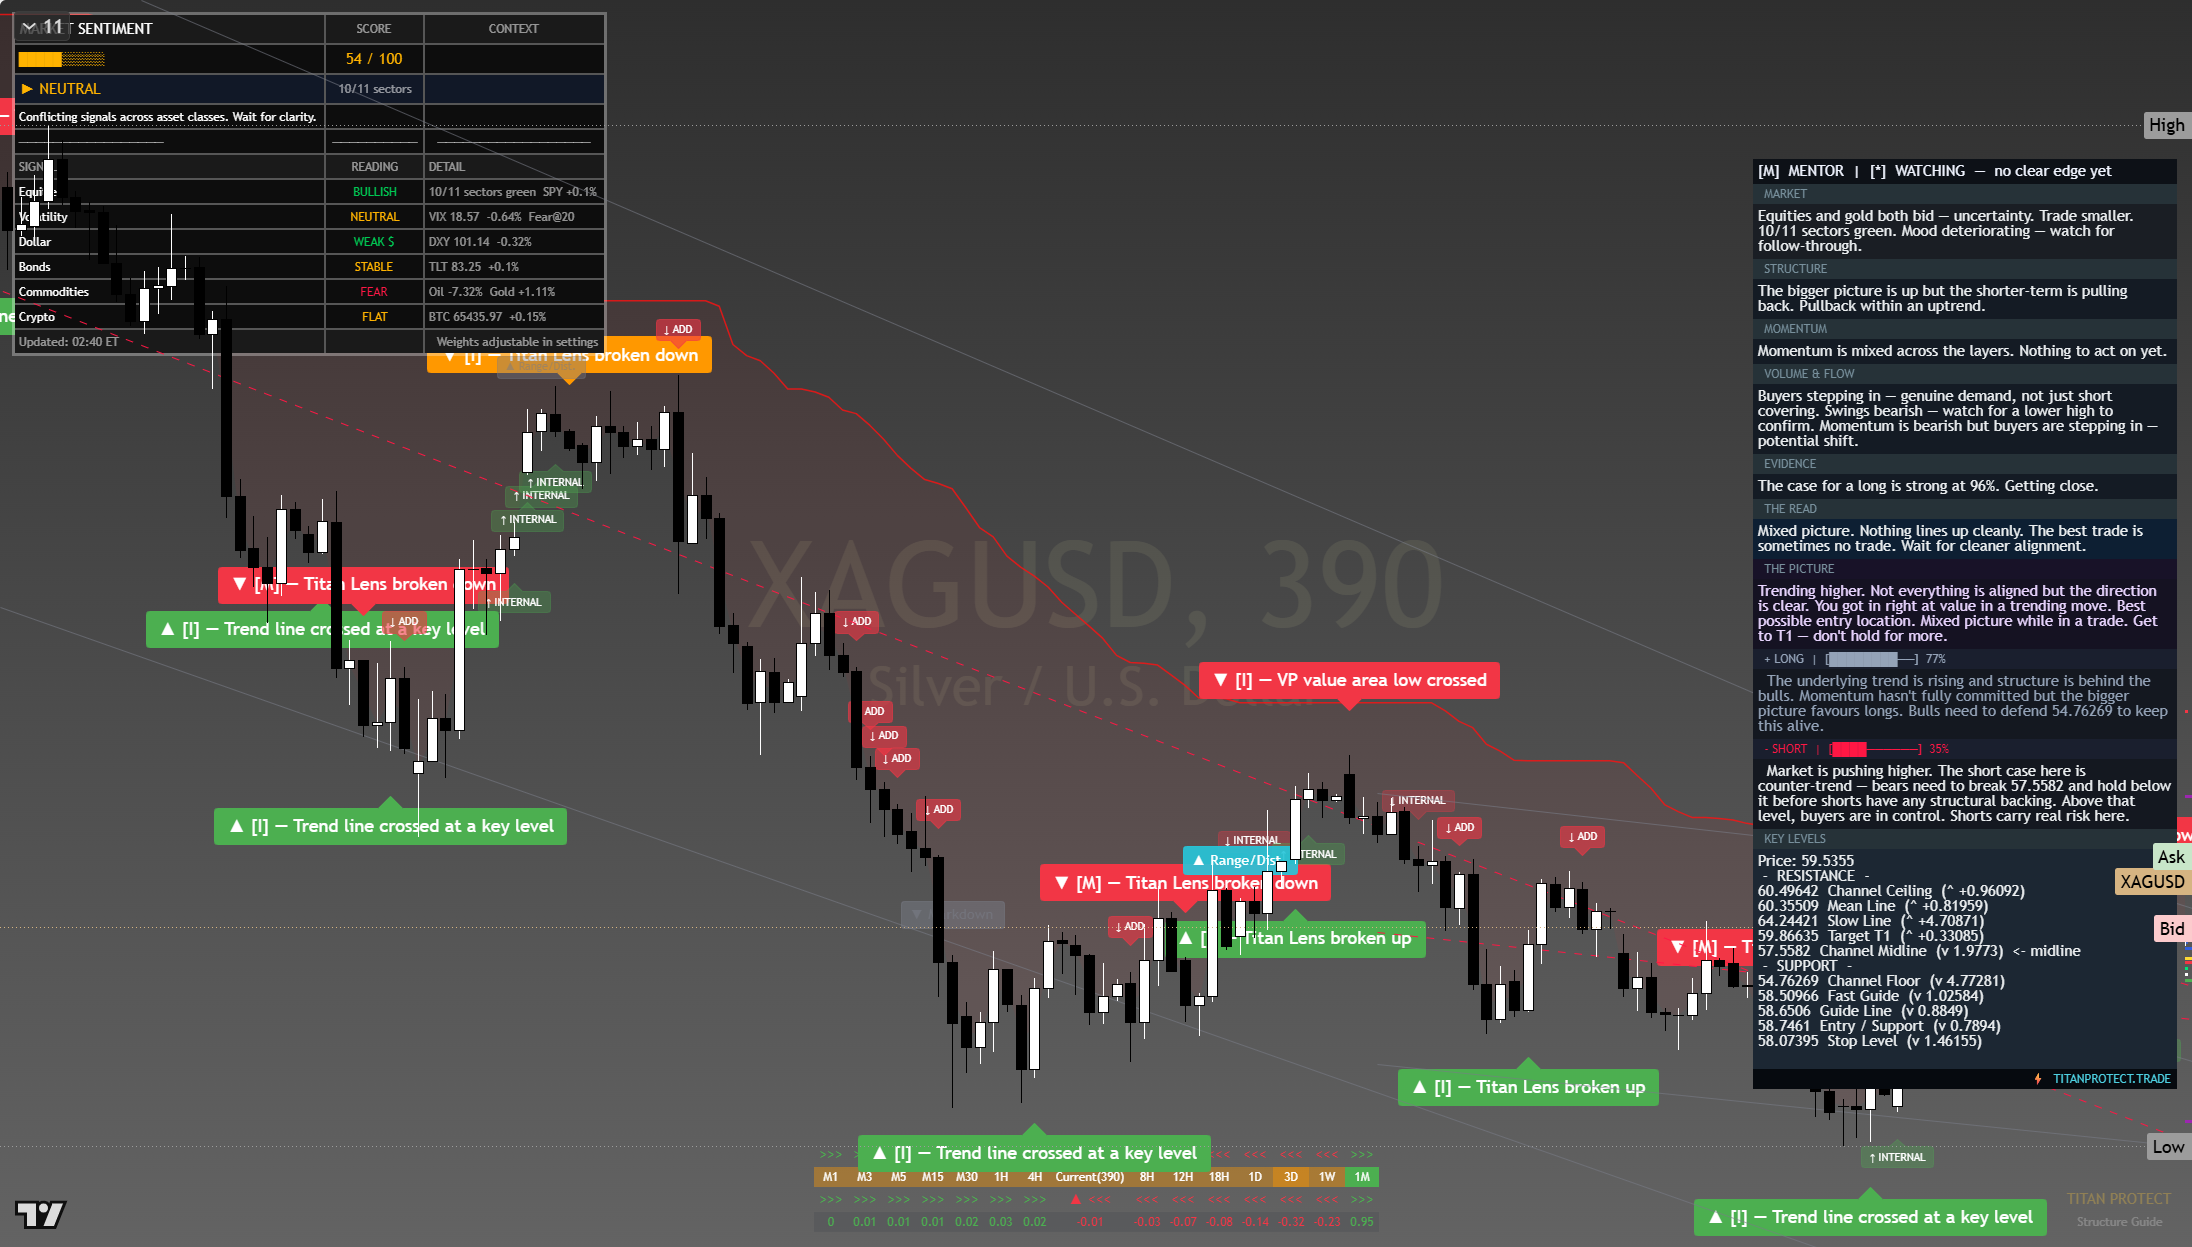
The chart above is the full daily read: structure, momentum, the levels that matter, and where the current price sits against them. Read it top to bottom for the complete picture, and pair it with our session briefs for the wider market context.
This is analysis, not financial advice. It reflects our multi-factor framework and is not a recommendation to buy or sell. Always do your own research and manage your risk.
Sunday 26 Jul 2026
$58.20
Gold holding above its $4,000 shelf is the week’s cleanest haven tell, while crude stays bid on fresh Middle East supply worry, a second and separate source of volatility running under the complex.
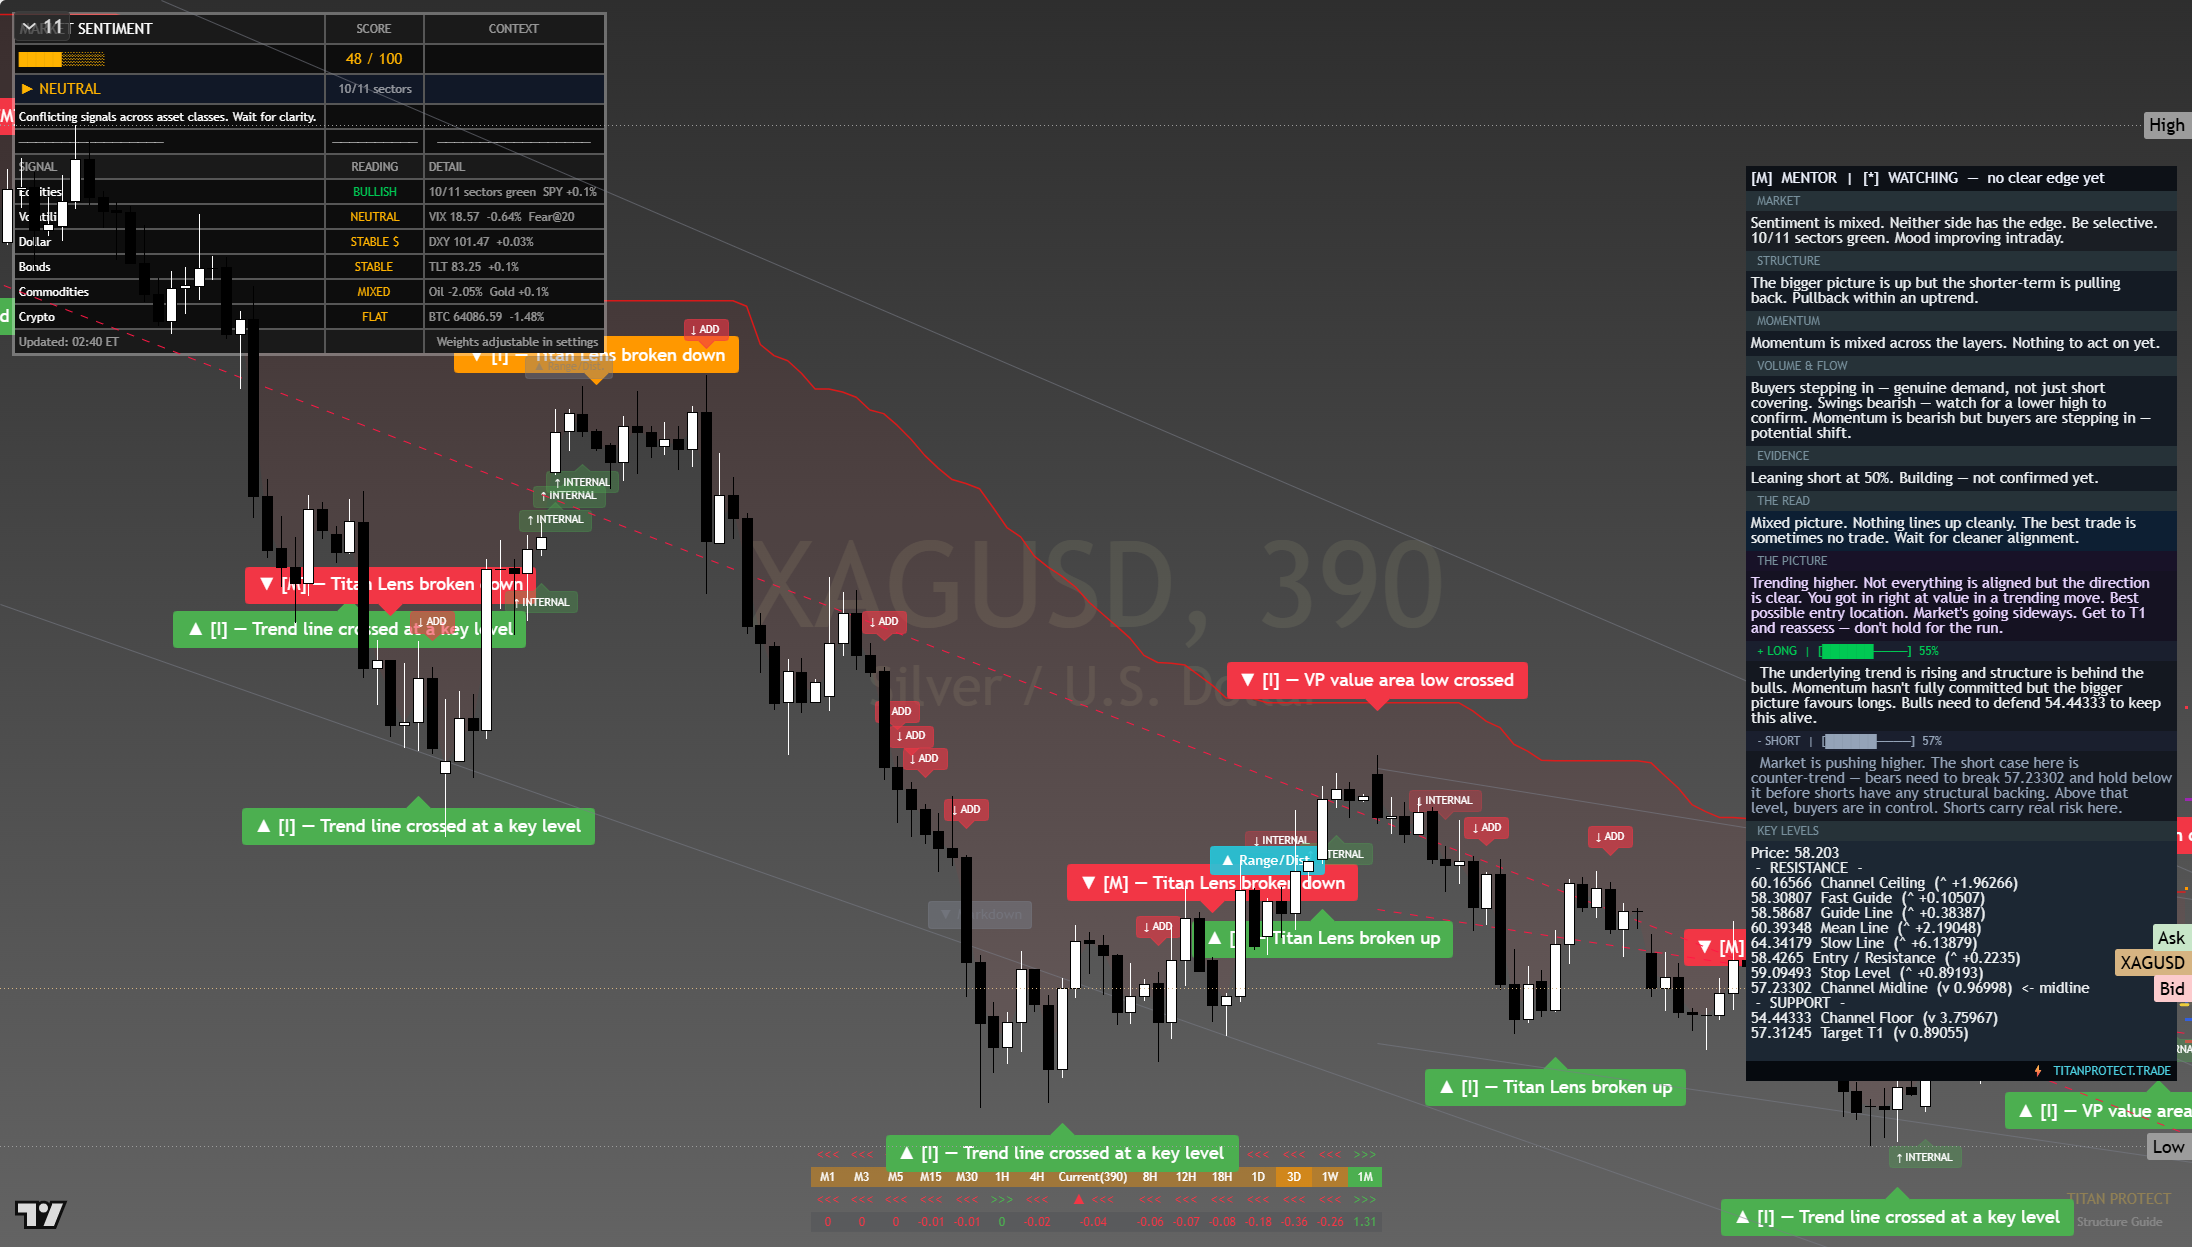
The chart above is the full daily read: structure, momentum, the levels that matter, and where the current price sits against them. Read it top to bottom for the complete picture, and pair it with our session briefs for the wider market context.
This is analysis, not financial advice. It reflects our multi-factor framework and is not a recommendation to buy or sell. Always do your own research and manage your risk.
Saturday 25 Jul 2026
$58.20
Gold holding above its $4,000 shelf is the week’s cleanest haven tell, while crude stays bid on fresh Middle East supply worry, a second and separate source of volatility running under the complex.
The chart above is the full daily read: structure, momentum, the levels that matter, and where the current price sits against them. Read it top to bottom for the complete picture, and pair it with our session briefs for the wider market context.
This is analysis, not financial advice. It reflects our multi-factor framework and is not a recommendation to buy or sell. Always do your own research and manage your risk.
Friday 24 Jul 2026
$57.54
Gold holding above its $4,000 shelf is the week’s cleanest haven tell, while crude stays bid on fresh Middle East supply worry, a second and separate source of volatility running under the complex.
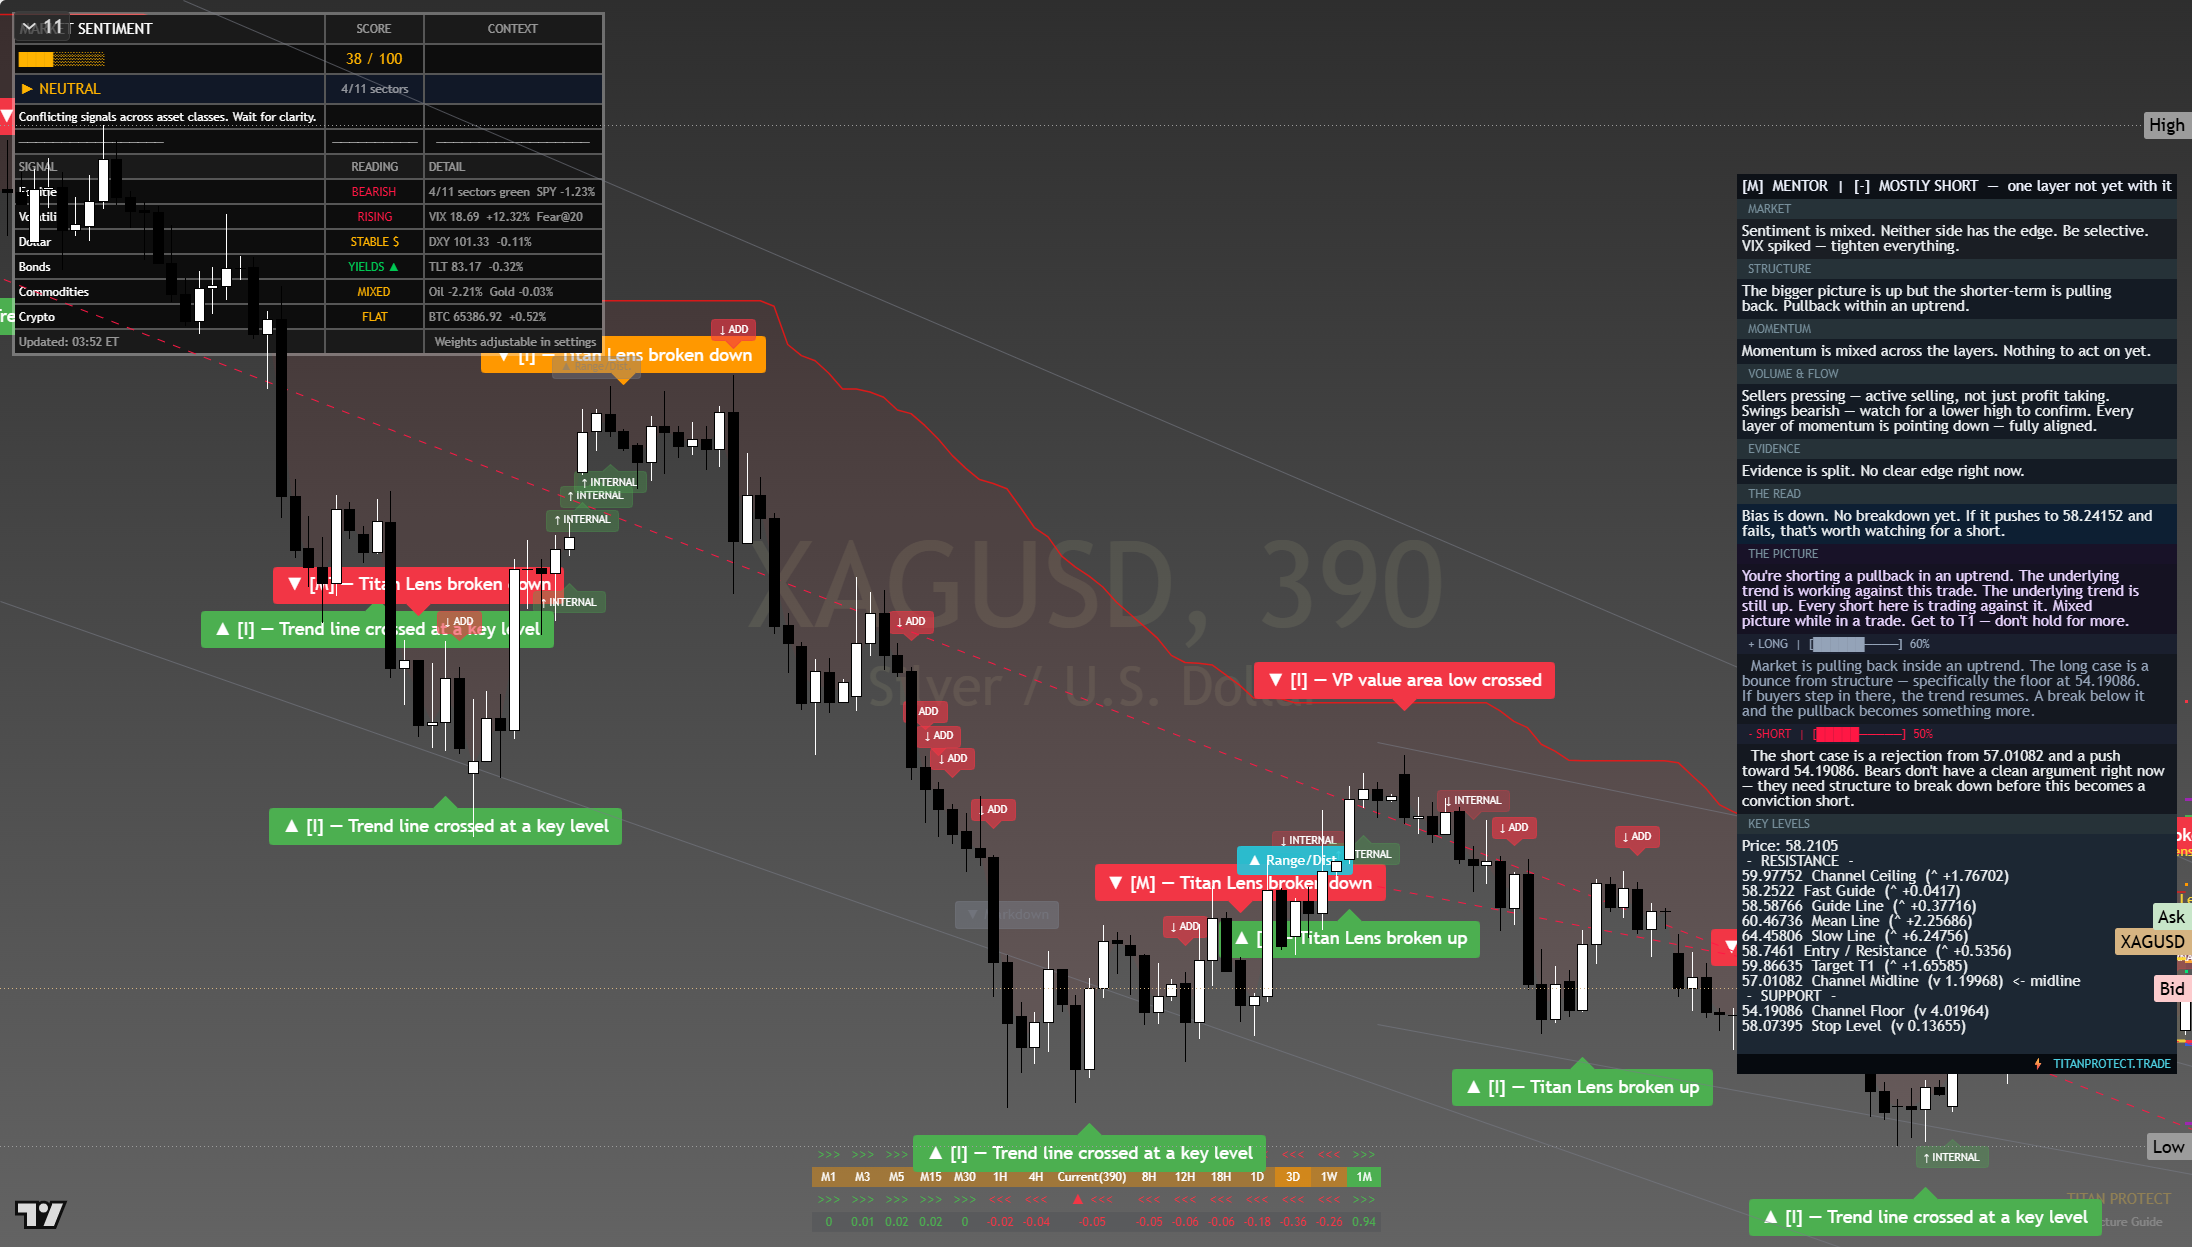
The chart above is the full daily read: structure, momentum, the levels that matter, and where the current price sits against them. Read it top to bottom for the complete picture, and pair it with our session briefs for the wider market context.
This is analysis, not financial advice. It reflects our multi-factor framework and is not a recommendation to buy or sell. Always do your own research and manage your risk.
Thursday 23 Jul 2026
$58.15
Gold holding above its $4,000 shelf is the week’s cleanest haven tell, while crude stays bid on fresh Middle East supply worry, a second and separate source of volatility running under the complex.
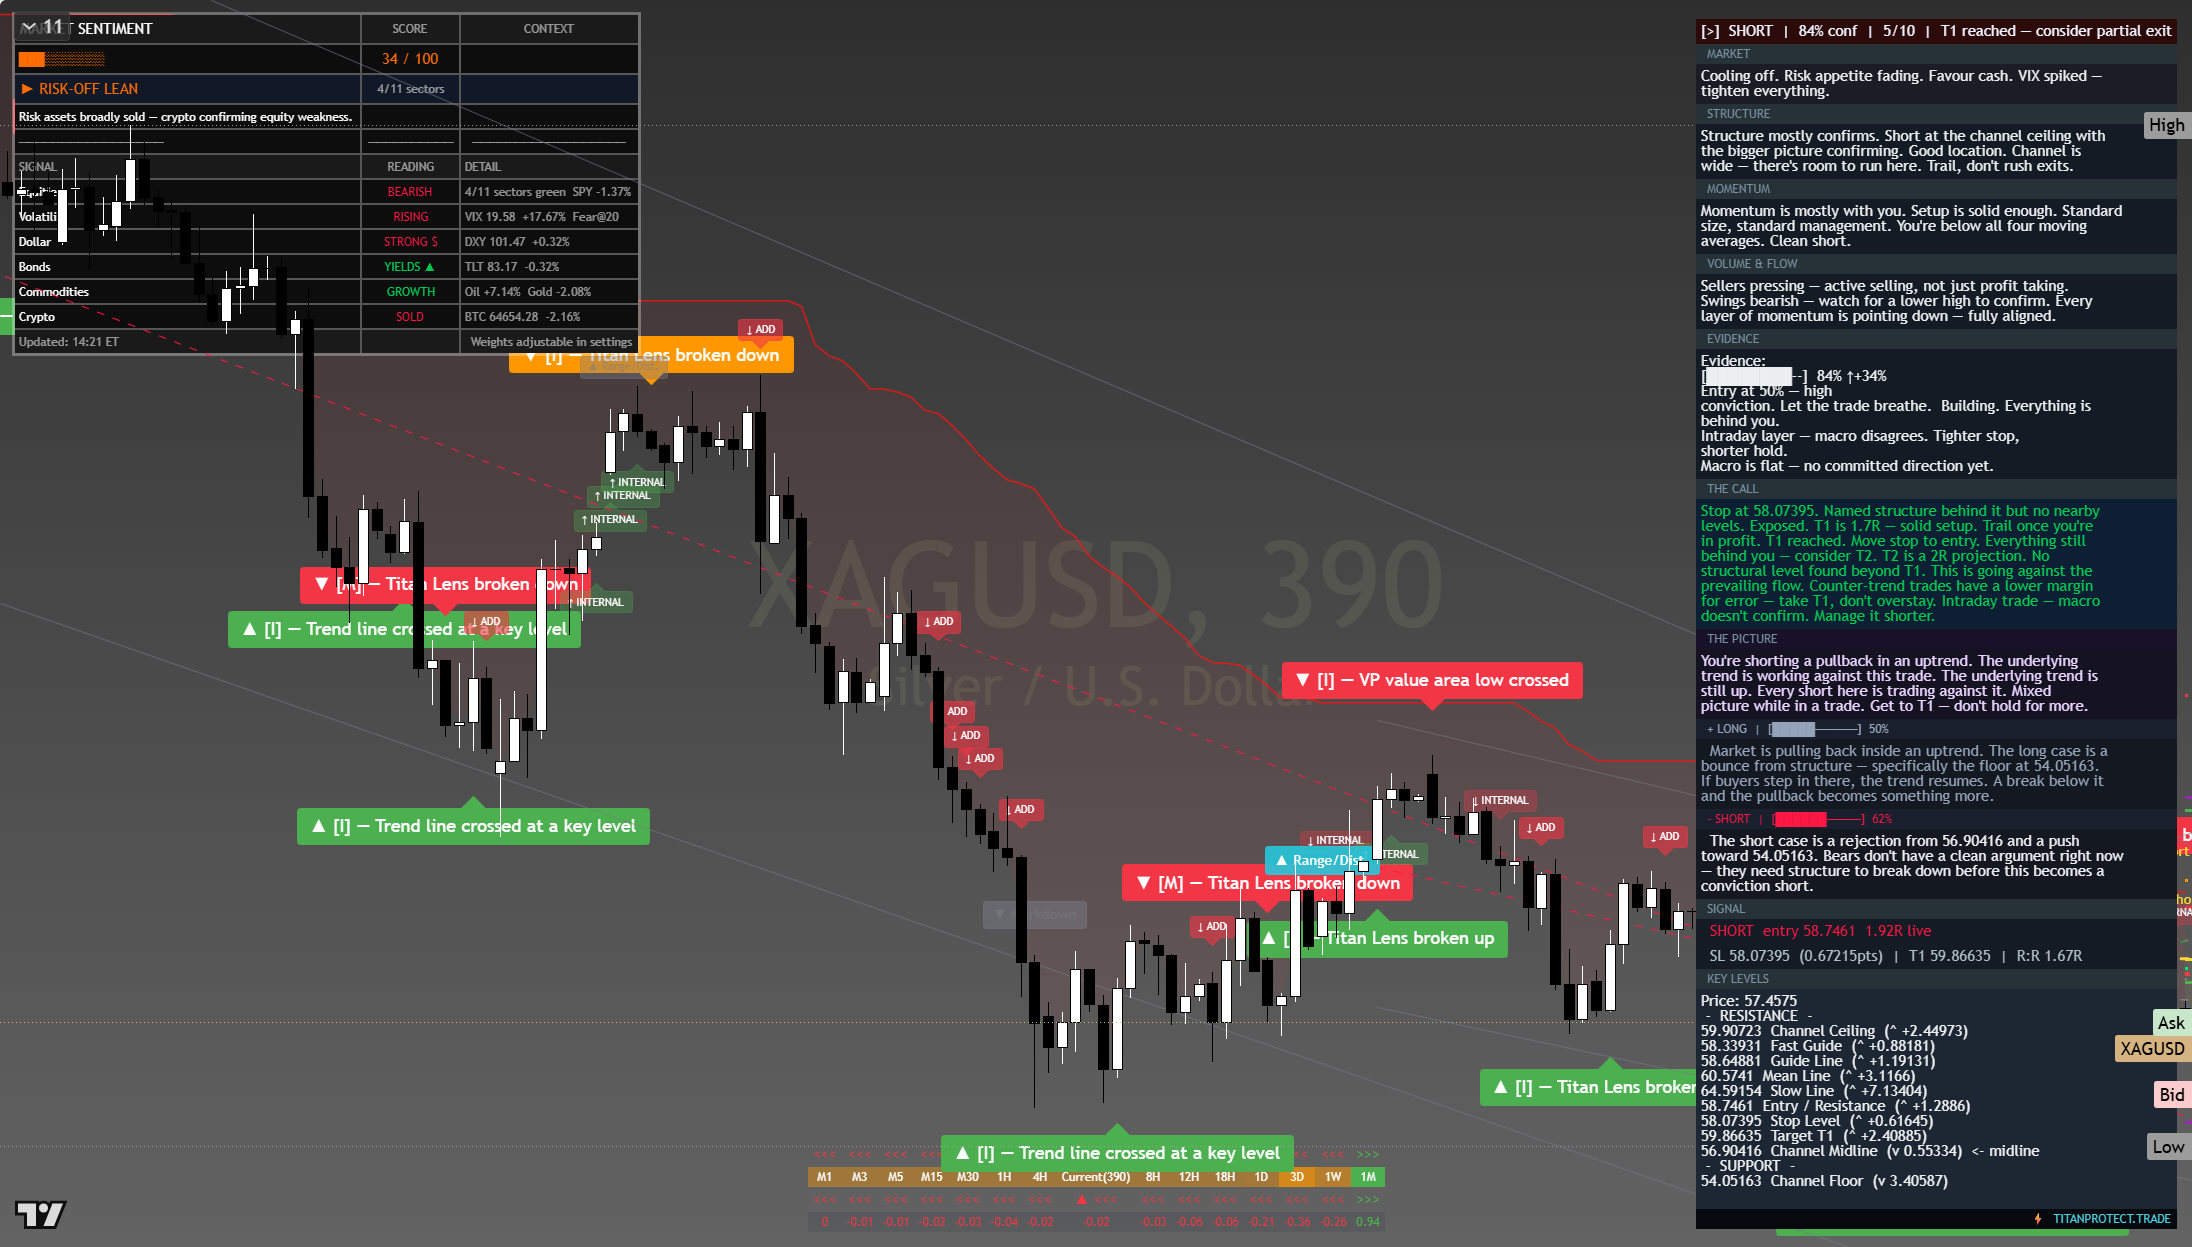
The chart above is the full daily read: structure, momentum, the levels that matter, and where the current price sits against them. Read it top to bottom for the complete picture, and pair it with our session briefs for the wider market context.
This is analysis, not financial advice. It reflects our multi-factor framework and is not a recommendation to buy or sell. Always do your own research and manage your risk.
Wednesday 22 Jul 2026
$59.62
Gold holding above its $4,000 shelf is the week’s cleanest haven tell, while crude stays bid on fresh Middle East supply worry, a second and separate source of volatility running under the complex.
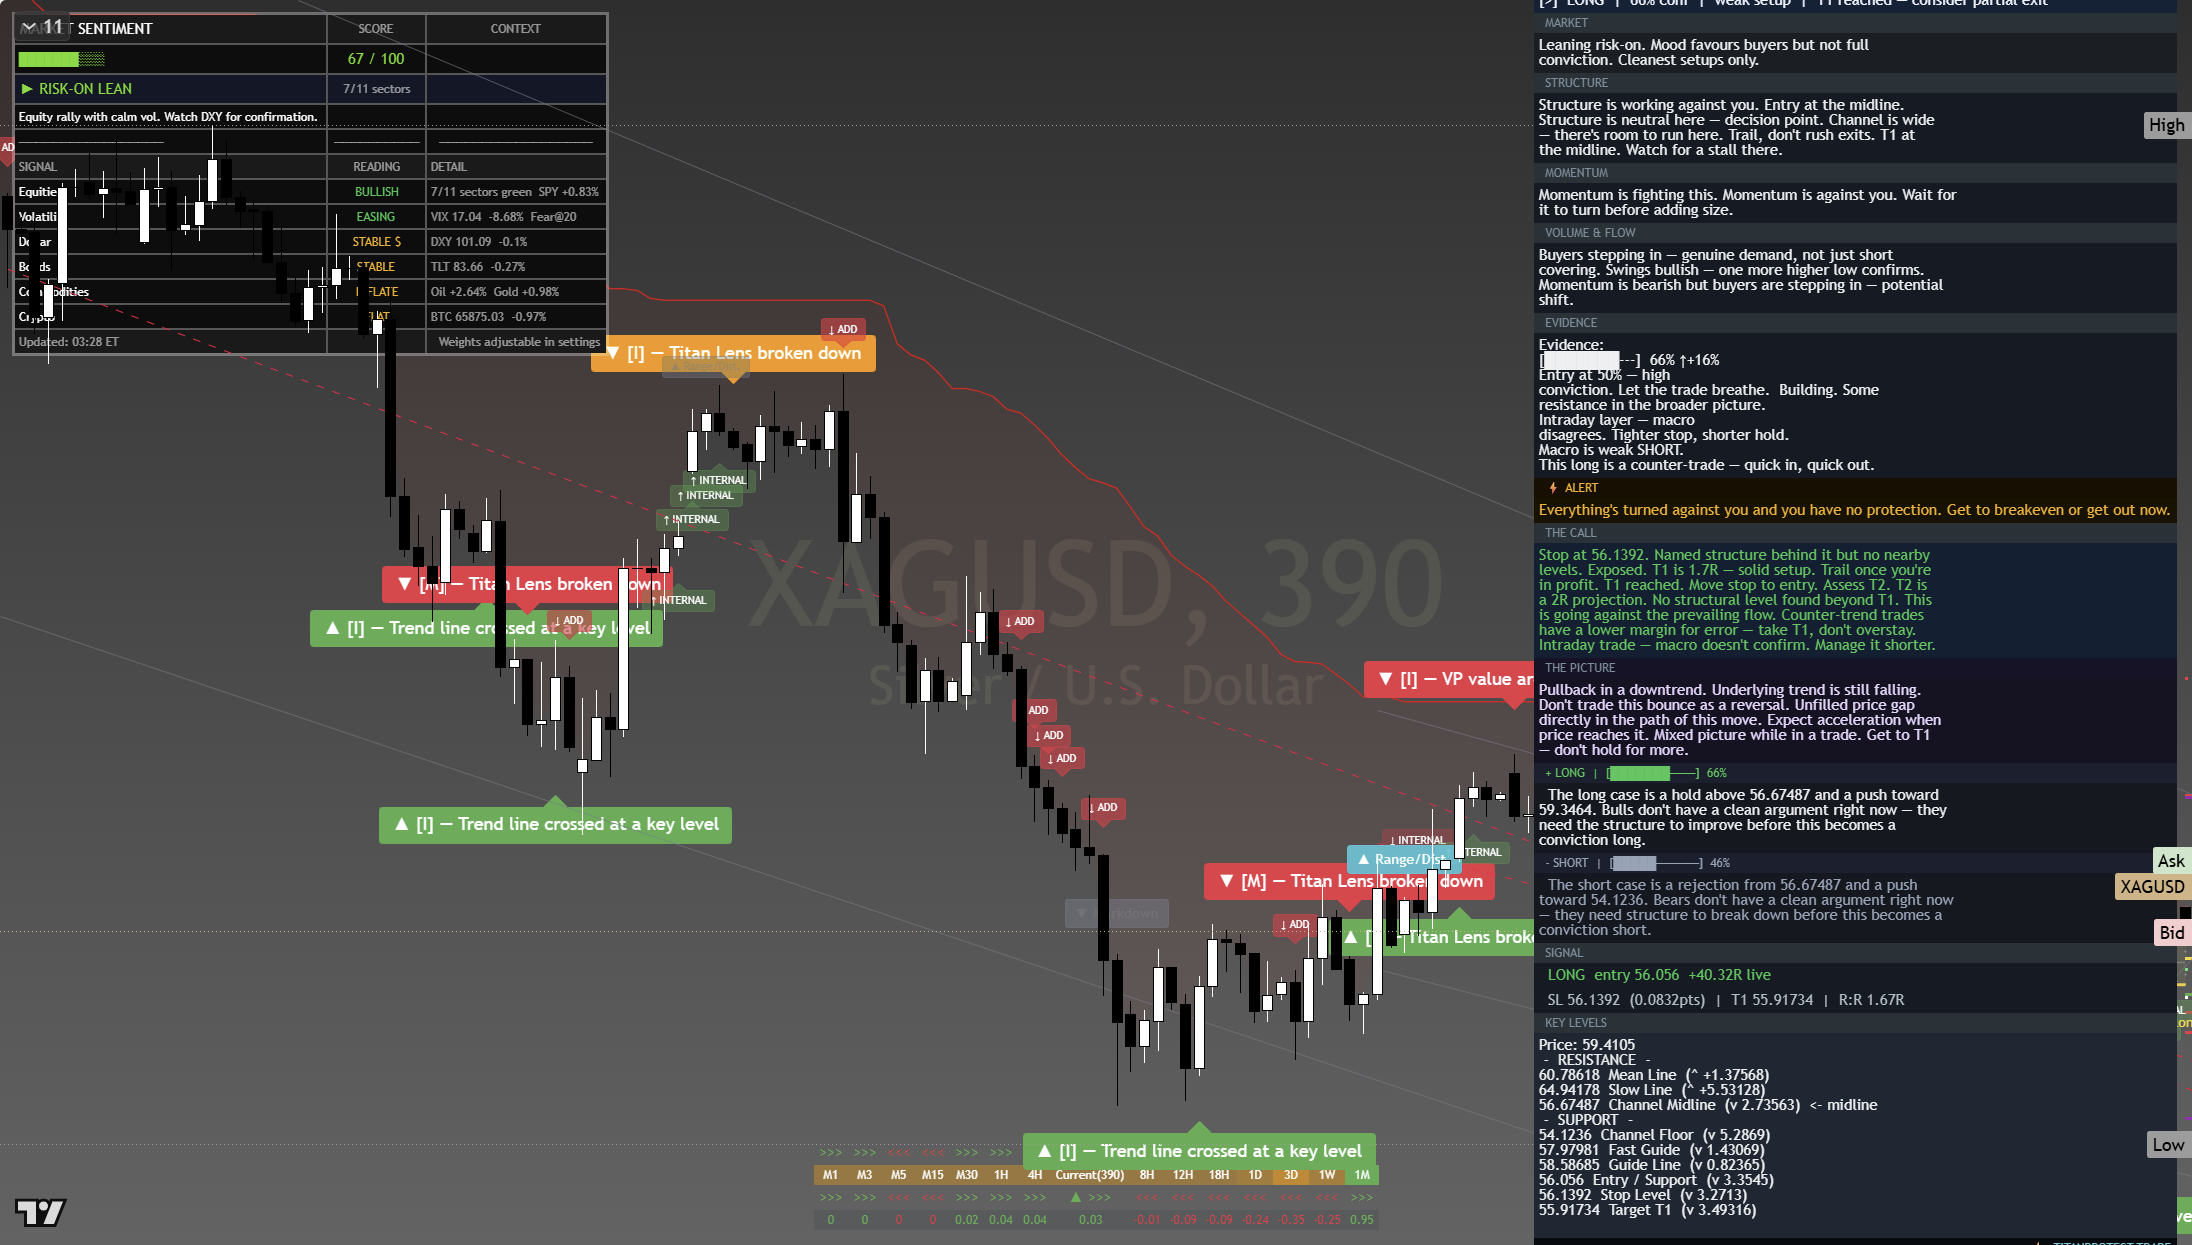
The chart above is the full daily read: structure, momentum, the levels that matter, and where the current price sits against them. Read it top to bottom for the complete picture, and pair it with our session briefs for the wider market context.
This is analysis, not financial advice. It reflects our multi-factor framework and is not a recommendation to buy or sell. Always do your own research and manage your risk.
Monday 20 Jul 2026
$56.65
Gold holding above its $4,000 shelf is the week’s cleanest haven tell, while crude stays bid on fresh Middle East supply worry, a second and separate source of volatility running under the complex.
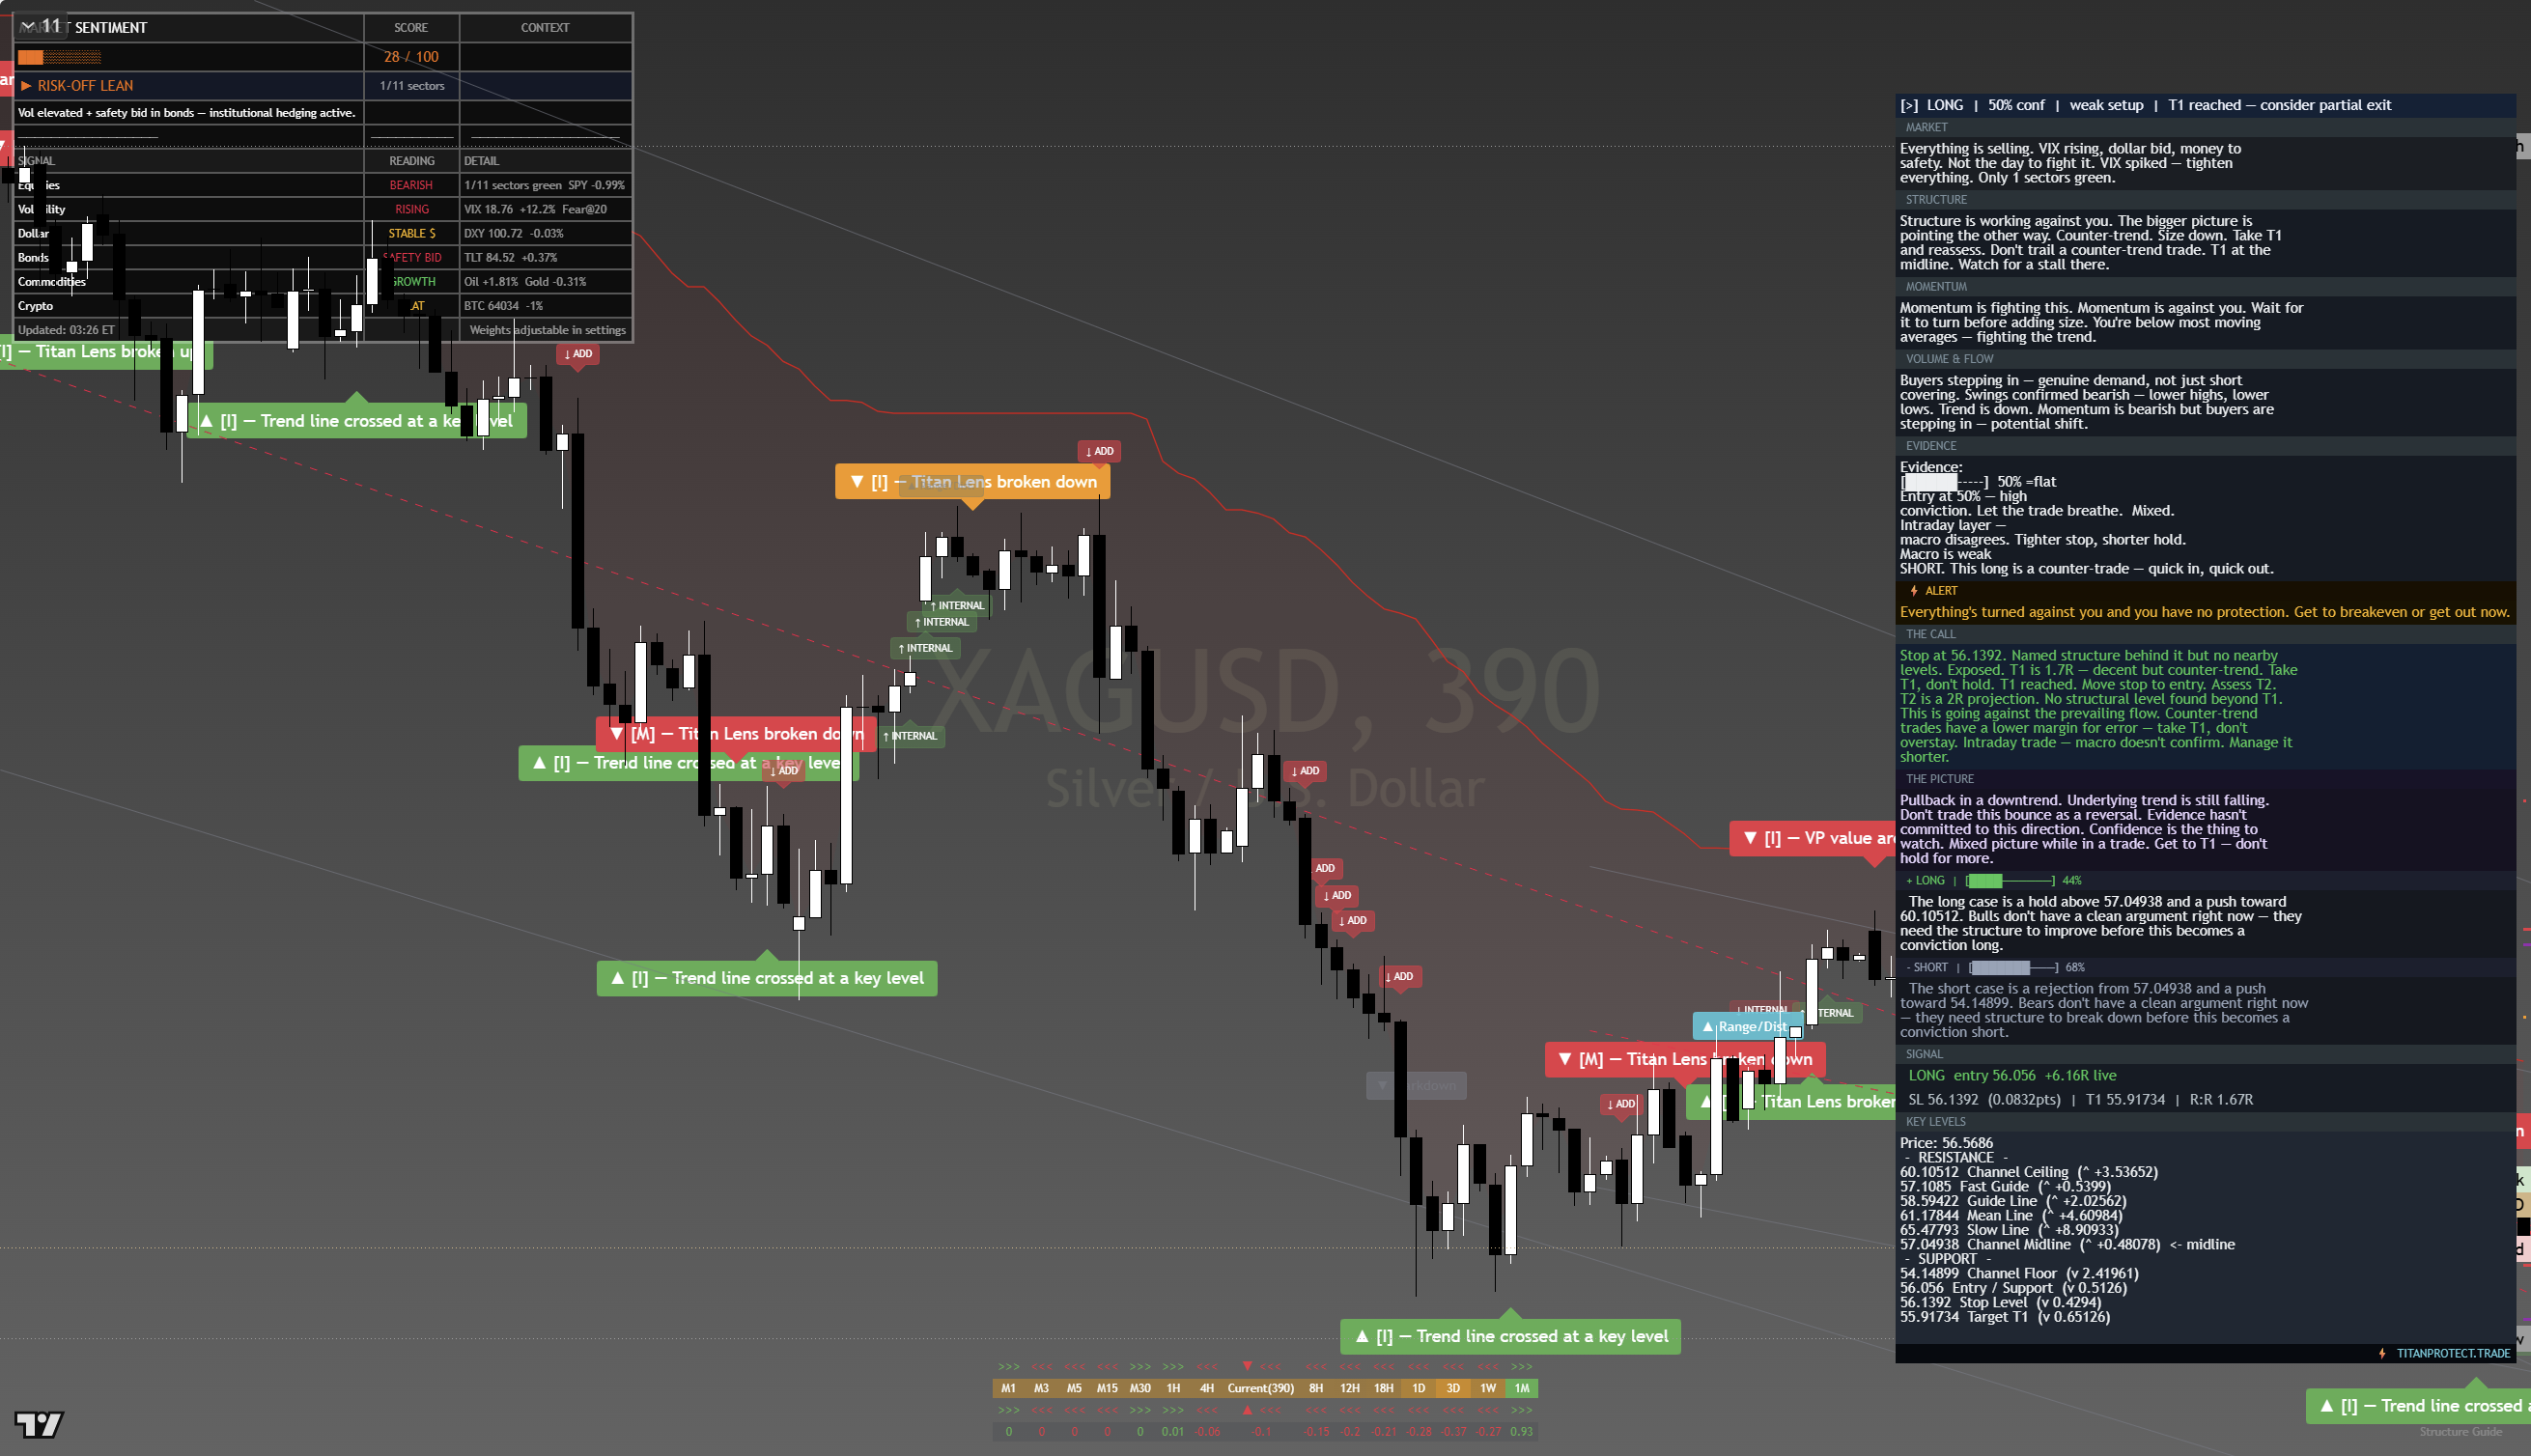
The chart above is the full framework read: structure, momentum, the levels that matter, and where the current price sits against them. Read it top to bottom for the complete picture, and pair it with our session briefs for the wider market context.
This is analysis, not financial advice. It reflects our multi-factor framework and is not a recommendation to buy or sell. Always do your own research and manage your risk.
Wednesday 15 Jul 2026
Silver (XAG/USD) Rips 2.49% Back to $59.07 as Cool Inflation Reclaims the Whole Oil-Shock Flush: Daily Read 14 July 2026
Silver (XAG/USD) | Daily Framework Read | Tuesday 14 July 2026 (US close)
Silver (XAG/USD) closed the Tuesday session at $59.07, up 2.49 per cent on the day and recovering almost the entire flush that hit the metals complex on Monday. A cool June inflation print, headline down 0.4 per cent on the month and the annual rate easing to 3.5 per cent, sent Treasury yields sharply lower and flipped a de-risking tape straight back to risk-on. Silver did what its higher beta promises on the way up as well as the way down, outrunning Gold (XAU/USD) at plus 1.55 per cent, while Copper (HG) added 2.05 per cent to confirm the industrial leg was healing too. The near-term bias turns constructive above the $58 handle, but price has run right back into the underside of the $59.71 to $60.00 shelf it lost on Monday, and that broken support is now the wall the reclaim has to prove it can clear.
Framework thesis. Silver carries two engines, a monetary one and an industrial one, and today both fired at once. The dovish surprise in inflation dropped real yields, which lifts the appeal of a metal that pays no coupon, and the risk-on turn plus a bid in Copper repaired the growth-scare damage that had hammered the industrial leg on Monday. That is why silver led the metals higher rather than lagging. The read is that Monday was a positioning flush, not a trend change, and the recovery is real, but the tape has arrived at the exact shelf it broke, so this is a reclaim to respect and buy on weakness, not a level to chase at the highs.
Where it sits today
Silver (XAG/USD) settled at $59.07, a gain of 2.49 per cent or roughly $1.44 from Monday’s $57.63 close. The metal opened the US session already firming, climbed back through the $58 handle as the inflation number hit, and reclaimed the $59 shelf it had surrendered the day before, finishing the session pressed up against the underside of the old break line. In one session it recovered almost all of the prior day’s 3 per cent drop, which is a powerful reversal signature and the hallmark of a flush that ran out of sellers rather than a fresh leg lower.
The context did all the work. June inflation printed cool, headline down 0.4 per cent on the month against expectations of a 0.2 per cent fall, with the annual rate slipping to 3.5 per cent from 3.8 per cent and core easing to 2.6 per cent. Treasury yields fell hard on the release, US equities rallied with the NAS100 (US Tech 100) up 1.1 per cent to around 29,586 on semiconductor leadership, and the debasement-friendly backdrop of falling real rates handed the precious metals a clean tailwind. The one thread that did not cool was crude, which held its live Hormuz risk premium near $79.82, keeping an inflation-hedge bid alive underneath the metal even as the official energy read softened.
What the framework reads
Three things stand out. First, the reversal is broad and it is confirmed. Silver did not rally alone; Gold firmed, Copper added 2.05 per cent, and when the monetary and the industrial metals move up together the message is a genuine repair of the complex rather than a narrow squeeze. Second, silver led. The gold-to-silver ratio compressed as silver’s plus 2.49 per cent outran gold’s plus 1.55 per cent, and leadership from the higher-beta metal on an up day is the mirror image of Monday’s lag, telling you the leveraged longs that were flushed are being rebuilt. Third, the wall is obvious. Price has climbed straight back to the $59.71 open and the $59.80 to $60.00 shelf it lost on Monday, and former support that breaks becomes resistance until it is decisively reclaimed. The reversal has earned respect; the breakout has not yet been proven.
None of that makes silver a chase at the shelf. The cleaner expression of a real reclaim is to let the first pullback into former resistance, now would-be support, do the work. The sticky oil premium is the wildcard that cuts both ways here: a fresh Hormuz spike could revive the stagflation fear that punished the industrial leg on Monday, but it could equally reinforce the inflation-hedge bid that underpins the metal. A framework read works from what the tape is doing now, and right now the tape is constructive above $58 and testing the ceiling, which argues for buying dips toward support rather than reaching for the high.
Red flag risk. The single biggest hazard is a rejection at the shelf. Silver has run two dollars in a straight line into the $59.71 to $60.00 band it just lost, and a failure to reclaim it, especially on a renewed oil spike that reawakens the growth scare, could snap price back toward $58 and trap late longs. Do not buy into overhead supply at the day’s high; demand a pullback or a clean break and hold above $59.80 before pressing the long side.
Key levels
| Level | Price | Meaning |
|---|---|---|
| Resistance 3 | $60.80 | Measured objective above the shelf; the prize if the breakout confirms |
| Resistance 2 | $60.00 | Round number and the top of the broken shelf; a close above turns the tape bullish |
| Resistance 1 | $59.71 | Monday’s break line and the wall directly overhead; the reclaim it has to clear |
| Spot | $59.07 | Tuesday close, up 2.49 per cent, pressed against the underside of the shelf |
| Support 1 | $58.40 | First pullback pocket and the $58 handle; the preferred dip-buy zone |
| Support 2 | $57.63 | Monday close and the pivot the reversal launched from; a loss reopens the flush |
| Support 3 | $57.00 | Round number and the deeper floor if the recovery fails outright |
Three scenarios into Wednesday’s bank earnings
Bullish breakout (45 per cent). The dovish rate backdrop holds, price clears and closes above the $59.71 to $60.00 shelf, and the reclaim becomes a base for a run at $60.80. Continued softness in yields and a steady-to-firmer risk tone through the bank prints is the fuel.
Sideways consolidation (35 per cent). Silver digests a two-dollar day and chops in the $58.40 to $59.71 band under the shelf, working off the sharp move before it resolves. Patience beats prediction; buy the lower edge, do not chase the middle.
Bearish rejection (20 per cent). The shelf rejects price, a renewed oil spike revives the growth scare, and silver slips back through $58 toward the $57.63 pivot. Lower probability given the breadth of the reversal, but the tail every fresh long must respect at overhead resistance.
Risk score
Overall setup risk sits at roughly 58 per cent, a moderate read now that the inflation event has cleared without a shock. The breakdown: the directional structure favours the bullish lean and the reversal is broad and confirmed, which works around 30 per cent in the trade’s favour, but price sitting directly beneath a fresh layer of overhead supply lifts the risk, and the still-bid Hormuz oil premium is a live wildcard that can whip the industrial leg either way overnight. Wednesday’s continued bank earnings add a background event premium. Position size belongs at the middle tier; this is a constructive reclaim, not yet a clean-air trend.
Opportunity in focus. The cleanest expression is to let the reversal breathe and buy the first pullback rather than the high. A dip into the $58.40 pocket, back onto the $58 handle that silver reclaimed today, offers a defined-risk long with Monday’s low as the natural backstop and the broken shelf as the first prize. Alternatively, a clean break and hold above $59.80 is the breakout trigger for the same destination from the other side.
How to walk it
Preferred setup (bullish, buy the pullback). Buy a dip into the $58.40 pocket, entry taken near $58.45. Stop below Monday’s pivot at $57.55, which sits under the reversal base. First target $59.71 at the shelf, second target $60.80 above it. Risk on the trade is roughly 1.5 per cent from entry to stop, and the second target offers close to a two-and-a-half to one payoff.
Breakout alternative. If price does not pull back, wait for a decisive close and hold above $59.80, then enter on the retest with a stop back under $59.20. Same $60.80 objective, tighter risk, but only on a confirmed reclaim, never on the first tag of the shelf.
Invalidation. A decisive close back below $58.00 weakens the bullish read; a loss of $57.63 voids it and reopens the Monday flush toward $57.00. Do not average a long that has lost the pivot it launched from.
Sizing. Middle tier into the recovery. Keep the oil premium in view, because a fresh Hormuz spike is the fastest way to turn the industrial leg against a metals long overnight. No position should carry without a hard stop.
Verdict. Constructive above $58 after a broad, confirmed reversal reclaimed the whole oil-shock flush, but respect the $59.71 to $60.00 shelf directly overhead and buy the pullback rather than chasing the high.
Continue reading
- Raw Materials Radar: why cool inflation lifted the whole metals complex together
- Macro Pulse: the dovish inflation print, falling real yields and the debasement bid
- FX Focus: the dollar, yields and what softer rates do for the precious metals
- Daily Framework Read: Gold (XAU/USD) reclaims $4,000 as the haven trade steadies
Educational market analysis, not financial advice. Levels and scenarios are a framework for your own research, not a recommendation to trade. Markets carry risk; size accordingly.
Monday 13 Jul 2026
Silver (XAG/USD) Snaps 3.1% Lower to $57.96 as the Oil Shock Flushes the Metals Complex: Daily Read 13 July 2026
Silver (XAG/USD) | Daily Framework Read | Monday 13 July 2026 (US close)
Silver (XAG/USD) closed the Monday session at $57.96, down 3.09 per cent on the day and sitting just above its low of $57.60. The metal opened at $59.71, tried the $59.80 shelf, then rolled over hard as a Hormuz driven oil spike sent crude up more than 9 per cent and forced a broad de risking into the CPI window. Gold (XAU/USD) fell too, but only 2.39 per cent, so silver once again wore its higher beta on the way down and the gold to silver ratio widened. Into a Tuesday stacked with the inflation print, Fed Chair testimony and the first big bank earnings, the near term bias here is cautious to bearish while price holds below the $59.71 open, with the weak close arguing for a continuation test of the $57 handle before buyers get a clean look.
Framework thesis. A stagflation flavoured oil shock is a two edged sword for silver. The monetary side of the metal wants the safe haven bid, but the industrial side takes the growth scare on the chin, and on a single session flush the industrial leg and the leveraged long liquidation win. Silver fell faster than gold, closed on its lows and lost the $59 shelf. That is a bearish tape, not a dip to reflexively buy. The read is to respect the break, fade strength rather than chase weakness, and let Tuesday’s inflation number decide whether $57 becomes a floor or a trapdoor.
Where it sits today
Silver (XAG/USD) settled at $57.96, a fall of 3.09 per cent or roughly $1.85 from the prior close of $59.81. The day ran from a high of $59.80 down to a low of $57.60, and the close landed only a few cents off that low, which tells you sellers kept the upper hand into the bell. The metal gapped nothing on the open at $59.71, probed the overnight highs, then unwound the entire range and more in one directional slide.
The context is the whole story. Crude jumped more than 9 per cent to around $78 on Hormuz supply risk, the fear gauge snapped up around 14 per cent to the low 17s after weeks of complacency, and index tech shed roughly 2 per cent into the inflation eve. Gold (XAU/USD) dropped 2.39 per cent to $4,006. When precious metals fall together on a day the fear gauge is rising, the tell is a positioning flush rather than a genuine safe haven rotation, and silver, with its industrial demand leg, is always the one that gets marked down hardest.
What the framework reads
Three things stand out. First, structure has broken. Losing the $59 shelf and closing beneath it on an expansion range shifts the short term control to sellers, and a close on the lows rarely marks the end of a move on its own. Second, the relative weakness against gold matters. On a classic haven day silver would keep pace or lead; instead it lagged badly, which is the signature of the industrial and leveraged long legs being unwound rather than fresh haven money arriving. Third, the volatility backdrop has changed character. The fear gauge waking up removes the sleepy grind that had been supporting metals and hands the tape back to sharp two way swings, the kind that punish complacent longs.
None of that makes silver a structural short. The bigger monetary backdrop, real rate sensitivity and the crude driven inflation impulse can all reassert a bid quickly, especially if Tuesday’s print reads hot in a way that revives the debasement trade. But a framework read works from what the tape is doing now, and right now the tape is bearish beneath $59.71. The disciplined stance is to treat rallies into broken support as opportunities to lean short, and to demand a reclaim of the $59.71 open before entertaining the long side again.
Red flag risk. The single biggest hazard is a hot inflation print that flips silver from a growth scare victim into a debasement winner overnight. A sharp reclaim of $59.71 and a push back above $60 would invalidate the bearish read entirely and trap anyone short into the day’s high. Never carry a metals short across the Tuesday number without a hard stop above the shelf.
Key levels
| Level | Price | Meaning |
|---|---|---|
| Resistance 3 | $60.00 | Round number and bull line in the sand; a close above it kills the bearish read |
| Resistance 2 | $59.80 | Session high and prior close; the shelf sellers defended |
| Resistance 1 | $59.71 | Day’s open and the break line; bias stays bearish below it |
| Spot | $57.96 | Monday close, down 3.09 per cent, sitting just above the low |
| Support 1 | $57.60 | Session low; first line, a break opens the $57 handle |
| Support 2 | $57.00 | Round number magnet and first downside target |
| Support 3 | $55.80 | Deeper measured objective if the flush extends |
Three scenarios into the Tuesday inflation print
Bearish continuation (50 per cent). Price fails to reclaim $59.71, sellers press the $57.60 low, and a break there flushes into the $57 handle and on toward $55.80. A firm or hot print that keeps rate expectations high without reviving the debasement bid is the fuel.
Sideways repair (30 per cent). The metal bases in the $57.60 to $59.00 band, chopping either side of the break line as the market waits for the number. No edge until it resolves; stand aside.
Bullish reclaim (20 per cent). A hot print flips silver into the debasement trade, price reclaims $59.71, clears $60 and the short term break is a bear trap. Lower probability given the weak close, but the fat tail every metals short must respect.
Risk score
Overall setup risk sits at roughly 70 per cent, a high risk read driven by the event calendar rather than the technical picture. The breakdown: directional structure favours the bearish lean and is worth around 30 per cent of the score in the trade’s favour, but the Tuesday inflation print, Fed Chair testimony and bank earnings stack event risk that lifts the total sharply, and the fear gauge waking up around 14 per cent adds a volatility premium that widens intraday swings. Position size belongs at the lower tier here; this is an event window, not a trend day.
Opportunity in focus. The cleanest expression is patience, not chasing. A rally that fails into the $58.80 to $59.20 pocket, back under the broken $59.71 open, offers a defined risk short with the day’s high as a natural stop and the $57 handle as the first prize. Let strength come to you rather than selling the low.
How to walk it
Preferred setup (bearish, fade strength). Sell a failed retest into the $58.80 to $59.20 pocket, entry taken near $59.00. Stop above the shelf at $60.15, which sits over both the prior close and the round number. First target $57.00, second target $55.80. Risk on the trade is roughly 2.0 per cent from entry to stop, and the first target alone offers close to a two to one payoff, the second closer to three to one.
Invalidation. A decisive close back above $59.71 voids the bearish read; a push through $60.00 flips the short term structure and the correct response is to stand aside or wait for the long side to prove itself, not to fight the reclaim.
Sizing. Lower tier only into the inflation number. If you are not short before Tuesday’s print, do not initiate into it; let the release resolve and trade the reaction with the levels above as your map. No metals position should cross the number without a hard stop.
Verdict. Bearish below $59.71 with a weak close pointing at the $57 handle, but keep the stop tight over $60 because one hot inflation print can turn this flush into a bear trap overnight.
Continue reading
- Raw Materials Radar: why the oil shock split gold and silver on the same day
- Macro Pulse: reading the fear gauge waking up into the inflation window
- FX Focus: the dollar, real rates and what a hot print does to the metals bid
- Daily Framework Read: Gold (XAU/USD) holds $4,000 as the haven trade wobbles
Educational market analysis, not financial advice. Levels and scenarios are a framework for your own research, not a recommendation to trade. Markets carry risk; size accordingly.
Sunday 12 Jul 2026
Crude Oil (WTI) — Daily Framework Read | Saturday 11 July 2026
Crude Oil (WTI) | Post Close Setup Framework Read | Data basis: 2026-07-11 close
Where It Sits
Structure
Structurally Crude Oil (WTI) has pulled back into the session close. The broader trend remains intact on the daily timeframe but the shorter timeframe has softened. The structure is contested near the 71.5400 level.
Momentum
Momentum is positive but measured. The advance has been orderly without stretching the range. Internal readings are constructive without flagging exhaustion — supportive of continuation.
Volume & Flow
Flow on the session close was measured. Positioning data suggests steady accumulation rather than aggressive directional commitment. The pattern supports continuation rather than reversal.
Key Levels
| Level | Type | Significance | Action Zone |
|---|---|---|---|
| 75.10 | Resistance | Upper range target, prior supply zone | Take profits / fade if rejected |
| 72.70 | Pivot | Mid-range continuation marker | Hold = constructive; lose = consolidation |
| 71.54 | Session close | Reference anchor for next session | Above = continuation; below = mean revert |
| 69.60 | Support | Recent range floor, demand zone | Buy zone with defined stop |
| 67.20 | Major support | Prior breakout retest level | Stop-out below for longs |
Three Scenarios
Continuation
Crude Oil (WTI) holds 71.5400 and extends higher on supply tightness or safe-haven demand. The structural trend supports continuation. Watch for follow-through above the pivot.
Range
Crude Oil (WTI) opens flat and churns around 71.5400. Digesting the recent move. Range trade with the trend as a tailwind.
Mean Reversion
Crude Oil (WTI) fades on dollar strength or demand concern, breaks below support. Mean reversion within the broader uptrend.
Risk Score
Risk sits at Around 50%
Risk sits around 50 per cent. Vix at 15.0 supports a measured risk posture. sentiment at 50 is neutral. Commodities carry supply-demand headline sensitivity. Standard sizing with defined stops — discipline beats conviction.
How to Walk It
Entry / Stop / Target structure:
- Long 69.60 pullback | Stop 67.20 | Target 72.70 | R:R 2:1
- Long 72.70 breakout | Stop 71.54 | Target 75.10 | R:R 1.5:1
- Fade 75.10 rejection | Stop above resistance | Target 71.54 | R:R 2:1
Experience-level guidance:
Beginner: Reduce size to half your standard. Trade only the cleanest setup from the entries above. If the tape opens against your bias, do nothing — wait for the second hour, when the institutional flow has tipped its hand.
Intermediate: Use the levels table to define the trading range. Fade the extremes with defined stops, take profits before the round-number resistance levels.
Advanced: The vol regime supports defined-risk structures around the key pivot levels. Keep notional small relative to your book — asymmetric speculation, not core positioning.
Continue Reading
The macro frame driving this read is unpacked in the session briefs:
Check the latest session briefs on the site.
This analysis is for educational and informational purposes only. It does not constitute financial advice. Always manage your risk independently and in accordance with your own financial circumstances.
Friday 10 Jul 2026
Crude Oil (WTI) — Daily Framework Read | Friday 10 July 2026
Crude Oil (WTI) | Post Close Setup Framework Read | Data basis: 2026-07-10 close
Where It Sits
Structure
Structurally Crude Oil (WTI) has pulled back into the session close. The broader trend remains intact on the daily timeframe but the shorter timeframe has softened. The structure is contested near the 71.5400 level.
Momentum
Momentum is positive but measured. The advance has been orderly without stretching the range. Internal readings are constructive without flagging exhaustion — supportive of continuation.
Volume & Flow
Flow on the session close was measured. Positioning data suggests steady accumulation rather than aggressive directional commitment. The pattern supports continuation rather than reversal.
Key Levels
| Level | Type | Significance | Action Zone |
|---|---|---|---|
| 75.10 | Resistance | Upper range target, prior supply zone | Take profits / fade if rejected |
| 72.70 | Pivot | Mid-range continuation marker | Hold = constructive; lose = consolidation |
| 71.54 | Session close | Reference anchor for next session | Above = continuation; below = mean revert |
| 69.60 | Support | Recent range floor, demand zone | Buy zone with defined stop |
| 67.20 | Major support | Prior breakout retest level | Stop-out below for longs |
Three Scenarios
Continuation
Crude Oil (WTI) holds 71.5400 and extends higher on supply tightness or safe-haven demand. The structural trend supports continuation. Watch for follow-through above the pivot.
Range
Crude Oil (WTI) opens flat and churns around 71.5400. Digesting the recent move. Range trade with the trend as a tailwind.
Mean Reversion
Crude Oil (WTI) fades on dollar strength or demand concern, breaks below support. Mean reversion within the broader uptrend.
Risk Score
Risk sits at Around 50%
Risk sits around 50 per cent. Vix at 15.0 supports a measured risk posture. sentiment at 50 is neutral. Commodities carry supply-demand headline sensitivity. Standard sizing with defined stops — discipline beats conviction.
How to Walk It
Entry / Stop / Target structure:
- Long 69.60 pullback | Stop 67.20 | Target 72.70 | R:R 2:1
- Long 72.70 breakout | Stop 71.54 | Target 75.10 | R:R 1.5:1
- Fade 75.10 rejection | Stop above resistance | Target 71.54 | R:R 2:1
Experience-level guidance:
Beginner: Reduce size to half your standard. Trade only the cleanest setup from the entries above. If the tape opens against your bias, do nothing — wait for the second hour, when the institutional flow has tipped its hand.
Intermediate: Use the levels table to define the trading range. Fade the extremes with defined stops, take profits before the round-number resistance levels.
Advanced: The vol regime supports defined-risk structures around the key pivot levels. Keep notional small relative to your book — asymmetric speculation, not core positioning.
Continue Reading
The macro frame driving this read is unpacked in the session briefs:
Check the latest session briefs on the site.
This analysis is for educational and informational purposes only. It does not constitute financial advice. Always manage your risk independently and in accordance with your own financial circumstances.
Thursday 9 Jul 2026
Silver (XAG/USD) — Daily Framework Read | Thursday 9 July 2026
Silver (XAG/USD) | Post Close Setup Framework Read | Data basis: 2026-07-09 close
Where It Sits
Structure
Structurally Silver (XAG/USD) sits above its short-term moving averages with the daily trend firmly higher. The recent advance has been orderly with no signs of distribution or topping behaviour. The reference anchor at 60.3550 acts as the bias line.
Momentum
Momentum is firm with the daily timeframe showing clear acceleration. Internal readings sit in the upper portion of the range. The risk is not that momentum fails but that it stalls at round-number resistance and triggers profit-taking.
Volume & Flow
Flow on the session close was measured. Positioning data suggests steady accumulation rather than aggressive directional commitment. The pattern supports continuation rather than reversal.
Key Levels
| Level | Type | Significance | Action Zone |
|---|---|---|---|
| 65.00 | Resistance | Upper range target, prior supply zone | Take profits / fade if rejected |
| 61.90 | Pivot | Mid-range continuation marker | Hold = constructive; lose = consolidation |
| 60.35 | Session close | Reference anchor for next session | Above = continuation; below = mean revert |
| 57.90 | Support | Recent range floor, demand zone | Buy zone with defined stop |
| 54.80 | Major support | Prior breakout retest level | Stop-out below for longs |
Three Scenarios
Continuation
Silver (XAG/USD) holds 60.3550 and extends higher on supply tightness or safe-haven demand. The structural trend supports continuation. Watch for follow-through above the pivot.
Range
Silver (XAG/USD) opens flat and churns around 60.3550. Digesting the recent move. Range trade with the trend as a tailwind.
Mean Reversion
Silver (XAG/USD) fades on dollar strength or demand concern, breaks below support. Mean reversion within the broader uptrend.
Risk Score
Risk sits at Around 50%
Risk sits around 50 per cent. Vix at 15.8 supports a measured risk posture. sentiment at 47 is neutral. Commodities carry supply-demand headline sensitivity. Standard sizing with defined stops — discipline beats conviction.
How to Walk It
Entry / Stop / Target structure:
- Long 57.90 pullback | Stop 54.80 | Target 61.90 | R:R 2:1
- Long 61.90 breakout | Stop 60.35 | Target 65.00 | R:R 1.5:1
- Fade 65.00 rejection | Stop above resistance | Target 60.35 | R:R 2:1
Experience-level guidance:
Beginner: Reduce size to half your standard. Trade only the cleanest setup from the entries above. If the tape opens against your bias, do nothing — wait for the second hour, when the institutional flow has tipped its hand.
Intermediate: Use the levels table to define the trading range. Fade the extremes with defined stops, take profits before the round-number resistance levels.
Advanced: The vol regime supports defined-risk structures around the key pivot levels. Keep notional small relative to your book — asymmetric speculation, not core positioning.
Continue Reading
The macro frame driving this read is unpacked in the session briefs:
Check the latest session briefs on the site.
This analysis is for educational and informational purposes only. It does not constitute financial advice. Always manage your risk independently and in accordance with your own financial circumstances.
Wednesday 8 Jul 2026
Silver (XAG/USD) Holds $59.81 as Rotation Day Drags Gold Lower and Crude Rips 5.3%
Silver (XAG/USD) | Daily Framework Read | US close, Tuesday 7 July 2026
What matters most about tonight’s session is the divergence inside the precious-metals complex itself. Gold behaved exactly as a haven should when growth-sensitive capital rotates into cyclicals: it softened as investors decided the crude rally and the broader risk backdrop meant less need for defensive positioning. Silver, by contrast, sits at the intersection of two competing identities. Half of its demand profile behaves like gold, tracking real yields and haven flows. The other half behaves like an industrial commodity, tracking manufacturing activity, solar and electronics demand, and, indirectly, energy costs. When crude jumps 5.3% in a single session, that second identity gets a genuine tailwind even while the first identity is under pressure. Tonight’s price action, a close essentially flat on the pivot at 59.81 rather than a clean break in either direction, is the market telling you that neither identity has won the argument yet.
Where It Sits
Tuesday was a rotation day plain and simple. Crude jumped 5.32% to 72.20, the Nasdaq 100 fell 1.77% as growth names lost their bid, and the dollar firmed with USD/JPY at 162.15. Fear & Greed improved to 43 and the regime read as neutral. None of that is the signature of a risk-off flush; it is capital moving out of duration-sensitive tech and into energy, with gold catching some of the outflow and silver only partially following.
Key Levels
| Level | Type | Why It Matters | Action |
|---|---|---|---|
| 60.85 | Resistance | Prior swing supply zone where sellers stepped in on the last approach; a reclaim needs gold to stabilise first | Fade first tag unless crude strength spills further into metals sentiment |
| 59.80 | Pivot | Sits right on tonight’s close, the line between a rotation-day pause and a genuine breakdown attempt | Wait for a clean session close either side before committing direction |
| 58.60 | Support | Where dip-buyers have defended in prior pullbacks; a break opens room to the next demand shelf | Accumulate on a controlled retest, avoid chasing a fast spike through it |
Bias
Neutral, leaning cautious. Gold weakness argues for further downside in silver, while the industrial-demand tailwind from crude’s 5.3% rally argues any sell-off should stay shallow. Until one force clearly dominates, this reads as a range to work rather than a trend to chase.
Multi-Strategy Breakdown
- Scalp: Fade the 60.85 resistance zone for quick mean-reversion trades while momentum stays choppy, and cut fast if crude’s strength keeps bleeding into industrial metals. Tight stops are non-negotiable here since a rotation day can reverse its own logic within a single session.
- Intraday: Play the 58.60 to 60.85 range with confirmation at each edge; a rotation day like this rewards patience over conviction. Wait for the first hour of Wednesday’s session to show whether crude’s strength is carrying through before committing to either boundary.
- Swing: Stay light or on the sidelines until gold finds a firmer floor; silver’s swing direction is still hostage to the broader metals complex. A swing position taken now is effectively a bet on which half of silver’s demand identity, haven or industrial, wins over the coming week, and that bet is not yet worth making with conviction.
Risk Score
Risk sits at Around 45% heading into Wednesday.
The dominant factor is the tug-of-war between haven selling in gold and industrial demand strength from the crude rally. A decisive move in either direction tomorrow could resolve this range abruptly, so defined stops matter more than usual. The secondary factor worth watching is the dollar. USD/JPY firming to 162.15 on the same session is a headwind that compounds on top of gold’s softness rather than offsetting it, since silver is priced in dollars just like gold. If the dollar keeps strengthening into Wednesday while crude cools off even slightly, the industrial-demand offset weakens and the balance of risk tilts toward the downside scenario below rather than the upside one. Traders should treat tonight’s calm VIX reading as permission to size normally, not as a signal that the range is guaranteed to hold.
Three Scenarios Into Wednesday
Range Hold
Silver chops between 58.60 and 60.85 as gold and crude effectively cancel each other out. The most likely outcome given a calm VIX and an improving Fear & Greed reading.
Break Lower
Gold weakness deepens and drags silver through 58.60 if the rotation out of havens and into energy extends into Wednesday’s session.
Break Higher
Continued crude strength feeds industrial demand optimism, lifting silver through 60.85 even as gold itself stays soft.
Position Sizing
STANDARD applies. A neutral regime, calm volatility and a well-defined range support normal sizing. MAX is not warranted while gold and the industrial-demand story pull in opposite directions. REDUCED becomes appropriate only if price closes decisively through either the resistance or support level without follow-through confirmation. AVOID would apply only if crude or gold produces a violent reversal overnight that invalidates both levels at once.
This is analysis, not financial advice. Always manage your risk.
Friday 3 Jul 2026
Silver (XAG/USD) – Daily Read
July 2, 2026 | Commodity | Titan Macro Desk
$80.34
Chart-based read for Silver (XAG/USD). Framework review data pending for this instrument. Price action and key levels shown on the chart below.

Framework Metrics
This read is generated by the Titan framework and reflects our multi-factor analytical model. It is not financial advice. Past performance is not indicative of future results. Always conduct your own research before making investment decisions.
Thursday 2 Jul 2026
Silver (XAG/USD) – Daily Read
July 2, 2026 | Commodity | Titan Macro Desk
$80.34
Chart-based read for Silver (XAG/USD). Framework review data pending for this instrument. Price action and key levels shown on the chart below.
Framework Metrics
This read is generated by the Titan framework and reflects our multi-factor analytical model. It is not financial advice. Past performance is not indicative of future results. Always conduct your own research before making investment decisions.


