Post 02 · Sentiment Analysis · Data locked 13 May 2026
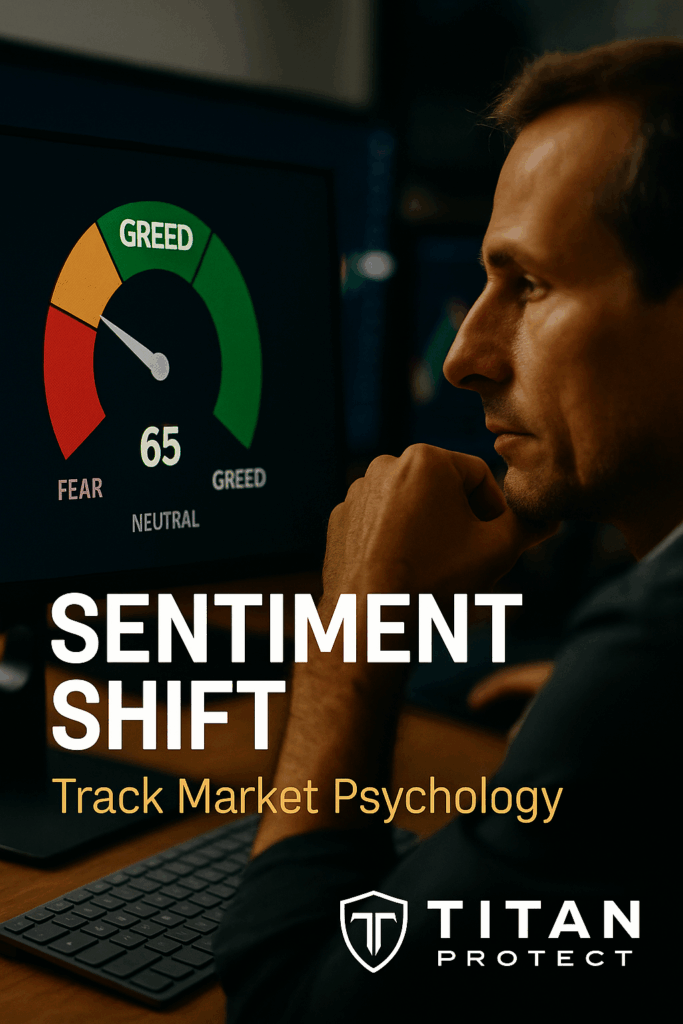
The CNN Fear & Greed index sits at 66.4 — firmly in Greed territory. VIX fell 2.12% on the day a three-year high CPI printed. Retail investors, as surveyed by AAII, are only cautiously bullish at 38.3%. On paper, the crowd is comfortable. What this morning’s positioning and macro reads showed is that the crowd is comfortable about the wrong things. Institutional asset managers are running the largest equity long book in recent data while simultaneously watching a cost-push inflation regime take hold. The divergence between how sentiment is reading the room and what the hard data is actually showing is the setup most retail traders will not see until it is too late to act on.
The VIX Tells You What the Crowd Believes. It Does Not Tell You If They Are Right.
VIX closed at 17.99, down 2.12% on the same day that April CPI printed 3.8% — a three-year high. Volatility compressing on a regime-level inflation number is one of two things: either the market genuinely believes the number is noise and the Fed has it under control, or the crowd has become desensitised to inflation headlines and stopped pricing tail risk properly. The macro analysis this morning gave you the checklist to distinguish between those two explanations. Five of six macro signals pointed at stagflation, not a clean overheating economy that the Fed can manage with a couple of hikes. If the crowd is reading this as noise, they are misreading the macro.
The five-day VIX average of 18.26 compared to today’s close of 17.99 shows that vol has been leaking lower all week. This is not a spike-and-fade pattern from a single CPI shock. It is a gradual compression that reflects either genuine confidence or genuine inattention. The history of late-cycle stagflation regimes suggests it is more often the latter. VIX compresses until it cannot — and then it moves fast. The 2018 and 2022 vol events both featured prolonged compressions ahead of the break.
Table 1 — VIX Behaviour: What It Should Show vs What It Is Showing (13 May 2026)
| Condition | Typical VIX Behaviour | Actual Reading | What It Means |
|---|---|---|---|
| 3-year high CPI print | Spike 20–24 | 17.99 (falling) | Crowd not pricing inflation risk |
| Fed hike odds rising to 31% | Range-bound 18–22 | 17.99 (below range) | Complacency at policy inflection |
| Gold +0.69%, Copper +2.34% | Vol bid on stagflation fear | 17.99 (declining) | Hard assets pricing what vol is ignoring |
| Russell 2000 -0.97% | Growth-fear adds vol premium | 17.99 (compressed) | Small-cap growth signal ignored by crowd |
| VIX 5-day average | 18.26 | Below avg (17.99) | Week-long drift lower into event risk |
| Threshold for concern | VIX above 22 | 4+ points below | Crowd has significant cushion before panic pricing kicks in |
The VIX compression does not mean the market is safe. It means the crowd has not yet been forced to reprice. There is a meaningful difference. Crude oil slipping 1.51% to $100.64 on the same day commodities like copper and gold ran higher is another layer of the same story: energy markets are absorbing some demand-slowdown pricing while hard assets absorb the inflation debasement trade. The crowd is watching the surface equity print (SPY -0.15%) and calling it calm. The VIX at 17.99 is their permission structure for that complacency.
Fear & Greed at 66.4: What Is Driving It and Why It Is the Wrong Reading
A Fear & Greed score of 66.4 in a 3.8% CPI environment is not inherently wrong. Greed scores above 60 are sustainable in genuine bull markets with supportive fundamentals. What matters is whether the seven underlying components of the index are each individually consistent with current macro reality — or whether some are being artificially supported by momentum while the macro foundations underneath are shifting.
The options data from this morning’s positioning read provides the clearest inside look at what is driving sentiment at this level. The put/call ratio at 0.807 is contributing to the greed score by showing calls dominating. But the composition of that call buying is not uniformly bullish: AAPL, NVDA, TSLA, META, and MSFT are the top bullish options names while QQQ is the top bearish name. The crowd is buying stock-specific exposure and hedging the index. That is not maximum greed. That is defensive greed — and the difference matters for what comes next.
The macro read this morning showed the NASDAQ-100 down 0.87% while the Dow held positive by 0.11%. Duration-sensitive growth selling while defensive value holds is a rotation, not a broad rally. A Fear & Greed index sitting at 66.4 during a rotation from growth to value is telling you the crowd is slow to recognise the character of what is happening underneath them. They see the headline indices as flat-to-down slightly and interpret it as stability. The composition of that move — defensive strength masking growth weakness — is where the real information lives.
Table 2 — Fear & Greed Anatomy: Component Assessment vs Macro Context (13 May 2026)
| F&G Component | Sentiment Implication | Macro Reality Check | Reliability |
|---|---|---|---|
| Market Momentum (SPY vs MA) | Bullish | SPY -0.15%. At-close near max pain $735 | MODERATE |
| Stock Price Breadth | Mixed | Dow +0.11%, NQ -0.87%, IWM -0.97% | LOW |
| Put/Call Ratio (0.807) | Bullish lean | Single-name calls; QQQ index hedged | MODERATE |
| VIX Level (17.99) | Greed (low fear) | Below 5-day avg; CPI complacency | LOW |
| Safe Haven Demand | Neutral | Gold +0.69%, Silver +2.5%; debasement hedge, not fear | MODERATE |
| Junk Bond Demand | Greed (spread tight) | Credit not yet repriced for stagflation tail risk | LOW |
| Market Volatility vs Trend | Greed | VIX falling on regime-level CPI = anomaly | LOW |
Three of the seven components are grading as low reliability against the current macro backdrop. Two are moderate. Only one — market momentum — has some genuine grounding in current price action. The analysis score of 66.4 is technically accurate, but its components are not in agreement with the macro read from this morning. That internal incoherence is the warning sign.
What Retail Investors Are Feeling vs What Institutions Are Doing
The AAII weekly survey for the week ending 5 May 2026 puts retail investors at 38.3% bullish, 28.7% neutral, and 33.0% bearish. That is a modest net bullish lean of 5.3 percentage points — historically low conviction and well below the kind of froth you see at major market tops. Retail sentiment, in isolation, is not at a danger level.
The danger is not in the retail number by itself. It is in how retail sentiment maps to institutional positioning. This morning’s positioning read showed that asset managers are running a net long of over 1.01 million S&P 500 futures contracts. That is not a cautious position. That is a maximum structural long. Retail at 38.3% bullish combined with institutional at maximum equity exposure produces a specific risk dynamic: if institutions need to reduce, there is not enough new retail buying coming in to absorb the supply. The AAII data three weeks ago showed retail at 52% bearish. The last three weeks of easing pessimism have not rebuilt retail conviction to a level where it would cushion institutional selling. The gap between peak retail fear and peak institutional positioning is not being filled from the retail side.
The AAII bearish reading of 33.0% is also meaningful in context. Pessimism eased from 52% in mid-March to 33% now. That is not a market where the average retail participant is rushing in to buy. It is a market where the average retail participant has stopped actively fearing. Neutral positioning at 28.7% is elevated — nearly three in ten retail respondents have no directional view. That pool of neutral retail money does not protect markets during an institutional unwind. It joins the selling.
Table 3 — Sentiment Stack: Retail Reads vs Institutional Positioning (13 May 2026)
| Layer | Reading | Direction | The Risk Hidden Inside It |
|---|---|---|---|
| Fear & Greed Index | 66.4 | Greed | 3 of 7 components unreliable vs macro regime |
| AAII Bull % | 38.3% | Modest bullish | Not enough retail buying to cushion institutional selling |
| AAII Bear % | 33.0% | Down from 52% peak (Mar) | Pessimism easing but conviction absent |
| AAII Neutral % | 28.7% | Elevated | Undecided money joins selling when institutions move |
| Asset Mgr Equity Net (COT) | +1,010,442 ES contracts | Maximum long | Pre-CPI book; largest structural long in current data |
| Leveraged Fund Equity Net (COT) | -396,821 ES contracts | Short equities | CPI complicates their cover decision; chop until resolved |
| SPX Whale Options (12 May) | 29,249 contracts | Institutional | Large CPI-day print; accumulation or distribution unresolved |
| SPY Max Pain (13 May expiry) | $735.00 | Below market | $738.18 open — mild gravitational pull into close |
The Three-Layer Divergence: F&G Says Greed, Positioning Says Exposed, Macro Says Stagflation
When three separate reads of market condition point in different directions, the disagreement is the information. Fear & Greed at 66.4 says the crowd is comfortable. The institutional positioning data from this morning says the market is running maximum structural longs built on a pre-CPI rate path assumption that no longer holds. The macro picture from this morning says the DXY should have rallied on 3.8% CPI and did not — sitting flat at 98.31 — gold should have sold and instead rose to $4,710, and the yield curve is signalling that the Fed cannot hike as far as the inflation data demands.
These three layers tell three different parts of the same story. Retail sentiment (F&G, AAII) is the emotional read — it reflects where the average participant has recently been hurt or rewarded and projects that forward. It is the laggiest of the three. Institutional positioning is the structural read — where large capital is actually committed, built over weeks or months, and slow to reverse. Macro regime is the foundational read — the economic conditions that will eventually force both retail and institutional players to reprice. Macro leads, positioning responds, sentiment follows. Right now, macro has moved. Positioning has not yet responded at scale. Sentiment is still in the old regime.
Bitcoin at $81,179: The Crowd’s Inflation Hedge or the Next Vol Event?
Bitcoin at $81,179 on a 3.8% CPI day is a sentiment litmus test. The positioning data from this morning showed leveraged funds net short BTC at -11,835 contracts while asset managers and dealers are both net long. The crowd’s view of Bitcoin is bifurcated: one camp holds it as a hard-money inflation hedge (consistent with gold at $4,710 and silver up 2.5%), and the other camp trades it as a risk asset that will sell off alongside equities when the Fed is forced to act.
The macro picture this morning identified this as the central Bitcoin question for this cycle: does it behave as digital gold or as a high-beta risk asset in this environment? The sentiment read adds a layer. BTC holding at $81,179 rather than selling off tells you the crowd is betting on the inflation-hedge interpretation. The institutional short position of -11,835 leveraged fund contracts is betting the other way. The asset manager long of +6,187 contracts and the dealer long of +4,523 contracts align with the crowd on the inflation-hedge side. That makes the lev fund short the isolated dissenter — and if the next CPI confirms embeddedness, that position becomes painful.
Table 4 — Bitcoin: Crowd Sentiment vs Institutional Positioning (13 May 2026)
| Factor | Crowd (Sentiment) | Institutions (COT) | Verdict |
|---|---|---|---|
| BTC narrative on hot CPI | Inflation hedge — hold | Lev funds short; mgrs + dealers long | SPLIT |
| BTC price (12 May close) | $81,179 (-0.02%) | Flat — no capitulation either way | NEUTRAL |
| Asset Mgr BTC net (COT) | — | +6,187 contracts | STRUCTURAL LONG |
| Lev Fund BTC net (COT) | — | -11,835 contracts | SHORT SQUEEZE RISK |
| If BTC holds as gold analog | Crowd wins; lev funds cover | Short squeeze accelerates BTC higher | BULLISH BTC |
| If BTC sells with equities | Crowd wrong; lev funds win | Liquidity pressure overrides inflation hedge | BEARISH BTC |
Sentiment Scenarios: Three Paths for How the Gap Closes
The macro read from this morning identified three regime paths — transitory echo, embedded stagflation, and forced hike with growth shock. Each produces a different sentiment trajectory. The question for Wednesday is not which path is correct. It is how quickly the sentiment gap closes in each case, and whether traders positioned for greed are prepared for how fast that can reverse.
April CPI proves to be a one-month spike. May data reverts toward 3.2–3.4%. Hike odds fall back below 20%. VIX stays anchored below 18. F&G drifts higher toward 70–72. The asset manager equity long book at +1.01 million ES contracts holds without forced reduction. Leveraged fund equity shorts feel the squeeze and cover. AAII bulls move from 38% toward 45%. The current greed reading is vindicated and the divergence identified in this morning’s positioning and macro reads resolves without pain. Risk to those long and leveraged into this scenario if it does not materialise: around 40%.
Inflation stays sticky at 3.5–4.0% through Q2 2026. Hike odds grind toward 40% but the Fed pauses due to growth concerns — the embedded stagflation base case from this morning. F&G declines from 66 toward 45–50 over four to six weeks as the NQ underperformance versus the Dow becomes a sustained narrative. AAII bears creep back from 33% toward 40%. VIX re-anchors above 19–20. The institutional equity long book at +1.01 million contracts reduces gradually. The dark pool activity on SPY on 12 May — 100 orders on a CPI reaction day — either proves to be distribution being staged across multiple sessions or confirms accumulation ahead of a failed breakdown. This is the slow grind. No crash, but persistent sentiment erosion. Risk to growth-heavy positions: around 55%.
A second macro shock forces the sentiment gap to close abruptly. May CPI prints 4.0% or higher. Or the JPY carry unwind identified in this morning’s positioning read triggers — USDJPY breaking below 155, forcing the leveraged fund short JPY position of -61,340 contracts to unwind rapidly and simultaneously taking down correlated risk assets. F&G moves from 66 to below 30 in two to three weeks. That is the fastest this spread travels historically. AAII bears spike back above 50%. VIX reclaims 22 and moves toward 28. The asset manager bond long at +433,537 contracts becomes the most urgent unwind in the market alongside the equity book. Risk to portfolios not carrying any defensive positioning into this scenario: around 65–70%.
What Wednesday’s Sentiment Picture Actually Means
The Fear & Greed score of 66.4 is a lagging read. It reflects the last two to three weeks of price action — a period during which the market has been digesting the initial CPI reaction from a position of partial denial. It does not reflect the full weight of what this morning’s positioning and macro reads revealed. Institutions were positioned for a different world before Tuesday’s number. The macro regime has begun to shift around them. Sentiment will follow.
Three practical observations. First, F&G at 66 is not a standalone short signal. Markets can sustain elevated sentiment for weeks before the fundamental divergence forces a reset. The complacency in VIX at 17.99 will not break until a second data catalyst arrives or institutional selling shows up visibly in price. Second, the max pain level of $735 on today’s SPY expiry creates a near-term gravitational pull. SPY at $738.18 is $3 above pain. That context shapes Wednesday’s intraday behaviour more than macro narratives do. Third, the divergence between mega-cap single-stock call buying (AAPL, NVDA, TSLA, META, MSFT) and QQQ index puts tells you where the informed money inside the options market is actually sitting: bullish on individual names, cautious on the index. That is not a crowd saying everything is fine. That is a crowd protecting itself while keeping upside exposure open.
The macro analysis from this morning put the embedded stagflation base case at around 45% probability. If that plays out, sentiment at 66.4 is the high-water mark before the slow erosion begins. The positioning read showed where the fault lines sit structurally. Sentiment is the last to turn. It has not turned yet. That transition zone — where the macro has moved, positioning is starting to respond, and sentiment is still reading yesterday’s environment — is where Wednesday sits. The crowd is comfortable. The data is not.
Sentiment data: CNN Fear & Greed Index 13 May 2026. AAII Investor Sentiment Survey week ending 5 May 2026. VIX data: close 12 May 2026. VIX 5-day average. Options data and dark pool orders: 12–13 May 2026. COT positioning: CFTC week ending 5 May 2026. Prices at US close 12 May 2026.
This is independent market analysis for informational purposes only. It does not constitute financial advice. All trading involves risk. Sentiment indicators are retrospective and do not guarantee future price movements. You are responsible for your own trading decisions.
Deepen Your Understanding
Related articles from the Titan Protect Foundry: