The Ethereum Framework Journal for May 2026, newest read at the top. Each dated entry is our read on the close, kept as a living record so the framework can be judged over time. This is analysis, not financial advice.
Saturday 30 May 2026
Ethereum (ETH/USD) — Daily Read | Saturday 30 May 2026
Ethereum (ETH/USD) | Post Close Setup Daily Read | Data basis: 2026-05-30 close
Where It Sits
Structure
Structurally Ethereum (ETH/USD) sits above its short-term moving averages with the daily trend firmly higher. The recent advance has been orderly with no signs of distribution or topping behaviour. The reference anchor at 2,011.62 acts as the bias line.
Momentum
Momentum is neutral with internal readings near the centre of the range. That is the signature of a market digesting the prior move. The tape needs a fresh catalyst to commit to direction.
Volume & Flow
Flow on the session close was measured. Positioning data suggests steady accumulation rather than aggressive directional commitment. The pattern supports continuation rather than reversal.
Key Levels
| Level | Type | Significance | Action Zone |
|---|---|---|---|
| 2,098 | Resistance | Upper range target, prior supply zone | Take profits / fade if rejected |
| 2,040 | Pivot | Mid-range continuation marker | Hold = constructive; lose = consolidation |
| 2,012 | Session close | Reference anchor for next session | Above = continuation; below = mean revert |
| 1,966 | Support | Recent range floor, demand zone | Buy zone with defined stop |
| 1,908 | Major support | Prior breakout retest level | Stop-out below for longs |
Three Scenarios
Continuation
Ethereum (ETH/USD) holds 2,011.62 and pushes higher on continued institutional flow and positive macro mood. The 24/7 tape supports trending moves when traditional markets are risk-on.
Range
Ethereum (ETH/USD) churns around 2,011.62. Range-bound without a fresh catalyst. Weekend liquidity dynamics can create noise.
Mean Reversion
Ethereum (ETH/USD) fades on a risk-off shift or specific headline, breaks support. Crypto gives back faster than it gains — size discipline essential.
Risk Score
Risk sits at Around 65%
Risk sits around 65 per cent. Vix at 15.4 supports a measured risk posture. sentiment at 61 is in greed territory. Crypto carries 24/7 liquidity risk and higher-beta positioning. Standard sizing with defined stops — discipline beats conviction.
How to Walk It
Entry / Stop / Target structure:
- Long 1,966 pullback | Stop 1,908 | Target 2,040 | R:R 2:1
- Long 2,040 breakout | Stop 2,012 | Target 2,098 | R:R 1.5:1
- Fade 2,098 rejection | Stop above resistance | Target 2,012 | R:R 2:1
Experience-level guidance:
Beginner: Reduce size to half your standard. Trade only the cleanest setup from the entries above. If the tape opens against your bias, do nothing — wait for the second hour, when the institutional flow has tipped its hand.
Intermediate: Use the levels table to define the trading range. Fade the extremes with defined stops, take profits before the round-number resistance levels.
Advanced: The vol regime supports defined-risk structures around the key pivot levels. Keep notional small relative to your book — asymmetric speculation, not core positioning.
Continue Reading
The macro frame driving this read is unpacked in the session briefs:
Check the latest session briefs on the site.
This analysis is for educational and informational purposes only. It does not constitute financial advice. Always manage your risk independently and in accordance with your own financial circumstances.
Thursday 28 May 2026
AUD/USD — Daily Framework Read | Thursday 28 May 2026
AUD/USD | Post Close Setup Daily Read | Data basis: 2026-05-28 close
Where It Sits
Structure
Structurally AUD/USD has pulled back into the session close. The broader trend remains intact on the daily timeframe but the shorter timeframe has softened. The structure is contested near the 0.7165 level.
Momentum
Momentum is neutral with internal readings near the centre of the range. That is the signature of a market digesting the prior move. The tape needs a fresh catalyst to commit to direction.
Volume & Flow
Volume data is limited for this session. The positioning read is neutral — no obvious skew in either direction. Watch for flow confirmation on the next session.
Key Levels
| Level | Type | Significance | Action Zone |
|---|---|---|---|
| 0.7269 | Resistance | Upper range target, prior supply zone | Take profits / fade if rejected |
| 0.7199 | Pivot | Mid-range continuation marker | Hold = constructive; lose = consolidation |
| 0.7165 | Session close | Reference anchor for next session | Above = continuation; below = mean revert |
| 0.7109 | Support | Recent range floor, demand zone | Buy zone with defined stop |
| 0.7040 | Major support | Prior breakout retest level | Stop-out below for longs |
Three Scenarios
Continuation
AUD/USD holds the session close at 0.7165 and pushes lower on continued positioning flow. The broader trend remains intact. Watch the dollar tape for confirmation.
Range
AUD/USD opens flat and ranges around 0.7165. Neither side has conviction without a fresh data catalyst. Range trade dominates.
Mean Reversion
AUD/USD breaks below support on a shift in dollar positioning. Mean reversion within the broader trend. Watch for a clean test of support before committing.
Risk Score
Risk sits at Around 50%
Risk sits around 50 per cent. Vix at 15.7 supports a measured risk posture. sentiment at 60 is in greed territory. Currency pairs carry intervention and data-release headline risk. Standard sizing with defined stops — discipline beats conviction.
How to Walk It
Entry / Stop / Target structure:
- Long 0.7109 pullback | Stop 0.7040 | Target 0.7199 | R:R 2:1
- Long 0.7199 breakout | Stop 0.7165 | Target 0.7269 | R:R 1.5:1
- Fade 0.7269 rejection | Stop above resistance | Target 0.7165 | R:R 2:1
Experience-level guidance:
Beginner: Reduce size to half your standard. Trade only the cleanest setup from the entries above. If the tape opens against your bias, do nothing — wait for the second hour, when the institutional flow has tipped its hand.
Intermediate: Use the levels table to define the trading range. Fade the extremes with defined stops, take profits before the round-number resistance levels.
Advanced: The vol regime supports defined-risk structures around the key pivot levels. Keep notional small relative to your book — asymmetric speculation, not core positioning.
Continue Reading
The macro frame driving this read is unpacked in the session briefs:
Check the latest session briefs on the site.
This analysis is for educational and informational purposes only. It does not constitute financial advice. Always manage your risk independently and in accordance with your own financial circumstances.
Thursday 28 May 2026
AUD/USD — Daily Framework Read | Thursday 28 May 2026
AUD/USD | Pre Asia Setup Daily Read | Data basis: 2026-05-28 close
Where It Sits
Structure
Structurally AUD/USD has pulled back into the session close. The broader trend remains intact on the daily timeframe but the shorter timeframe has softened. The structure is contested near the 0.7145 level.
Momentum
Momentum is neutral with internal readings near the centre of the range. That is the signature of a market digesting the prior move. The tape needs a fresh catalyst to commit to direction.
Volume & Flow
Volume data is limited for this session. The positioning read is neutral — no obvious skew in either direction. Watch for flow confirmation on the next session.
Key Levels
| Level | Type | Significance | Action Zone |
|---|---|---|---|
| 0.7155 | Resistance | Upper range target, prior supply zone | Take profits / fade if rejected |
| 0.7148 | Pivot | Mid-range continuation marker | Hold = constructive; lose = consolidation |
| 0.7145 | Session close | Reference anchor for next session | Above = continuation; below = mean revert |
| 0.7141 | Support | Recent range floor, demand zone | Buy zone with defined stop |
| 0.7134 | Major support | Prior breakout retest level | Stop-out below for longs |
Three Scenarios
Continuation
AUD/USD holds the session close at 0.7145 and pushes lower on continued positioning flow. The broader trend remains intact. Watch the dollar tape for confirmation.
Range
AUD/USD opens flat and ranges around 0.7145. Neither side has conviction without a fresh data catalyst. Range trade dominates.
Mean Reversion
AUD/USD breaks below support on a shift in dollar positioning. Mean reversion within the broader trend. Watch for a clean test of support before committing.
Risk Score
Risk sits at Around 50%
Risk sits around 50 per cent. Vix at 16.3 supports a measured risk posture. sentiment at 61 is in greed territory. Currency pairs carry intervention and data-release headline risk. Standard sizing with defined stops — discipline beats conviction.
How to Walk It
Entry / Stop / Target structure:
- Long 0.7141 pullback | Stop 0.7134 | Target 0.7148 | R:R 2:1
- Long 0.7148 breakout | Stop 0.7145 | Target 0.7155 | R:R 1.5:1
- Fade 0.7155 rejection | Stop above resistance | Target 0.7145 | R:R 2:1
Experience-level guidance:
Beginner: Reduce size to half your standard. Trade only the cleanest setup from the entries above. If the tape opens against your bias, do nothing — wait for the second hour, when the institutional flow has tipped its hand.
Intermediate: Use the levels table to define the trading range. Fade the extremes with defined stops, take profits before the round-number resistance levels.
Advanced: The vol regime supports defined-risk structures around the key pivot levels. Keep notional small relative to your book — asymmetric speculation, not core positioning.
Continue Reading
The macro frame driving this read is unpacked in the session briefs:
Check the latest session briefs on the site.
This analysis is for educational and informational purposes only. It does not constitute financial advice. Always manage your risk independently and in accordance with your own financial circumstances.
Tuesday 26 May 2026
Ethereum (ETH/USD)
SELL PRESSURE
Friday Close · 25 May 2026 · 390-min
The Read
Ethereum is under sustained pressure, with multiple levels of structure having broken down across the session. The picture here is more bearish than Bitcoin at this moment — the Fibonacci retracement zones that were expected to hold as support gave way, and the selling accelerated rather than slowing. That type of breakdown through expected support tends to attract more sellers who were holding out hope of a recovery. It amplifies the move rather than dampening it.
Ethereum’s fundamental story is undergoing a reassessment by the market right now. The competition from alternative Layer 1 blockchains has intensified, and fee revenue on the Ethereum network has been softer than peak cycle expectations. That does not invalidate the long-term thesis — Ethereum remains the dominant smart contract platform with institutional backing and the deepest developer ecosystem — but it does mean the premium the market placed on Ethereum relative to Bitcoin is being questioned. When the ratio turns, Ethereum underperforms on the downside just as it outperforms on the upside.
The “HP value area high crossed” signal near the recent lows indicates a stretch to the downside, similar to what was noted in Bitcoin. A technical bounce is likely before the week ends, but the structure needs significantly more repair before bulls can have confidence. The Fibonacci retracement zones on the chart are the key references — a clean hold and reclaim of the retracement level that gave way would be the first sign that buyers are organising themselves for a counter-move.
Key Levels
| Level | Price | Notes |
|---|---|---|
| Short Entry | $2,640 | Bounce into broken Fibonacci zone |
| Stop | $2,710 | Above retracement held zone |
| Target 1 | $2,420 | Value area low support |
| R:R | 3.1:1 | Extended downside target |
Risk
Around 65% — Ethereum’s underperformance relative to Bitcoin in risk-off periods is well documented. The additional layer of competitive narrative risk (alternative chains gaining ground) makes this more complex than a simple technical breakdown. A sudden positive catalyst — a major protocol upgrade, a new institutional product launch, or a sharp Bitcoin recovery — would drag Ethereum sharply higher and punish short positions quickly.
Experience Guidance
Ethereum is a good instrument for traders who understand both the technical and the narrative. The structure is telling you one thing clearly — sellers are in control right now. But Ethereum’s history is one of violent reversals that punish those who over-commit to a directional view. Trade it with a size that lets you sit through a 5 to 8 percent adverse move without being forced out. If you cannot afford that buffer given your account size, reduce position size until you can. Forced exits are how most traders lose money on instruments with this level of volatility.
Saturday 23 May 2026
Ethereum (ETH/USD) — Weekend Daily Read
Framework Bias
LONG BIAS
Ethereum at $2,055 is holding at an important psychological level. The $2,000 mark is the key support that defines the medium-term bull case. As long as ETH holds above $2,000, the uptrend structure is intact. Friday’s close at $2,055 after testing $2,056 as the low (essentially holding $2,050) is a constructive picture going into the weekend.
The ETH/BTC ratio at approximately 0.0273 is a concern for ETH bulls. This ratio has been declining, meaning Bitcoin has been outperforming Ethereum in the current cycle. When BTC dominance is rising, altcoins including ETH tend to underperform. The question is whether ETH is lagging and due for a catch-up trade, or whether the ratio decline is signalling something more structurally wrong with the Ethereum value proposition.
The framework leans long ETH based on its position above $2,000 and the general risk-on environment. The caveat is the ETH/BTC ratio. A ratio hold above 0.0270 would be the minimum requirement to maintain the long bias with reasonable conviction.
Key Levels
| Level Type | Price | Note |
|---|---|---|
| Major Resistance | $2,500 | Round number and near-term recovery target |
| Near Resistance | $2,200 | Prior swing high and important ceiling |
| Near Resistance | $2,069 | Friday session high |
| Current Price | $2,055 | Friday close |
| Key Support | $2,000 | Round number — bull/bear dividing line |
| Major Support | $1,800 | Monthly structural demand and prior base |
Trade Framework
| Scenario | Entry Zone | Stop | Target | R:R |
|---|---|---|---|---|
| Long on $2,000 support hold | $2,010 to $2,040 | $1,940 | $2,200 | approx 2.7:1 |
| Long on $2,070 break | $2,075 | $2,010 | $2,250 | approx 2.7:1 |
| Short on $2,000 failure | $1,990 break | $2,050 | $1,800 | approx 3.2:1 |
Confidence level: around 58%. The $2,000 support is the entire conviction story for ETH. Above it, long bias holds. Below it, the picture changes materially. The 58% reflects ETH’s current underperformance versus BTC and the risk that the ETH/BTC ratio continues to decline, pressuring ETH even in a broadly risk-on environment.
Weekend Context
Ethereum’s fundamental value proposition is built on its role as the base layer for decentralised finance, NFTs, and institutional tokenisation. The Ethereum Foundation’s roadmap continues to progress, with network upgrades improving transaction throughput and reducing fees. These improvements are not immediately price-catalytic but they strengthen the long-term case.
The approval of spot Ethereum ETFs in the US was a significant institutional milestone. However, the ETF inflows for ETH have been more modest than for Bitcoin, suggesting institutional appetite for ETH is real but smaller in scale. That gap in institutional enthusiasm partly explains the weaker ETH/BTC ratio performance.
Over the weekend, monitor DeFi total value locked (TVL) as a real-time demand indicator for the Ethereum network. Rising TVL indicates more capital is actively using the network, which drives gas fee demand and is positive for ETH. Falling TVL signals that capital is leaving the ecosystem, which is the early warning sign that precedes price pressure. Several on-chain analytics sites provide live TVL data through the weekend.
Friday 22 May 2026
CRYPTO | Friday 22 May 2026
Ethereum: Quietly Outperforming Bitcoin and the Gap Is Getting Interesting
Thursday close: $2,137 | Daily change: +0.46% | Bias: Cautiously Bullish
Current Read
Ethereum gained 0.46% on Thursday versus Bitcoin’s 0.31%. That small difference is more significant than it appears. When ETH begins to consistently outperform BTC, even by small margins, it typically signals that the broader crypto market is moving toward a risk-on phase within the sector. The money flows from Bitcoin, which institutions treat as the lower-risk allocation, into Ethereum and altcoins when appetite for crypto risk is increasing.
At $2,137, Ethereum is well below its all-time highs from the previous cycle but has been building a solid base in the $2,000-$2,200 range. The network fundamentals support a case for higher prices: activity on the Ethereum network has remained elevated, Layer 2 adoption continues to grow, and staking participation has increased, reducing the effective floating supply.
The macro case for Ethereum is similar to Bitcoin, with the additional variable that ETH is more closely tied to technology sector sentiment than BTC. On days when technology names in equity markets perform well, ETH tends to perform relatively well too. That connection makes it a useful cross-reference: weak Nasdaq on a day of ETH strength would be an unusual and therefore notable divergence.
Key Levels
What Changed Thursday
ETH’s slight outperformance of BTC on Thursday is the notable change. In an otherwise quiet crypto session, the marginal rotation from Bitcoin toward Ethereum is a signal worth tracking. It does not need to be dramatic to be meaningful, because the rotation typically builds over several days before it becomes visible in percentage terms.
No major Ethereum-specific news came through on Thursday. The network had no significant upgrades or incidents. The price action was driven by the same macro and crypto-market factors affecting BTC, with ETH simply responding slightly more positively. When nothing specific is driving the outperformance, it is more likely to be positioning and flow data, which can be a durable signal rather than a reaction to a single event.
Friday Scenarios
Bull Case
ETH pushes through $2,200, which is the upper boundary of the current range. A clean break and hold above $2,200 would represent the first meaningful technical development in two weeks and would target $2,400 as the next area of interest. BTC also needs to cooperate for this to be sustainable; a solo ETH breakout without BTC confirmation tends to fade.
Base Case
ETH drifts between $2,100 and $2,200 through a quiet Friday session. The outperformance pattern from Thursday is not yet confirmed as a trend, and the market takes another day before deciding. This is the most likely outcome and keeps options open for the following week.
Bear Case
A break below $2,050 would indicate that the crypto range is resolving to the downside. $2,000 would be the next significant support. Given the $2,000 psychological importance, a break below it would likely attract meaningful selling. Watch BTC simultaneously: if BTC breaks $76,000 first, ETH below $2,050 becomes more probable.
Sizing and Approach
ETH at $2,137 is sitting in the middle of its range. The cleanest trade is at the edges: buy a test of $2,050-$2,000 with stops below $1,950, or buy a confirmed break of $2,200 with stops below $2,150. Trading the midpoint requires either very tight stops that will likely be run, or wide stops that produce an unfavourable risk-reward ratio.
Ethereum is more volatile than the percentage figures suggest in dollar terms. A 3% move is $64. Size accordingly and do not confuse the smaller percentage moves with smaller absolute risk.
Cross-References
- Bitcoin: The primary reference. ETH and BTC move together most of the time. Persistent ETH outperformance would be a meaningful signal; one-day divergence is not.
- SOL: Solana at $175 is another risk-appetite indicator within crypto. If SOL is strong and ETH is also strong, the broader crypto market is in good shape.
- Nasdaq: Ethereum has a higher correlation to tech equities than Bitcoin. A weak US tech session would typically be a headwind for ETH specifically.
- DXY: Broad risk asset driver. Dollar weakness supports all crypto, including ETH.
Tuesday 19 May 2026
Ethereum Underperforms in Risk-Off Session, Holds $2,100 as a Lifeline
Monday 18 May 2026 | Crypto | ETH/USD
Session Summary
Ethereum closed at $2,125.42 on Monday, down 0.10% on the day in a technically flat but structurally weak session. Price opened at $2,129.87, briefly reached $2,153.50 in early trade, then retreated to a session low of $2,080 before recovering to close near the session midpoint. The $73 intraday range reflects ongoing uncertainty. Volume of $21.3 billion on the day is meaningful and confirms this is an active market rather than a thin-market drift. The inability to sustain above $2,130 is telling.
Daily Read
Ethereum’s underperformance relative to gold on a risk-off day is the most important signal here. Gold gained 0.31% while ETH lost 0.10% — a modest numerical difference, but the directional divergence between a safe haven and a risk asset moving together (both sideways to slightly lower in real purchasing power terms) tells you something about where institutional capital is being directed. The answer is: into gold, not into ETH.
The $2,080 low tested an area that has been important support in recent weeks. The recovery from that level to close at $2,125 shows that buyers exist at those prices, but they are not yet pressing the market higher with any conviction. Ethereum at this price level is caught between its identity as a technology platform (which benefits from risk-on flows into growth assets) and its use as a crypto store of value (which benefits from risk-off flows). When neither narrative has a clear edge, the market drifts.
Key Levels
| Level | Price | Context |
|---|---|---|
| Resistance | $2,150 — $2,175 | Above Monday’s high; breaking here opens the $2,200 round number |
| Support / Entry | $2,080 — $2,100 | Monday’s session low zone; buyers defended here today |
| Stop | $2,040 | A close below $2,080 opens a test of $2,000 — the critical round-number support |
| Target 1 | $2,150 | Monday’s high retest; R:R approximately 1:1 from $2,100 entry — partial profit only |
| Target 2 | $2,200 | Round-number target; R:R approximately 1.7:1 from $2,100 entry |
Tomorrow’s Setup
Bias: Neutral, leaning bearish if risk sentiment deteriorates further. The $2,080 low is the line in the sand. Above it, ETH has a path to $2,150 — $2,200. Below it, $2,000 comes quickly.
- Bull scenario: Bitcoin finds footing above $77,000 overnight and leads ETH higher. ETH breaks above $2,150 in London, targeting $2,200 in the NY session. This requires a risk-on shift in equity futures too.
- Bear scenario: Bitcoin fails to recover and breaks $76,000. ETH follows, cracking $2,080 and testing $2,040. A daily close below $2,040 accelerates toward $2,000 which is the next major support.
- Key relationship: ETH’s direction is dominated by BTC’s lead right now. Watch BTC first, trade ETH second.
Experience Guidance
New to ETH trading: When ETH underperforms gold on the same day, that is a signal this market is trading as a risk asset — treat it like a tech stock, not digital gold, until further notice.
Developing trader: The $2,080 low is the level that matters most right now — every decision should be anchored to whether ETH is above or below it.
Experienced trader: ETH’s beta to BTC in this environment means it will amplify both moves. If BTC finds a recovery, ETH typically moves 1.3 — 1.5x the percentage — size accordingly for the leverage effect.
This content is for informational and educational purposes only and does not constitute financial advice. Past performance is not indicative of future results. All trading involves risk. Crypto markets are highly volatile. Always conduct your own research before making any investment decisions.
Monday 18 May 2026
Ethereum Underperforms in Risk-Off Session, Holds $2,100 as a Lifeline
Monday 18 May 2026 | Crypto | ETH/USD
Session Summary
Ethereum closed at $2,125.42 on Monday, down 0.10% on the day in a technically flat but structurally weak session. Price opened at $2,129.87, briefly reached $2,153.50 in early trade, then retreated to a session low of $2,080 before recovering to close near the session midpoint. The $73 intraday range reflects ongoing uncertainty. Volume of $21.3 billion on the day is meaningful and confirms this is an active market rather than a thin-market drift. The inability to sustain above $2,130 is telling.
Daily Read
Ethereum’s underperformance relative to gold on a risk-off day is the most important signal here. Gold gained 0.31% while ETH lost 0.10% — a modest numerical difference, but the directional divergence between a safe haven and a risk asset moving together (both sideways to slightly lower in real purchasing power terms) tells you something about where institutional capital is being directed. The answer is: into gold, not into ETH.
The $2,080 low tested an area that has been important support in recent weeks. The recovery from that level to close at $2,125 shows that buyers exist at those prices, but they are not yet pressing the market higher with any conviction. Ethereum at this price level is caught between its identity as a technology platform (which benefits from risk-on flows into growth assets) and its use as a crypto store of value (which benefits from risk-off flows). When neither narrative has a clear edge, the market drifts.
Key Levels
| Level | Price | Context |
|---|---|---|
| Resistance | $2,150 — $2,175 | Above Monday’s high; breaking here opens the $2,200 round number |
| Support / Entry | $2,080 — $2,100 | Monday’s session low zone; buyers defended here today |
| Stop | $2,040 | A close below $2,080 opens a test of $2,000 — the critical round-number support |
| Target 1 | $2,150 | Monday’s high retest; R:R approximately 1:1 from $2,100 entry — partial profit only |
| Target 2 | $2,200 | Round-number target; R:R approximately 1.7:1 from $2,100 entry |
Tomorrow’s Setup
Bias: Neutral, leaning bearish if risk sentiment deteriorates further. The $2,080 low is the line in the sand. Above it, ETH has a path to $2,150 — $2,200. Below it, $2,000 comes quickly.
- Bull scenario: Bitcoin finds footing above $77,000 overnight and leads ETH higher. ETH breaks above $2,150 in London, targeting $2,200 in the NY session. This requires a risk-on shift in equity futures too.
- Bear scenario: Bitcoin fails to recover and breaks $76,000. ETH follows, cracking $2,080 and testing $2,040. A daily close below $2,040 accelerates toward $2,000 which is the next major support.
- Key relationship: ETH’s direction is dominated by BTC’s lead right now. Watch BTC first, trade ETH second.
Experience Guidance
New to ETH trading: When ETH underperforms gold on the same day, that is a signal this market is trading as a risk asset — treat it like a tech stock, not digital gold, until further notice.
Developing trader: The $2,080 low is the level that matters most right now — every decision should be anchored to whether ETH is above or below it.
Experienced trader: ETH’s beta to BTC in this environment means it will amplify both moves. If BTC finds a recovery, ETH typically moves 1.3 — 1.5x the percentage — size accordingly for the leverage effect.
This content is for informational and educational purposes only and does not constitute financial advice. Past performance is not indicative of future results. All trading involves risk. Crypto markets are highly volatile. Always conduct your own research before making any investment decisions.
Sunday 17 May 2026
ETHEREUM : Friday 16 May 2026
Ticker Review | Crypto | Alpha Insights
Week at a Glance
What Happened
Ethereum fell 2.13% on Friday. Bitcoin fell 1.32%. That 80 basis point underperformance is not noise. It is a signal about where capital is sitting within the crypto complex.
When macro pressure hits crypto, capital consolidates toward quality. BTC is the institutional anchor. ETH is the DeFi infrastructure layer. In a risk-off environment with rising rates, DeFi utility compresses. The yield competition from 4.50%+ Treasuries makes ETH staking yields less attractive. Lower gas fees reduce the ETH burn rate through EIP-1559. The structural demand drivers for ETH weaken faster than for BTC in this macro configuration.
The liquidation sequence in crypto is consistent across cycles. Altcoins first, ETH second, BTC last. Friday showed that pattern running exactly as expected. SOL fell 3.33%, AVAX 2.80%, ETH 2.13%, BTC 1.32%. Clean waterfall from highest beta to lowest. That is not random. That is the institutional exit sequence playing out mechanically.
The ETH/BTC ratio is falling. That trend historically runs three to six weeks in DXY-strength cycles. You are at the beginning of that window, not the end. ETH will recover eventually. But it will recover after BTC stabilises, not before.
What the Alpha Insights Said
Digital Flow : Quality Rotation Within Crypto
The digital flow analysis identified the ETH/BTC ratio decline as a quality rotation signal. When the broader market sells risk, capital consolidates from ETH and alts toward BTC. The structural causes are documented: DeFi utility compression, yield competition from 4.50%+ Treasuries, lower gas fees reducing burn, and the institutional liquidation sequence that exits ETH before BTC. Three to six weeks of ETH/BTC underperformance is the historical norm in this macro configuration.
Macro Pulse : Rate Competition Hits ETH Hardest
The 10-year yield above 4.50% creates a direct yield competition with ETH staking rates. If you can earn 4.50%+ in risk-free Treasuries, you need a meaningful premium to justify the smart-contract risk of ETH staking. As Treasury yields rise, the ETH staking yield premium shrinks. That is not speculation : it is arithmetic. The macro report identified this as the structural headwind for ETH specifically, not just for crypto broadly.
Sector Flow : Tech Bifurcation Pattern Mirrored in Crypto
The sector analysis identified a clear bifurcation in technology: NVDA accumulated while broad Nasdaq fell. The same pattern runs in crypto. BTC outperformed while ETH and alts fell. Quality held, beta suffered. The framework called this identical pattern in both equity tech and crypto. The difference is that the equity side has a specific catalyst (NVDA earnings) pulling the winner higher. Crypto does not have that independent catalyst yet.
Overwatch Synthesis : Second-Order Recovery Asset
The analysis synthesis placed ETH in the AVOID category explicitly. The recovery sequence is BTC first, then ETH, then alts. ETH is the second-order bet. You need to see BTC funding normalise and BTC stabilise above $79,000-$80,000 before ETH becomes a valid long. Until BTC completes its flush, ETH carries BTC risk plus its own yield-competition headwind simultaneously.
Key Levels
| Level | Price | Significance |
|---|---|---|
| Resistance | $2,350 | Recovery target once BTC stabilises. Not a near-term level. |
| Friday Close | $2,176 | Current price. ETH/BTC ratio still falling. |
| Support | $1,900 | Scenario C target if BTC approaches $70,000. Not the base case. |
| BTC Trigger Level | $80,000+ stable | BTC must stabilise above here before ETH long becomes valid. |
| Funding Rate Trigger | -0.005% / 8hr | BTC funding normalising through here signals flush exhausting. ETH entry becomes available after BTC confirms. |
Signal + Bias
ETH is a second-order recovery asset. BTC must stabilise first. ETH/BTC ratio still falling. Yield competition structural. Not the right entry point.
ETH carries two separate headwinds simultaneously. BTC’s macro flush has not completed, so ETH carries BTC correlation risk. And ETH has its own yield-competition structural headwind from 4.50%+ Treasuries. Two headwinds, no offset mechanism available yet.
The recovery will come. When BTC funding normalises, BTC stabilises, and the macro contradiction resolves through FOMC minutes, ETH will bounce. And it will likely bounce harder than BTC on the way up because it fell further on the way down. That is the trade to be ready for. It is not the trade to make right now.
Next Week Setup
Everything that matters for ETH next week runs through BTC first. Monitor BTC funding every eight hours. When it reaches the -0.025% floor and begins normalising toward -0.005%, that is the signal the BTC flush is completing.
FOMC minutes on Wednesday 14:00 ET matter for ETH through two channels. Macro channel: hawkish minutes extend the dollar bid and pressure all crypto. DeFi channel: if the minutes reinforce higher-for-longer rates, the ETH staking yield competition gets worse, not better. Dovish-hold minutes reverse both simultaneously.
NVDA earnings in late May provides a secondary path. If NVDA beats and accelerates a tech rally, BTC follows NDX higher. BTC recovery leads to ETH recovery. But this is three to four weeks away.
ETH Entry Checklist (ALL required)
- BTC funding rate normalises through -0.005% per 8hr
- BTC price stabilises above $79,000-$80,000 on multiple sessions
- FOMC minutes not aggressively hawkish (DXY holds below 100)
- ETH/BTC ratio shows at least one session of stabilisation
Wait for all four. Not three.
Risk Score
Why around 55%: ETH carries more risk than BTC right now because it has two headwinds running simultaneously. BTC at least has the basis trade available as a defined-risk position. ETH does not have an equivalent defined-risk play while the flush continues. The ETH/BTC ratio falling adds a third layer: even if the broader market recovers, ETH could underperform within crypto. Three compounding risks with no clear catalyst until BTC stabilises and rates show direction.
The One Rule for ETH
ETH recovers after BTC. Not before. Not at the same time. After. Wait for BTC to show you the recovery first, then ETH is the higher-beta expression of it. Entering ETH before BTC has confirmed the bottom is doubling your risk without doubling your information.
Alpha Insights : Friday 16 May 2026. For informational purposes only. Not financial advice. All trading involves risk of loss.
Friday 15 May 2026
Ethereum (ETH/USD) — Daily Read | Friday 15 May 2026
Friday close | ETH ~$2,250 est | BTC led down, ETH followed with higher beta | Not financial advice
WHAT CHANGED FROM YESTERDAY
Yesterday ETH was at $2,308 (+2.22%), tracking BTC’s +2.86% move but at a slightly lower magnitude. The read noted the recurring pattern: BTC leads, ETH follows with a slightly lower beta on the upside. Today the inverse of that relationship plays out. BTC is down 2.40%. ETH typically carries a beta of 1.1-1.3x BTC on downside moves. Estimated ETH close around $2,240-2,260 — a -2.5% to -3.0% decline consistent with BTC’s move plus a small beta premium. The question the Thursday read asked — can ETH sustain above $2,300 after the CPI catalyst? — is answered by Friday. It cannot. One-day bounce inside a larger downtrend is the current read.
HEADLINE STATE: BTC FOLLOWER — ETH Down in Line with Crypto Risk-Off, $2,300 Failed as Resistance
ETH at ~$2,250 confirms the Thursday thesis: the CPI bounce was a one-day event. ETH could not sustain $2,300 as a new floor. The broader crypto risk-off, driven by the equity sell-off and VIX spike to 18.43, pulled ETH back into its established downtrend. ETH is in the position of needing a sustained equity recovery to break above $2,300 again — and that requires the Retail Sales growth concern to resolve positively. One number did not resolve it on Friday. A week of data might.
| Metric | Thu 14 May | Fri 15 May | Note |
|---|---|---|---|
| ETH/USD | $2,308 (+2.22%) | ~$2,250 (-2.5% est) | $2,300 not sustained |
| BTC (leader) | ~$81,000 (+2.86%) | $79,105 (-2.40%) | BTC led, ETH followed |
| ETH beta vs BTC | 0.78 (ETH lagged on upside) | ~1.05-1.1 (ETH slightly harder) | Asymmetric beta pattern |
| $2,300 level | Tested (above briefly) | Failed — now resistance | Key level next week |
KEY LEVELS INTO NEXT WEEK
- $2,300 — the level ETH needs to close above to establish a new floor. Thursday’s high. Now resistance.
- $2,250 — estimated Friday close, immediate reference for Monday’s Asian session.
- $2,200 — support below. If ETH drops here next week, the CPI bounce is fully erased.
- $2,100 — deeper structural support. Only in play if BTC breaks $76,000 and equity risk-off persists.
OVERWATCH CONTEXT
The Overwatch tracked BTC’s divergence closing as a key signal for the week. ETH is the companion that confirms or contradicts that read. ETH lagging BTC on the upside Thursday (+2.22% vs BTC +2.86%) and then falling in line on the downside Friday is the asymmetric beta pattern — ETH underperforms on risk-on, overperforms on risk-off in the downward direction. This is consistent with ETH’s position as a higher-beta crypto asset in declining risk environments. The ETH/BTC ratio is the number to watch next week: if it falls, risk-off is getting more intense in crypto. If it recovers, ETH is finding its footing.
WHAT TO WATCH NEXT WEEK
- BTC $80,000 level — ETH follows BTC. If BTC reclaims $80K, ETH gets a floor. If BTC fails $80K, ETH falls further.
- $2,300 as Monday’s first resistance test. ETH needs a sustained close above to shift the read from downtrend to recovery.
- ETH/BTC ratio — falling ratio means ETH underperforming crypto, which is risk-off-within-risk-off. Rising ratio means ETH finding relative strength.
- Any ETH-specific catalyst — staking yields, protocol upgrades, ETF news — can break the BTC correlation for individual sessions.
Friday 15 May 2026 | Not financial advice. For informational purposes only.
Friday 15 May 2026
Ethereum (ETH) — Daily Read | Friday 15 May 2026
Post-CPI close | $2,308 — confirmed the BTC recovery, broader crypto bid real | Not financial advice
WHAT CHANGED FROM YESTERDAY
Yesterday ETH was described as the confirmation instrument: if BTC’s recovery was real and not just a short-covering squeeze on a single asset, ETH needed to participate. ETH closed Thursday at $2,308 (+2.22%). That participation is the signal. When BTC recovers from a three-session divergence and ETH moves in lockstep, the broader crypto risk appetite is genuinely returning, not just one asset’s mechanics resolving. What changed is that ETH’s move confirms the Overwatch’s conclusion: Thursday’s CPI was a genuine macro event that restarted the risk appetite across all risk assets simultaneously — including the crypto market that had been lagging for three sessions.
HEADLINE STATE: CONFIRMING BTC — Breadth Is Sector-Wide, Not BTC-Specific
ETH at +2.22% versus BTC’s +2.49% is a near-parallel move. When the two largest crypto assets move in near-identical percentages on a risk-on day, it tells you the driver is the macro environment, not individual asset mechanics. This is not ETH catching up to BTC or BTC dragging ETH. Both assets received the same institutional flow on the same catalyst. The Overwatch used ETH’s move as the confirming evidence that BTC’s recovery was real breadth, not a squeeze. On Friday, ETH’s job is the same: if BTC holds above $80K, ETH above $2,250 confirms the broader crypto hold. If either breaks, the other is warning you.
Key Levels
| Level | Price | Significance |
|---|---|---|
| Thursday close | $2,308 | +2.22% — confirmed BTC recovery, breadth real |
| BTC/ETH breadth check | Near-parallel | BTC +2.49%, ETH +2.22% — macro driver, not individual mechanics |
| Strong RS upside | $2,380–$2,430 | Retail Sales strong — risk appetite extends, ETH resumes upside |
| Hold range | $2,250–$2,320 | Friday consolidation — data day, position management |
| ETH breadth floor | $2,250 | Below this = BTC divergence question reopens, breadth read fails |
| BTC cross-check | $80,000 | BTC below $80K + ETH below $2,250 = both diverge, risk appetite retreats |
Structure · Momentum · Flow
Structure
Short-term recovering within a macro downtrend. Same picture as BTC. The Wednesday-Thursday move restored short-term structure. Medium-term structure on higher timeframes is still falling.
Momentum
Positive short-term. Confirmed by near-parallel move with BTC. The move was broad (BTC + ETH) and driven by macro (CPI). That combination sustains momentum better than a single-asset squeeze.
Flow
Risk-on flow returned to the whole crypto sector. ETH’s parallel move to BTC means institutional accounts rotated into both, not just the headline asset. That is a cleaner flow signal than a BTC-only move.
| Bias | LONG SHORT-TERM — breadth confirmed with BTC |
| Risk estimate | Around 35% — same risk picture as BTC, macro downtrend not reversed |
| BTC/ETH watch | Both above their floors = breadth intact. One breaks = warning for both. |
| Confirmation rule | ETH confirms BTC. Never read BTC alone — always check ETH. |
| Week carry | Bullish short-term — divergence closed, broader macro confirmed |
This content is for educational and informational purposes only and does not constitute financial advice. Past analysis does not guarantee future results. Always conduct your own research before making any trading decisions.
Thursday 14 May 2026
Ethereum (ETH) — Daily Read | Thursday 14 May 2026
Post-CPI mid-session | Crypto caught a broad bid | Not financial advice
NEW TICKER — First Entry in Daily Read Rotation
ETH is being added to the daily read rotation today. No prior ticker to compare against directly. Context: ETH is at $2,308 (+2.22%) today, tracking BTC’s +2.86% move but at slightly lower magnitude. This relationship — ETH lagging BTC marginally on the upside — is a recurring pattern. BTC leads, ETH follows with a beta coefficient. The question for ETH specifically is whether it can sustain above $2,300 after the CPI catalyst or whether this is a one-day bounce inside a larger downtrend.
HEADLINE STATE: CRYPTO BID — ETH +2.22%, Following BTC’s Lead
Ethereum is participating in the CPI-driven crypto recovery. The fact that both BTC and ETH are moving together on the same day with similar magnitudes tells you this is a macro risk-on flow, not a BTC-specific story. When risk capital enters crypto, it typically enters BTC first and ETH second. The 0.64% gap between BTC (+2.86%) and ETH (+2.22%) is within normal beta relationship range. ETH is doing what it should do when BTC catches a bid. The question specific to ETH is whether $2,300 holds as a base from here.
Key Levels
| Level | Price | Significance |
|---|---|---|
| Current price | $2,308 | +2.22% — strong single-day recovery |
| vs BTC today | BTC +2.86% | ETH slightly underperforming — normal beta lag |
| $2,300 psychological | $2,300 | Key round number — holding above it is important |
| P/C context | 0.531 | Broad market bullish — supports crypto bid |
| Catalyst | CPI lower | Risk-on across asset classes — crypto part of the wave |
Structure · Momentum · Flow
Structure
First read on ETH structure: $2,308 holding above $2,300 is positive. The CPI catalyst broke ETH out of the range it was holding. First structural read is cautiously positive — needs to hold $2,300 to confirm the upside.
Momentum
+2.22% is solid momentum for a single session. ETH following BTC with near-equal magnitude confirms the momentum is broad-based within crypto, not BTC-specific. The breadth of the crypto move makes it more credible than a single-asset spike.
Flow
Risk-on capital entering crypto broadly. ETH benefits as the second-largest crypto by market cap and the one with the most institutional infrastructure (ETFs, staking, DeFi). When institutional money enters crypto, it goes to BTC and ETH. Flow is supportive.
TODAY’S BIAS: CAUTIOUS LONG — $2,300 Is the Line
ETH at $2,308 above the $2,300 psychological level on a risk-on day is a positive near-term setup. The bias is cautiously long while $2,300 holds. If ETH dips below $2,300 into the close, the CPI bounce has failed to hold the key level and the risk is to the downside. The $2,300 level is simple to monitor and provides a clear decision point for the next 24 hours.
Risk: Around 45%
First session in the daily read means no established baseline for context. Risk is moderated by the fact that ETH is moving with BTC and the broader risk-on wave — that correlation makes it more reliable than a solo move. But buying crypto at the high of the day after a 2.22% pop carries entry-timing risk.
By Experience Level
New to this
ETH and BTC typically move together, but ETH usually moves more aggressively in both directions. BTC up 2.86%, ETH up 2.22% — ETH is slightly lagging today. In aggressive bull moves, ETH often catches up and overtakes BTC’s percentage gain. In downturns, ETH typically falls harder. Understanding the relationship helps you calibrate how much risk you are taking in each.
Developing
ETH at $2,308 after the CPI move: the question is whether this is a temporary risk-on bounce or the start of a sustained recovery. The way to assess this over the next 48 hours is to watch whether ETH holds $2,300 on any profit-taking and whether the next session continues higher or fades. One day alone does not answer the question.
Experienced
ETH’s slightly lower beta to BTC today (+2.22% vs +2.86%) could indicate relative underperformance within crypto — possibly some specific ETH selling offsetting the BTC-driven bid. Watch the ETH/BTC ratio. If it is declining while both are up in dollar terms, ETH is being relatively sold. That ratio divergence can be an early signal before the dollar price shows it clearly.
This is a daily analysis read for educational and informational purposes only. Nothing here is financial advice. Past performance is not a guide to future results. Trading carries significant risk of loss. Always apply your own risk management.
Tuesday 5 May 2026
Ethereum (ETH/USD) — Daily Framework Read | Tuesday 5 May 2026
Ethereum spent the back half of last week basing in the 2,260 to 2,320 zone after Friday’s flush, and Monday delivered the recovery candle the framework needed. Price closed Monday at 2,360 and trades near 2,350 into Tuesday’s London open. The bounce is real but the read stays measured: the longer-frame lens still points lower, the daily lens has only flipped neutral, and the rotation level has not been touched.
Tuesday thesis. Neutral with a constructive tilt. The rotation trigger sits at 2,386 to 2,400 — daily close above reopens 2,485 and 2,505. Below 2,335 the bounce loses footing and 2,287 to 2,261 comes back into play. The play this session is patience while FOMC Wednesday decides which side of 2,400 ETH closes.
Where It Sits Today
Current Price
2,350
+1.24% on the session
Session Range
2,310 – 2,394
84-dollar swing — the widest in five sessions
Monday Close
2,360
Reclaimed prior-week midpoint
Rotation Trigger
2,400
Daily close required
Tuesday’s bid is the second consecutive higher low on the four-hour. The bounce off 2,310 was clean — a wick, a strong hourly close back above 2,335, continuation into 2,360 without a real pullback. That is reactive structure, not impulsive. Buyers were waiting at the lower edge but have not yet shown the conviction to drive through the upper edge. Until 2,400 closes on a daily candle, this is a range trade for the framework, not a rotation trade.
Yesterday Versus Today
| What changed | Monday read | Tuesday read |
|---|---|---|
| Headline tilt | Holding pattern, structural lens still pointing lower | Neutral with a constructive tilt — bounce confirmed off the lower edge |
| Price reference | 2,321 with the prior session anchored at 2,310 to 2,335 | 2,350 with Monday’s close at 2,360 |
| Structure | Lens broken down, retracement zones holding but no upside conviction | Higher low confirmed on four-hour, lower-frame turning, longer-frame still down |
| Active level in play | 2,335 was the line for any bounce thesis | 2,386 to 2,400 is the rotation trigger; 2,335 is now the floor of the bounce |
| What we said yesterday | Monday said wait while the lenses healed. Price respected 2,310, bounced where the framework asked, added 1.24 percent into the higher-low close. The wait paid. | |
What the Framework Reads
The higher-frame lens remains tilted down — unchanged since the late-April rejection at 2,485. The lower-frame lenses are healing: the four-hour has lifted off the bottom, the hourly is constructive, the lowest intraday lens is actively positive. The framework respects the hierarchy. A constructive lower-frame inside a still-bearish higher-frame is a bounce, not a turn. It earns a tighter stop, smaller size, and a faster exit at the next resistance.
The rotation read has not changed. Capital still favours Bitcoin within the complex. ETH leading marginally on Monday is not enough — the live rotation signal is ETH leading on a session where BTC is also rallying. Tuesday’s tape is governed by FOMC anticipation; the genuine rotation read sits Wednesday afternoon onward. The level the framework wants closed above is 2,400. A daily close above opens 2,485 and the 2,505 reaction zone. A wick rejection at 2,386 to 2,400 keeps the longer-frame bias intact and re-opens 2,287 to 2,261.
Current read: neutral with a constructive tilt below 2,400
The bounce is real and the lower-frame lenses confirm it. The longer-frame lens is still pointing down and the rotation trigger has not fired. That makes Tuesday a watch session — work the bounce only on intraday timeframes, leave the swing decision until 2,400 has resolved one way or the other.
Key Levels
| Level | Price | Role | What it means |
|---|---|---|---|
| Bull continuation | 2,505 | Reaction zone | Reached on a clean break of 2,400 plus a constructive macro print. |
| First upside target | 2,485 | Late-April high | Capped the prior bounce. Retest with strength is the proof rotation is genuine. |
| Rotation trigger | 2,386 – 2,400 | Critical resistance — must close above | The framework’s gate. Daily close above here flips the longer-frame lens and confirms rotation. Below here, the bounce remains a bounce. |
| Current price | 2,350 | Mid-range | Above the lower edge, below the trigger. The neutral zone — patience pays here, action does not. |
| Bounce floor | 2,335 | First defence | Loss of this level on a closing basis breaks the higher-low structure and re-opens the lower zone. Hold here keeps the constructive tilt intact. |
| Lower zone top | 2,287 | First downside test | Where the prior week’s volume cluster sits. A flush into this band on macro disappointment finds buyers; a slice through it does not. |
| Structural floor | 2,261 | Bear scenario floor | Friday’s intraday low and the level that would invalidate the bounce thesis if breached on a closing basis. |
Risk Score
Risk: around 65 percent
The score has come off Friday’s reading of around 70 percent because the lower-frame lenses are no longer all pointed down and the bounce off 2,310 has held into a second session. It remains elevated: the longer-frame lens still points lower until 2,400 closes, the FOMC decision Wednesday is a binary event ETH cannot decouple from, and capital still favours Bitcoin within the complex which adds crowding risk on a flush. Sized appropriately, the bounce is tradeable; oversized, it gives back the gain on the FOMC reaction.
How to Walk It
STANDARD SIZE — On trigger
Entry: daily close above 2,400 post-FOMC
Stop: 2,310
Target 1: 2,485
Target 2: 2,505
Roughly 1.2 to 1 reward to risk on the first leg, more attractive if the close prints with conviction.
REDUCED SIZE — Intraday only
Long the 2,335 to 2,360 zone with a stop at 2,310 targeting 2,386 to 2,400. Closed before the FOMC print. This is the bounce trade, not the rotation trade.
AVOID — Carrying through FOMC
Do not hold an unhedged ETH position into the FOMC decision. The implied move on the print is wider than the cushion between current price and the bounce floor.
Scalpers: work the 2,335 to 2,386 corridor with a tight stop. Close everything before the FOMC tape Wednesday.
Swing traders: the setup is the breakout above 2,400, not the bounce off 2,310. Wait for the daily close, target 2,485 then 2,505.
Positional: if long from the prior consolidation, Monday gives breathing room but the structural picture is unchanged. Hard line at 2,261. Add only on a confirmed rotation signal.
Beginners: bounces and reversals are different things. Price has bounced. The framework has not given the all-clear for a reversal. Patience keeps you out of the trades that fail at first resistance.
Cross-Reference
Read this alongside today’s Bitcoin daily framework read — the BTC-to-ETH ratio is the single cleanest tell on whether Tuesday’s bid extends into a genuine rotation. The Pre-NY brief covers the FOMC anticipation tape and what it means for risk assets across the complex; the Digital Flow context for the prior session sits in last night’s Post-Close recap.
This analysis is for educational purposes only and does not constitute financial advice. Markets involve risk and capital can be lost. Always manage your risk appropriately.
Continue with Titan Protect
Twenty-plus instruments. One framework.
We read more than twenty instruments daily across four sessions. The framework’s sunrise call landed across the day — the Pre-NY case study shows what the lines drew, what New York did, and where the read stands.
Core
£59/mo
Indicator suite plus daily framework reads.
Edge Popular
£109/mo
Core plus Shield dashboard and member-only briefs.
Elite
£179/mo
Edge plus weekly 1:1 call and early access to new tools.
Save 15% on annual billing
Want to see the framework in action? Free Explorer tier — no card required.
Join the live community: Discord channel · Shield dashboard
Education, not financial advice. Trade your own analysis.
Sunday 3 May 2026
Ethereum (ETH/USD) — Daily Framework Read | Sunday 3 May 2026
Ethereum (ETH/USD) | Monday Open Framework Read | Data basis: Friday 1 May 2026 close
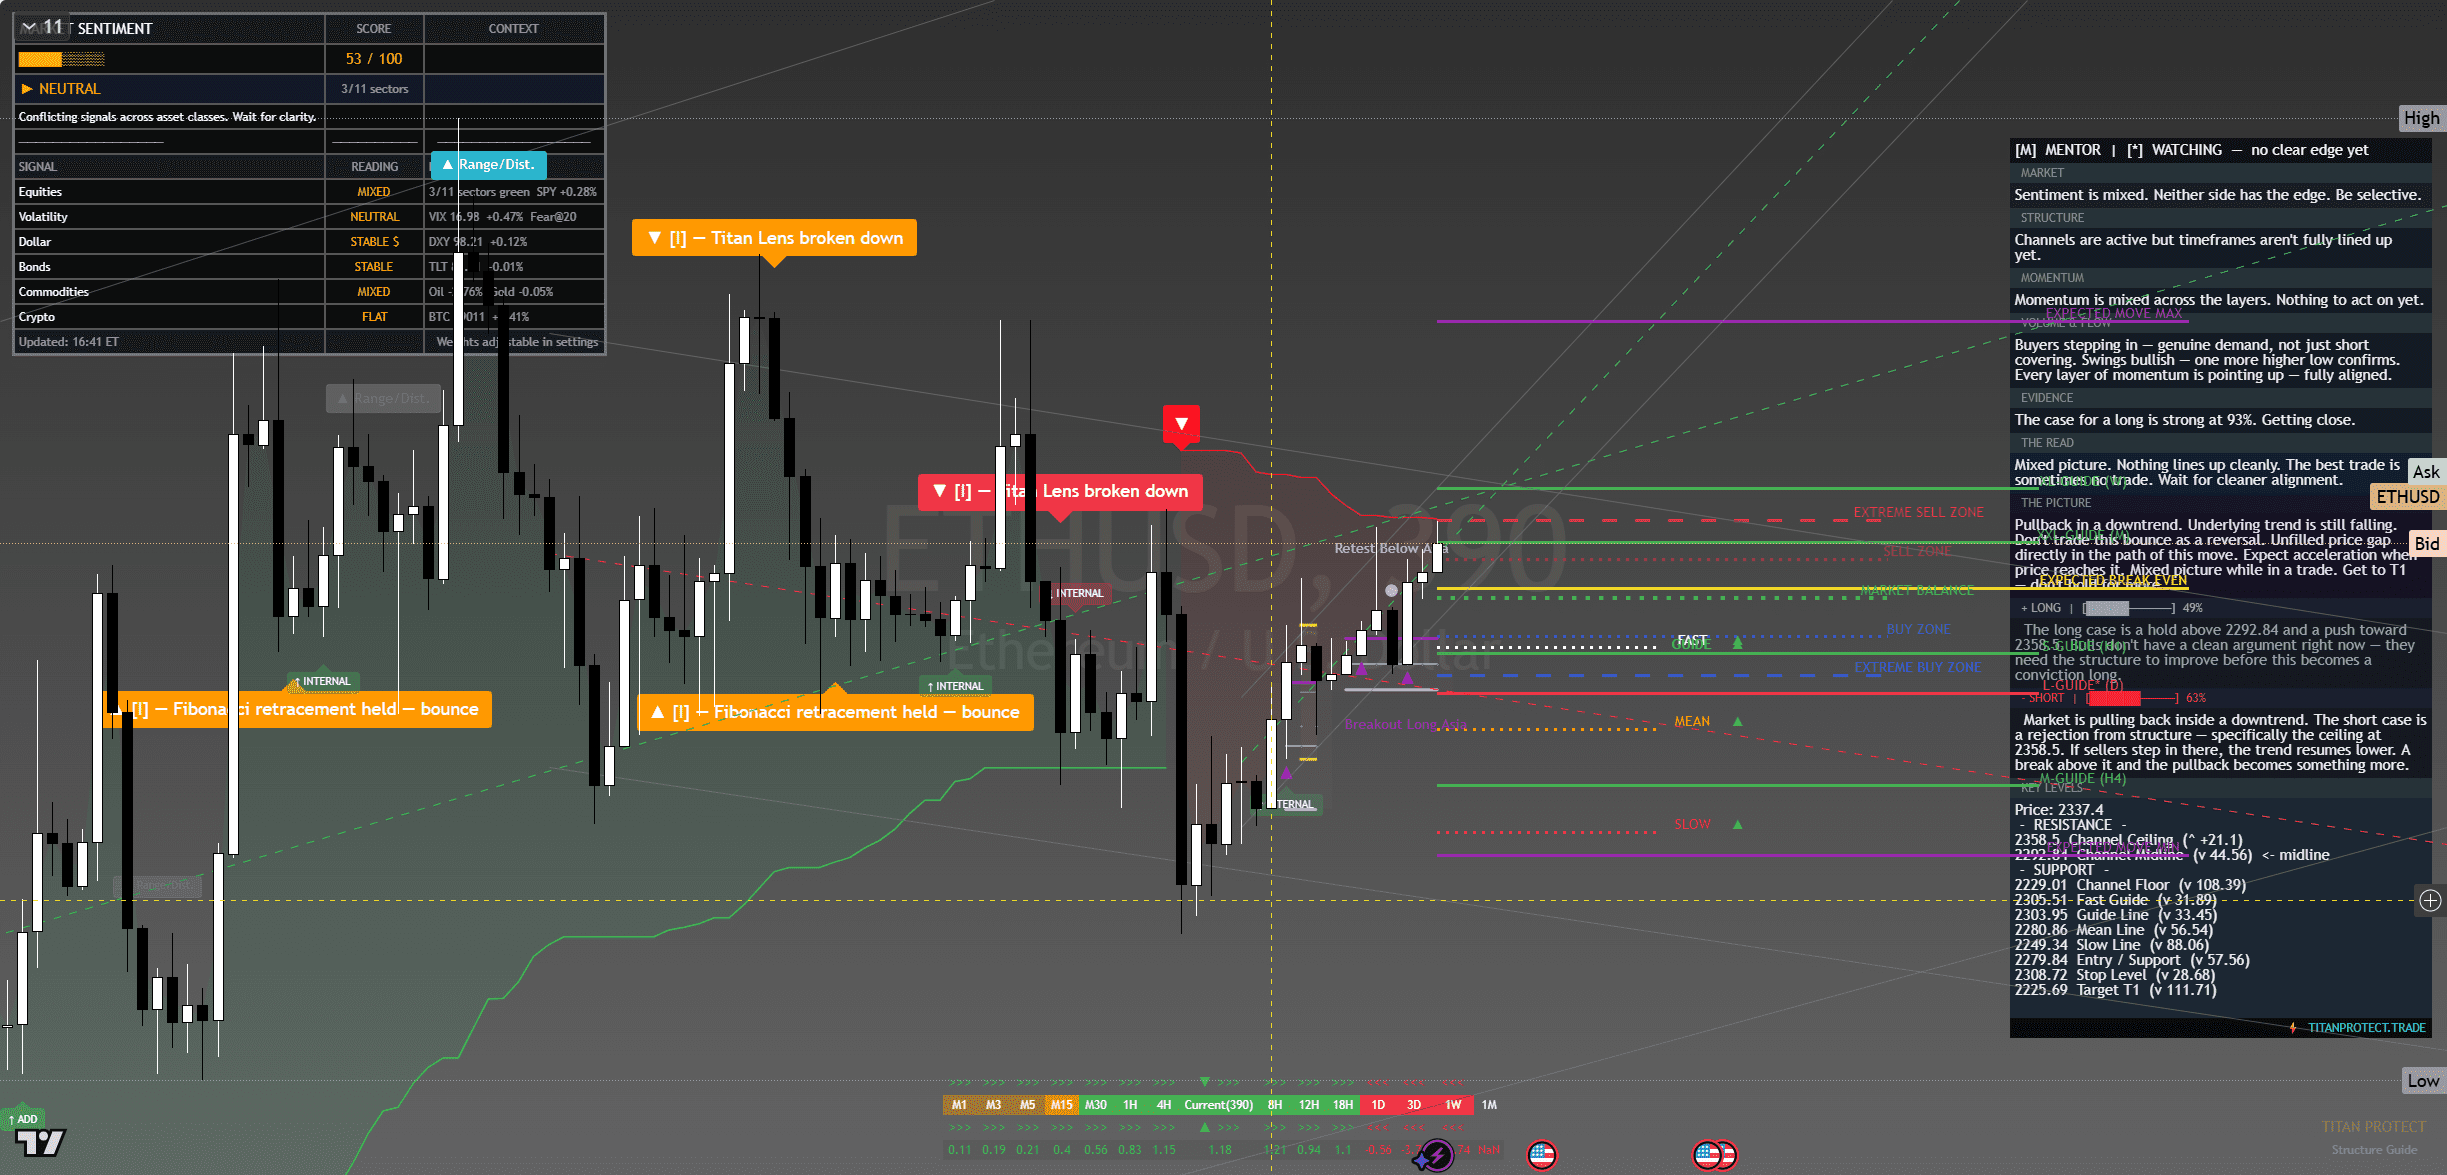
Ethereum (ETH/USD) — chart with framework overlay. The Lens annotations show structural breaks, reversal triggers and confluence zones at the levels referenced below.
Where It Sits
Structure
Structurally ETH is in an uptrend on daily timeframes with higher highs and higher lows since the early-April low. The 4-hour timeframe is more contested — recent consolidation has been muted compared to BTC’s. The structure is constructive but lagging.
Momentum
Momentum is positive but not leading. ETH’s gains over the past two weeks have been modest relative to BTC’s. The momentum profile supports continuation rather than initiation — wait for ETH to lead BTC for a stronger entry.
Volume & Flow
ETH futures flow has been steady but unspectacular. Staking flows remain supportive. The pattern is patient accumulation without enthusiasm.
Key Levels
| Level | Type | Significance | Action Zone |
|---|---|---|---|
| 2,450 | Resistance | Recent swing high zone | Take profits if reached |
| 2,380 | Pivot | Mid-range breakout trigger | Hold above = bullish bias |
| 2,325 | Friday close | Reference anchor | Bias line for Monday open |
| 2,260 | Support | Recent breakout retest | Buy zone with defined stop |
| 2,180 | Major support | Prior congestion floor | Stop-out below for longs |
Three Scenarios Into Monday Open
Continuation
ETH holds 2,300, takes 2,380 cleanly on continued risk-on mood and BTC strength. Runs to 2,450 zone overnight. Constructive close above 2,420.
Range
ETH churns 2,280-2,380 through the weekend roll. Magnet to Friday close. Range trade tracking BTC.
Mean Reversion
ETH fades on risk-off shift or BTC weakness, breaks 2,260, runs to 2,180. Mean-reversion within the broader trend.
Risk Score
Risk sits at Around 60% heading into Monday open.
Risk is moderate-elevated. ETH is the higher-beta expression of the crypto trade — bigger moves than BTC in both directions. The constraint is that ETH has lagged BTC’s recent strength, which can resolve either by ETH catching up (bullish) or by BTC weakening (bearish). Position-sized longs on support tests, smaller new entries until ETH leads BTC.
How to Walk It
Entry / Stop / Target structure:
- Long 2,275-2,295 pullback | Stop 2,250 | Target 2,380 | R:R 3.5:1
- Long 2,385 breakout | Stop 2,335 | Target 2,450 | R:R 1.3:1
- Short 2,470+ rejection | Stop 2,510 | Target 2,360 | R:R 2.7:1
Experience-level guidance:
Beginner: The Monday open after a Friday record close is exactly the situation where over-confidence costs money. Reduce size to half your standard. Trade only the cleanest setup from the entries above. If the tape opens against your bias, do nothing — wait for the second hour, when the institutional flow has tipped its hand.
Intermediate: Use the levels table to define the trading range. Fade the extremes with defined stops, take profits before the round-number resistance levels. Do not carry directional positions through the day if you cannot watch the tape — Monday opens are prone to fast reversals.
Advanced: The vol regime is supportive of trending moves. Defined-risk options structures around the key pivot levels capture the asymmetry cleanly. Keep notional small relative to your book — Monday after a record-close week is asymmetric speculation, not core positioning.
The Sunday Composite — How This Read Sits Inside The Cross-Asset View
This single-instrument framework read is one slice of the larger Sunday weekend synthesis. The composite takes positioning, macro, sentiment, volatility, sector dispersion and trade structure as separate analytical layers and arrives at a unified composite verdict for Monday open. Each layer below is unpacked in full.
Read the full composite for the cross-asset context driving this instrument:
The institutional positioning split — Asset Managers vs Leveraged Funds in size
PCE clearance and the macro case for Monday’s carry
The three-layer sentiment disagreement — surface greed, retail neutral, professionals hedged
The vol curve term structure and what VVIX is signalling
Sector dispersion and the breadth problem behind the record close
The Monday position-management playbook — sizing tiers and trade plans
Sunday Overwatch — the unified composite verdict
Continue Reading
The macro frame driving this read is unpacked in the weekend briefs:
Sunday Setup — Reading The Tape Into Monday Open
PCE Cleared, VIX Crushed, SPY Closed 720 — Friday Post-Close Recap
This analysis is for educational and informational purposes only. It does not constitute financial advice. Always manage your risk independently and in accordance with your own financial circumstances.
Continue with Titan Protect
Twenty-plus instruments. One framework.
We read more than twenty instruments daily across four sessions. The framework’s sunrise call landed across the day — the Pre-NY case study shows what the lines drew, what New York did, and where the read stands.
Core
£59/mo
Indicator suite plus daily framework reads.
Edge Popular
£109/mo
Core plus Shield dashboard and member-only briefs.
Elite
£179/mo
Edge plus weekly 1:1 call and early access to new tools.
Save 15% on annual billing
Want to see the framework in action? Free Explorer tier — no card required.
Join the live community: Discord channel · Shield dashboard
Education, not financial advice. Trade your own analysis.