The Ethereum Framework Journal for April 2026, newest read at the top. Each dated entry is our read on the close, kept as a living record so the framework can be judged over time. This is analysis, not financial advice.
Thursday 30 Apr 2026
Ethereum at 2,262 — ETH/BTC Ratio at December 2024 Lows, No Altcoin Rotation Live, Watching 2,300 for the Signal
Ethereum (ETH/USD) | Daily Framework Read | Thursday 30 April 2026
Ethereum’s underperformance this week is the cleanest read on risk appetite within the digital asset complex. For two consecutive sessions, ETH has sold harder than BTC on equity-linked risk events and recovered less strongly on the rebounds. The ETH/BTC ratio sits at its lowest since December 2024 — a level that tells you capital is concentrating in Bitcoin rather than rotating down the cap structure. When ETH outperforms BTC, altcoin rotation is live and risk appetite is expanding into higher-beta assets. When ETH underperforms, as it has done all week, the rotation is absent and capital is either sitting in BTC or exiting the complex entirely. ETH closed Wednesday at 2,237 from a 2,290 Tuesday close, losing 2.25 percent on a session where the NAS100 rallied nearly one percent. Thursday it sits at 2,262, recovering marginally but still below the 2,300 level that the framework identifies as the rotation signal. Until 2,300 closes, this is a hold, not an opportunity.
Thursday thesis. ETH at 2,262 is stuck in the negative range of a multi-day underperformance. The 2,300 daily close is the structural signal for rotation resuming. Below 2,300, the ETH/BTC ratio continues to compress and the altcoin recovery thesis is deferred. The question for this session is not whether to be long ETH — it is what the ETH/BTC ratio does after AAPL tonight and PCE Friday. A cool PCE that sends BTC toward 78,200 should, if the structural case for ETH is intact, send ETH to 2,400–2,450 on a ratio recovery. The risk is that correlation reversion hits ETH harder than BTC — because ETH’s market is more retail-driven than BTC’s ETF-anchored institutional base.
Where It Sits Today
Current Price
2,262
+0.38% on session
Session Range
2,236 – 2,275
39-dollar intraday swing
Wednesday Close
2,237
-2.25% on Wed session
Rotation Trigger
2,300
Daily close needed to confirm
ETH’s 5-day context: the instrument has been in a progressively tighter range since Tuesday, unable to sustain moves above 2,290 and finding support around 2,221–2,237 on every pullback. The narrow range is not the behaviour of an asset building momentum — it is the behaviour of an asset waiting for an external catalyst to resolve its direction. The external catalyst this week is the same for every instrument: AAPL tonight and PCE Friday.
The ETH/BTC ratio context is the most instructive data point. December 2024 lows means the ratio is at a level where the two largest crypto assets have diverged the most since the current bull structure began. When this ratio was at similar levels in December 2024, the subsequent move was an ETH recovery relative to BTC as the altcoin rotation began. The question is whether the conditions for that rotation are present today. They were not present on Wednesday — a tech-positive equity session did not trigger ETH outperformance. Thursday is marginally better with ETH up 0.38% versus BTC’s 0.33%, but the difference is too small to call a reversal.
What the Framework Reads
The framework read on ETH is cautious-neutral with a specific trigger condition. The trigger is a daily close above 2,300. Below 2,300, the framework does not have a directional read — the instrument is in the waiting zone between the structural floor at 2,080 and the rotation confirmation at 2,300. This is not a position-building zone. It is a watching zone.
Why 2,300 specifically? This is the level that would require ETH to retrace its entire Wednesday loss and add a further two to three percent. A close above 2,300 would require BTC to also be well above current levels, the ETH/BTC ratio to be recovering, and market participants to be actively moving capital down the crypto cap structure. That combination of conditions is the altcoin rotation signal. It does not happen on a neutral tape. It requires a genuine risk-on trigger from the macro environment — either a cool PCE, a constructive AAPL, or a combination of both.
The structural framework read on the weekly timeframe is constructive for ETH on a multi-week basis. The Q1 2026 consolidation base at 2,080 was built over three months and has not been tested by a genuine flush. The Ethereum network fundamentals — Pectra upgrade development, Layer 2 ecosystem growth, ETF flows that are smaller than BTC’s but still present — are intact. The medium-term case for ETH is about the altcoin rotation cycle resuming, and that cycle resumes when the macro environment shifts from hold-with-uncertainty to cut-with-confidence. We are not there yet but PCE tomorrow is one of the early data points on that path.
Current read: cautious-neutral below 2,300
ETH is in the no-man’s-land between the structural support at 2,080 and the rotation trigger at 2,300. The ETH/BTC ratio at December 2024 lows and the absence of altcoin rotation signal says the risk is skewed to the downside until 2,300 is reclaimed. That changes the moment the trigger fires — but the trigger has not fired yet today.
Key Levels
| Level | Price | Role | What It Means |
|---|---|---|---|
| Bull continuation target | 2,500 | Post-rotation target | If 2,300 closes and BTC breaks 78,200, ETH can recover to 2,450–2,500 over one to two weeks as the ratio normalises. |
| Rotation confirmation trigger | 2,300 | Critical resistance — must close above | Daily close above here = altcoin rotation resuming, ETH/BTC ratio recovering. This is the buy signal for ETH specifically. |
| Current price | 2,262 | No-man’s-land | Below the rotation trigger, above the structural support. No actionable setup until one of these resolves. |
| Intraday support | 2,180 | First pullback support | Intraday support on the week’s range. A bounce here with good volume is the first sign of stabilisation before the rotation trigger fires. |
| Structural quarterly support | 2,080 | Bear target / Q1 base | Break below here = ETH/BTC ratio hits 2024 lows, full altcoin risk-off confirmed. Only prints on hot PCE plus equity flush scenario. |
Three Scenarios into AAPL Plus PCE
Bull — 30%
AAPL beats with constructive guidance. PCE cool. BTC breaks 78,200. ETH finally closes above 2,300, triggering rotation. ETH/BTC ratio recovers. Target 2,450–2,500 over one to two weeks.
Sideways — 40%
In-line results on both catalysts. ETH consolidates 2,200–2,300. ETH/BTC ratio stays compressed. Rotation deferred but structural support intact. This is the base case and the most likely single outcome.
Correction — 30%
Hot PCE or AAPL miss. ETH falls harder than BTC — the institutional ETF floor is thinner for ETH. 2,180 tests first, 2,080 is the structural risk if the flush is genuine. ETH/BTC ratio hits 2024 cycle lows.
Risk Score
Risk: around 70%
ETH carries the highest risk score of the five instruments in today’s batch. Three factors drive it above BTC’s 65%. First, ETH’s institutional demand floor is thinner — the spot ETH ETF has significantly lower AUM and inflows than the BTC ETF, which means the demand absorption on a drawdown is weaker. Second, the ETH/BTC ratio at December 2024 lows signals that even within the crypto complex, capital is choosing BTC over ETH — a crowding signal that becomes a problem on a flush. Third, the correction scenario at 30% has a higher probability for ETH than for BTC because of these structural demand differences. The 70% risk score is not a reason to avoid ETH — it is a reason to size half of what you would size on BTC and to wait for the 2,300 trigger before acting at all.
How to Walk It
STANDARD SIZE — On trigger
Entry: daily close above 2,300 after PCE
Stop: 2,150
Target 1: 2,450
Target 2: 2,500
R:R approximately 2.7:1 from 2,300 entry
REDUCED SIZE — Current hold
If already positioned, hold at quarter-size with a hard stop below 2,150. Do not add before the 2,300 trigger fires and do not add before AAPL resolves tonight.
AVOID — Trading the range
Do not trade the 2,200–2,280 intraday range. The spread costs and slippage in that range, combined with the binary event risk, mean the expected value is negative for a range scalp into these catalysts.
For scalpers: The 39-dollar intraday range today (2,236–2,275) is too narrow for the risk profile of crypto scalping. Wait for a genuine directional move triggered by AAPL or PCE before taking intraday positions on ETH.
For swing traders: The ratio trade is the cleanest swing setup if 2,300 closes. Go long ETH, hedge with short BTC, capturing the ratio recovery. If the ratio returns from 0.0297 (approx) to 0.032, that is a meaningful percentage move with defined risk on both legs.
For positional traders: The Ethereum network fundamentals are intact. If you are a long-term holder, the current underperformance is part of the normal bull market rotation pattern. Hold your position. The ratio compression is the mid-cycle consolidation phase, not a structural reversal.
Beginners: If you are learning to read crypto, ETH is currently the best instrument for understanding market structure and rotation signals. Read the ETH/BTC ratio alongside the price — that single ratio tells you more about where risk appetite sits in the digital asset complex than any other single metric.
Continue Reading
Wednesday’s full Digital Flow brief — including the correlation analysis, BTC versus ETH comparison, and the three-scenario breakdown — is at our Digital Flow brief Wednesday 29 April 2026.
The broader macro context — the Fed hold, rate-cut probability collapse to 44%, and what that means for the rate path that governs the ETH bull case — is covered in our Macro Pulse brief Wednesday 29 April 2026.
Read today’s Bitcoin ticker read alongside this one — the BTC/ETH relationship is the most important context for this ETH analysis, and the Bitcoin read covers the decoupling thesis in full detail.
Today’s full session context and commodity-crypto comparative positioning is in our Pre-NY Brief Thursday 30 April 2026.
This analysis is for educational purposes only and does not constitute financial advice. Markets involve risk and capital can be lost. Always manage your risk appropriately.
Sunday 26 Apr 2026
ETHUSD Ticker Read: 2,331 With BTC Pinned And Equities At Records. The Risk Coin That Stopped Leading.
Ticker Read | Sunday 26 April 2026
Ethereum closed Friday at 2,331. The framework reads sentiment at 12 of 100, conflicting signals across asset classes, wait for clarity. Bitcoin at 77,928 is sagging while SPX prints fresh records, and ETH is the coin meant to lead in genuine bull regimes. It is not leading. The ratio versus BTC is fading and the macro week is the test.
Where We Are
| Read | Value |
|---|---|
| Last close | 2,331 |
| BTC reference | 77,928 (sagging, range-bound) |
| SOL / AVAX behaviour | 86.13 / 9.43, broken layer-one tape |
| Recent range | 2,250 to 2,460 |
| Range location | Lower-mid third, closer to support than resistance |
| Framework sentiment | 12 of 100, caution, conflicting signals |
| ETH / BTC ratio | Fading, smart-coin trade losing the bid |
Structural Read
The chart shows a clean Fibonacci retracement that held and bounced earlier in the swing, then the most recent bar printing a small break of structure to the downside. The bounce was real, but the next leg up needs follow-through that has not arrived. Buyers stepped in on genuine demand, not panic covering, yet structure has not confirmed. Longs get managed toward the redline rather than held with conviction.
The asymmetry is range location. ETH at 2,331 sits closer to the value-area floor than the upper edge. In a defensive regime, the assets nearer to support bounce sharper on relief and bleed less on continuation. ETH is the cleaner long expression inside crypto for that reason, even when the backdrop says caution.
ETH-BTC Ratio Context
ETH and BTC are not the same trade. BTC is the reserve coin, the safe corner inside crypto. ETH is the smart-coin trade, the staking-secured, ETF-flowed asset institutions allocate to beyond the digital-gold thesis. When ETH leads BTC, the asset class is risk-on. When ETH lags BTC, capital rotates to safety and the speculative tail dies first.
The current read is the second one. ETH heavy, BTC pinned, ratio fading across the last sessions, SOL at 86 and AVAX at 9.43 confirming the broader board. It is risk-off inside crypto. Until the ratio firms, the asymmetric trade in ETH is a tactical bounce off support rather than a positional long expecting fresh highs.
Three Levels That Matter
| Level | Read |
|---|---|
| 2,460 upper | Range high. Clean break opens 2,520 then 2,600. Needs the ETH-BTC ratio firming and BTC reclaiming 80,000. Without that, sell zone. |
| 2,331 pivot | Friday close, framework redline. Hold above on Monday Asia and the bounce thesis stays alive. Daily close below shifts tape neutral. |
| 2,250 lower | Value-area floor, the bounce level. Below here long structure cancels and 2,180 then 2,100 open. Layer-one contagion lands first here. |
Two Trade Ideas
Idea One. Long bounce off the value-area floor
Time horizon: swing into Friday close. Risk score: around 55 percent.
Entry: 2,290 to 2,320 on a clean retest. Stop: 2,245. Target one: 2,460. R:R: 1:2.4.
Kill: Daily close below 2,250 cancels. BTC breakdown through 75,000 takes the trade off regardless of the ETH chart.
Idea Two. Short failure at the range high
Time horizon: swing into next Sunday. Risk score: around 60 percent.
Entry: 2,440 to 2,470 only on a rejection wick below 2,460. Stop: 2,510. Target one: 2,260. R:R: 1:3.2.
Kill: Daily close above 2,460 on rising volume with ETH-BTC ratio firming. Asset class has reabsorbed the bid.
Time Horizons
| Horizon | Stance |
|---|---|
| Intraday (Asia and London Monday) | Trim longs into strength. Buy weakness only at the value-area floor with a tight stop. Avoid the middle. |
| Swing (into Friday) | Event-driven. Mag 7 prints and Powell set the tone. Size small until the reaction lands. |
| Position (next two to four weeks) | Lean constructive only if the ETH-BTC ratio firms and BTC reclaims 80,000. Otherwise sideways-to-lower while the asset class digests. |
Catalyst Map
The macro stack. Powell’s final press conference lands Wednesday alongside the Mag 7 earnings cycle. Crypto reads the same option-tape caution equity hedgers are pricing. A hawkish Powell or a Mag 7 disappointment pushes risk assets lower in tandem and ETH is the coin most likely to break the floor first. A dovish lean or a clean Mag 7 print reopens the asset class and the bounce gets the follow-through it has been missing.
ETH-BTC rotation. The single most important read for the week. If the ratio firms while BTC holds 78,000, ETH leads on relief and the long idea pays. If the ratio keeps fading and BTC rolls over, ETH leads on the way down too because the weakest layer-one is the one that gets sold first.
ETF flows. IBIT sideways into Powell, MSTR at 171 heavy. The institutional bid is not feeding back into crypto, and ETH ETF flows have not provided the structural buyer the bull thesis needs.
Risk Score: around 60 percent
- +20 percent ETH-BTC ratio fading, the smart-coin trade is losing its bid
- +15 percent layer-one tape broken, contagion risk into ETH is real
- +10 percent macro stack delivers the catalyst that resolves the divergence
- +10 percent ETF passive flow muted, structural buyer absent this week
- +5 percent framework sentiment at 12 of 100, caution flagged
- −10 percent value-area floor held with a confirmed bounce
- −10 percent range location closer to support gives asymmetric entry on relief
Event-pinned and ratio-pinned. Cut working size in half until BTC and the ETH-BTC ratio confirm the same direction inside the week.
What We Called vs What Happened
| Call (22 Apr) | Outcome (by 26 Apr) | Verdict |
|---|---|---|
| Long, target $2,500 then $2,600 with own momentum and BTC correlation. | Spot drifted from $2,395 to $2,331 over the four sessions. Neither target tagged. Direction wrong on the leg. | Missed |
| Outperforming BTC, altcoin rotation gaining confidence. | ETH fell roughly 2.7 percent while BTC fell roughly 0.7 percent. The ratio faded across the run rather than firmed. | Reversed |
| Use the $2,300 to $2,340 pullback band for entries. | Friday close at $2,331 sits inside the zone after the pullback played out cleanly. | Confirmed |
| Structural support at $2,200 holds the higher-low structure. | Lows held above $2,250 across the window. Support untested. | Confirmed |
| Stop below $2,100 invalidates the breakout. | Never threatened. Stop sat untouched. | Confirmed |
Track record: three of five calls confirmed over the four-session window, with the upside thesis missed and the BTC outperformance call reversed because the ratio faded rather than firmed across the run.
This is analysis, not financial advice. Always manage your risk.
Thursday 23 Apr 2026
Daily Framework Read | Thursday 23 April 2026 | Published 22:00 London / 17:00 New York / 07:00 Tokyo
ETHUSD
Ethereum $2,326 -2.12%
Ethereum underperformed Bitcoin again, dropping over 2% while BTC fell less than half a percent. The ETH/BTC ratio continues to decline, reflecting a preference for Bitcoin among institutional allocators. ETH is struggling to hold $2,300 and the weakness is becoming a pattern rather than an anomaly.
Framework Read
| Layer | Reading | Interpretation |
|---|---|---|
| Direction | NEUTRAL-CAUTIOUS | Underperforming BTC. Needs to reclaim $2,400 for bullish |
| Structure | Weakening | Lower highs forming. $2,200 support critical |
| Momentum | Bearish short-term | Consistent underperformance versus BTC is a red flag |
| Flow | Outflows | ETH ETF flows weaker than BTC ETF flows |
| Evidence | Cautious | Wait for BTC ratio to stabilise before committing |
Yesterday vs Today
Yesterday ETH rallied with the risk-on move. Today it gave back more than twice what BTC gave back. This relative weakness pattern has persisted for weeks. ETH participates less on up days and more on down days. That is the signature of an asset losing institutional conviction.
The Read
ETH has a narrative problem. BTC has the store-of-value and ETF inflow story. ETH’s layer-2 fragmentation, staking yield compression, and competition from Solana are weighing on sentiment. Until a fresh catalyst emerges, ETH will underperform BTC. The $2,200 level is the last line of defence before $2,000 becomes the target.
The call: neutral. Do not buy ETH here until the BTC ratio stabilises. If $2,200 breaks, short targets open toward $2,000. Above $2,400, the picture improves.
Key Levels
| Level | Price | Significance |
|---|---|---|
| Resistance 2 | $2,500 | Major resistance |
| Resistance 1 | $2,400 | Must reclaim for bullish case |
| Current | $2,326 | Drifting toward support |
| Support 1 | $2,200 | Critical support level |
| Support 2 | $2,000 | Psychological and breakdown target |
| Support 3 | $1,850 | Deep support on monthly |
What We Called vs What Happened
The framework flagged ETH underperformance versus BTC as a concern. Today confirmed that pattern with ETH falling 5x more than BTC. The cautious stance was correct. No position was warranted.
Risk Assessment
Domain risk: Around 55% (elevated)
ETH risk is elevated due to persistent underperformance, weakening structure, and declining institutional interest relative to BTC. The $2,200 support is critical. A break below opens significant downside. Avoid until the ratio stabilises.
Bottom line: ETH underperforming BTC again with a 2% decline. The trend of relative weakness persists. Stay neutral until $2,400 reclaimed or $2,200 tested and held. No edge in buying ETH while it underperforms BTC on every move.
Cross-reference: Today’s Crypto Report for altcoin analysis and on-chain data.
This is analysis, not financial advice. Always manage your risk.
Thursday 23 Apr 2026
Daily Framework Read | Wednesday 22 April 2026 | Published 22:00 London / 17:00 New York / 07:00 Tokyo
ETH/USD
Ethereum $2,395 +2.87%
Ethereum gained 2.87%, slightly outperforming Bitcoin. The framework says LONG. Ethereum is riding two tailwinds: the correlated BTC breakout and its own momentum from network activity and staking demand. When ETH outperforms BTC, it typically signals that the altcoin rotation is gaining confidence. That is a risk-on signal within the crypto ecosystem.
Framework Read
| Layer | Reading | Interpretation |
|---|---|---|
| Direction | LONG | Correlated BTC breakout plus own momentum. Dual catalyst |
| Structure | Breaking higher | Reclaimed $2,350 and pushed through. Structure is constructive |
| Momentum | Strong | Outperforming BTC today. Momentum is accelerating on its own merit |
| Flow | Risk-on rotation | Capital rotating from BTC into ETH. Classic altcoin risk-on signal |
| Evidence | Aligned bullish | BTC correlation plus own momentum. Both demand pillars active |
Yesterday vs Today
Yesterday Ethereum drifted lower in sympathy with the broader crypto pullback. Today it bounced harder than Bitcoin, gaining 2.87% versus BTC’s 2.82%. That slight outperformance matters because it shows Ethereum is building its own bid alongside the BTC correlation. Network upgrades and staking demand are creating a fundamental floor that did not exist in previous cycles.
The Read
Ethereum has two things working for it: the BTC correlation that lifts all crypto when Bitcoin rallies, and its own fundamental demand from DeFi, staking, and network activity. When both are active, ETH tends to outperform. Today was one of those days. The key question is whether this outperformance sustains or whether it was a one-day event.
The call: long. The BTC breakout provides the macro tailwind and ETH’s own momentum provides the idiosyncratic bid. Any pullback to $2,300-2,340 is a buying zone. Target $2,500 as the next psychological level.
Key Levels
| Level | Price | Significance |
|---|---|---|
| Target 2 | $2,600 | Measured move target on sustained breakout |
| Target 1 | $2,500 | Psychological round number. First major test |
| Entry Zone | $2,300-2,340 | Pullback entry. Prior breakout zone |
| Support | $2,200 | Structural support. Higher low zone |
| Stop Zone | $2,100 | Below here, the breakout has failed |
What We Called vs What Happened
The framework was long ETH on the BTC correlation thesis. Today’s outperformance added the own-momentum component. Both pillars are now active. The long call was correct and the position is strengthening.
Risk Assessment
Domain risk: Around 35% (low-moderate)
ETH carries more volatility than BTC but the dual catalyst setup reduces the risk. If BTC sells off, ETH will sell harder. That is the correlation risk. But with both demand pillars active, the floor is higher than it would be on BTC correlation alone.
Bottom line: Ethereum is long with dual catalysts: BTC correlation plus own momentum. Today’s outperformance vs Bitcoin is constructive. Target $2,500-2,600. Entry on pullbacks to $2,300-2,340. Stop below $2,100. The altcoin rotation is gaining confidence.
Cross-reference: Today’s Crypto Report for ETH/BTC ratio analysis and network activity data.
This is analysis, not financial advice. Always manage your risk.
Tuesday 21 Apr 2026
Daily Framework Read | Tuesday 22 April 2026
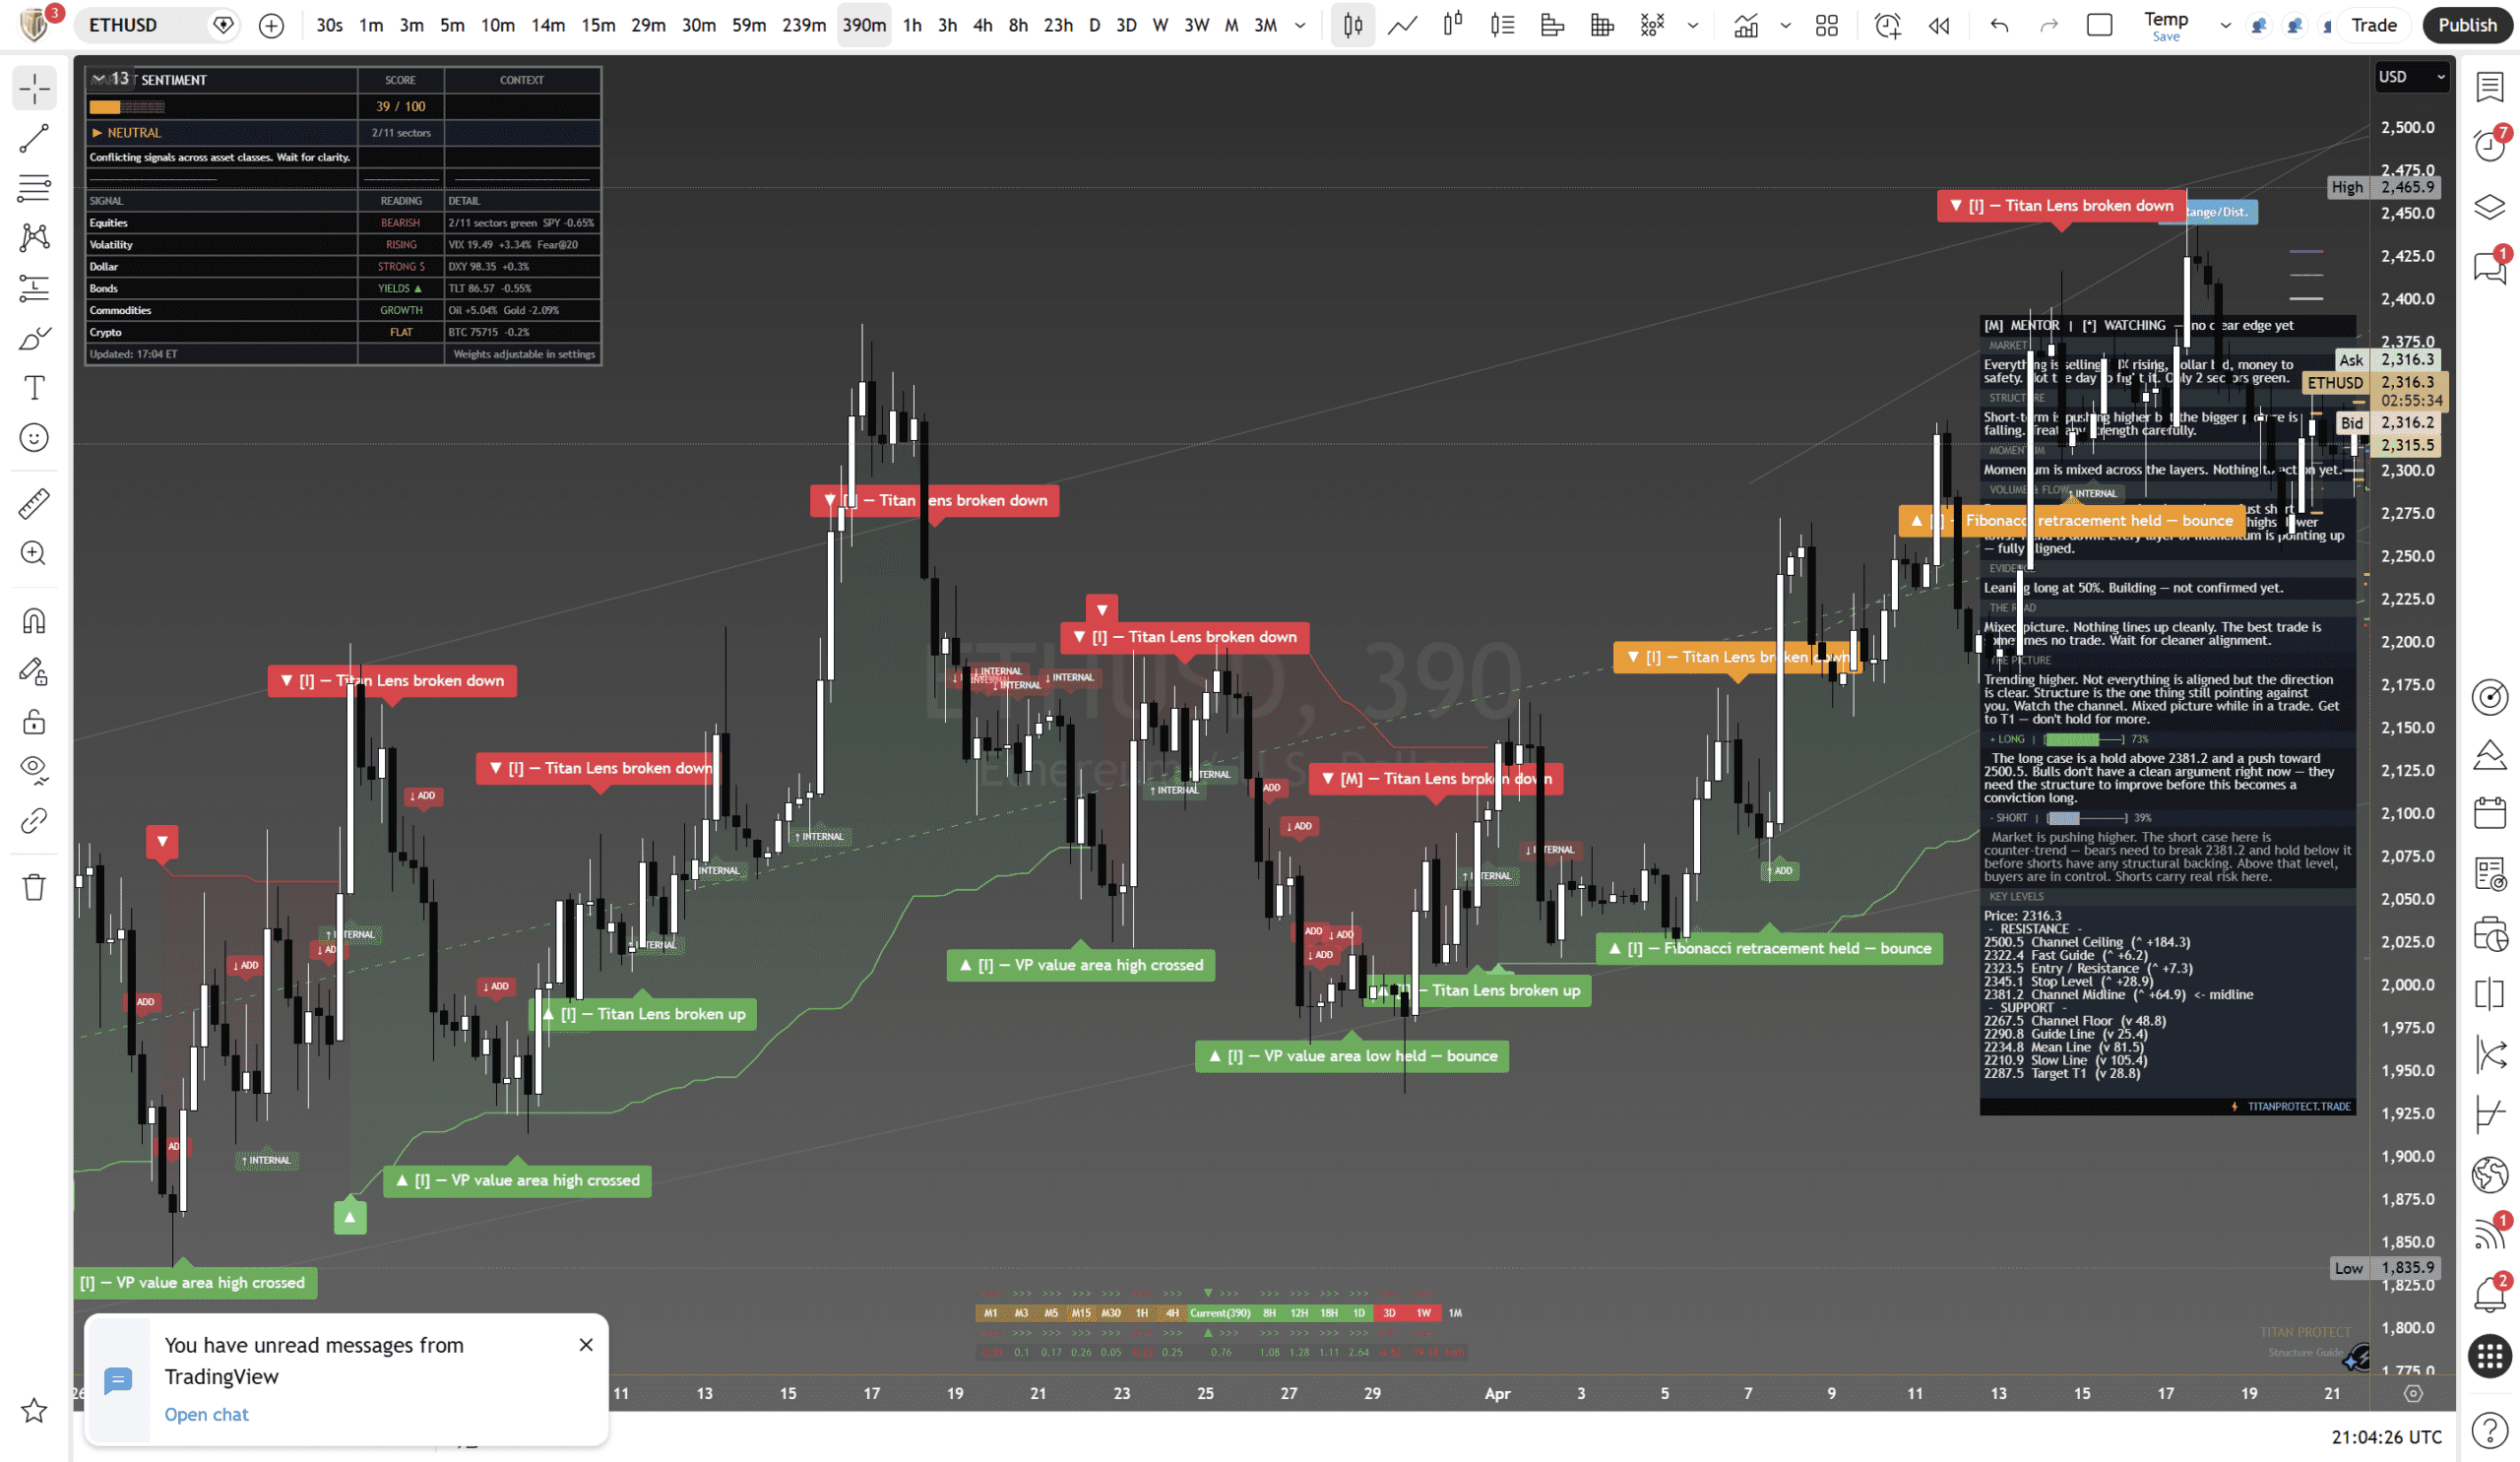
Ethereum is bucking the trend slightly — up while Bitcoin falls. The relative strength is improving. Structure shows a retracement that held at support, which is constructive. But the macro picture remains unclear with mixed signals across timeframes. Nothing is confirmed yet — this is a watch-and-wait situation.
Structure
Macro holds long but the direction has not been declared yet. Everything is still pointing higher on the bigger picture but the shorter timeframes are pulling against it. Retracement held at support, which is constructive.
Momentum and Flow
Mixed. Higher timeframes have a slight long bias but the shorter timeframes are selling. The retracement holding is positive but not enough for a trade entry.
Light. Neither side committed. Watch for a volume spike to confirm direction. The lack of conviction cuts both ways.
The Two Cases
Retracement held at support. Higher timeframes favour longs. Outperforming Bitcoin is a positive sign. Need confirmation from a break above 2,391 to act.
A hold below 2,391 and a push toward 2,285. Bears do not have a clean declaration yet — structure needs to break down before this becomes a conviction trade.
Key Levels
| Resistance | 2,450 | Channel Ceiling |
| Resistance | 2,391 | Entry / Resistance |
| Pivot | 2,376 | Current Price |
| Support | 2,285 | Channel Midline |
| Support | 2,200 | Guide Line |
| Support | 2,100 | Channel Floor |
Market Context
ETH +0.21% ($2,376). Outperforming BTC. Relative strength improving. Risk-off macro but crypto sector rotation possible.
Analysis from our institutional research desk. Educational content only — not financial advice. Market data as of 21 April 2026. Past performance is not indicative of future results. All trading involves risk — manage yours. Independent analysis — no affiliation with any broker. Always do your own research before trading.