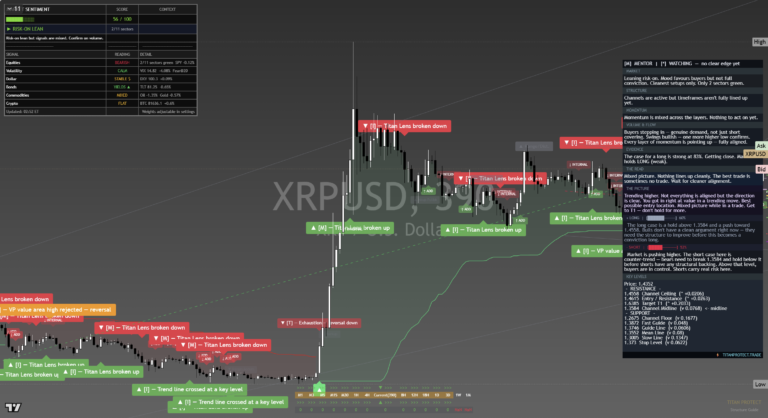
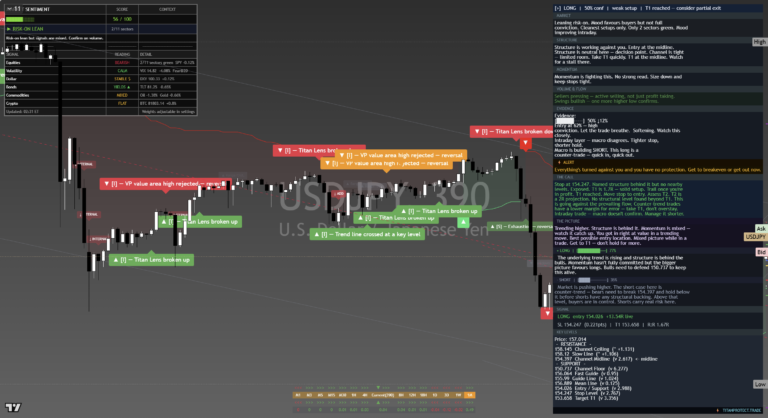
The Ethereum Framework Journal for June 2026, newest read at the top. Each dated entry is our read on the close, kept as a living record so the framework can be judged over time. This is analysis, not financial advice.
Tuesday 30 Jun 2026
Ethereum (ETH/USD)
Daily Framework Read | Tuesday 30 June 2026
Q3 Day 2
CONFIDENCE
Low
RISK FACTOR
7.5%
Framework Interpretation
Structure
Monday Ethereum was bearish with moderate confidence. Today it has shifted to watching with low confidence. The daily chart shows the Mentor reading WATCHING with no clear edge yet. The trend line crossed at a key level, confirming the structural deterioration. The cloud sits overhead as resistance. But the VP value area high was rejected, and a range rejection pattern is forming. Every timeframe is falling together, which is organised, but the pullback structure is showing signs of buyers stepping in. The framework sees this as a market in transition.
Momentum
Momentum is mixed across the layers. Nothing to act on yet. The Mentor reads this as a market where nothing lines up cleanly. The best trade is to wait. The underlying trend is still down but the momentum is not confirming a fresh push lower. The selloff is mature and exhaustion signals are emerging. The framework is telling you the easy money has been made on the short side and a new thesis needs to develop.
Volume
Sellers pressing but active selling is slowing. Not just short covering but genuine demand at lower levels is emerging. The volume profile shows the pullback is orderly with institutional activity visible on both sides. The setup is transitioning from distribution to early-stage balance. Neither side has clear dominance, which is why the framework shifted from bearish to watching.
The Call
Watching with low confidence. Monday was bearish and today the framework has stepped back. The underlying trend remains down but buyers are starting to emerge at these levels. The Mentor says the pullback is a downtrend, not a crash, and it needs to see the structure improve before calling a reversal. The long case requires a hold above the current zone and a push towards the value area high. The short case is a further breakdown below recent lows. Neither has confirmed. Month-end and quarter-end flows add noise to both scenarios.
Key Levels
| Level | Price | Significance |
|---|---|---|
| Resistance 2 | 1,950 | Cloud base, trend-reversal confirmation |
| Resistance 1 | 1,825 | Value area high, near-term ceiling |
| Current Price | ~1,720 | Below cloud, range rejection forming |
| Support 1 | 1,650 | Near-term demand, buyer absorption |
| Support 2 | 1,500 | Major structural floor, channel base |
Risk Assessment
HIGH
24/7 market + regime uncertainty + DeFi correlation risk + quarter-end
Risk is high because Ethereum carries both the crypto market regime risk and its own ecosystem-specific risks. DeFi protocol activity, Layer 2 dynamics, and staking yield changes can all impact ETH independently of Bitcoin. The shift from bearish to watching reduces directional clarity, which itself is a risk. The 24/7 market means the resolution can come at any time.
Scenario Analysis
Bull Case
20%
Hold 1,650 and push towards 1,825, reclaim value area
Sideways
35%
Range 1,650-1,825 as market builds a base or distributes
Correction
35%
Break below 1,650 targeting 1,500 structural floor
Black Swan
10%
DeFi exploit, regulatory action, or ETH-specific catalyst
Position Sizing Guidance
STANDARD
REDUCED
AVOID
Low confidence with no directional edge means avoid new positions. The shift from bearish to watching is the framework telling you the prior thesis has weakened but a new one has not formed. If you shorted on Monday’s bearish read, the framework is no longer actively supporting that position. Consider tightening stops or flattening. Wait for the framework to resolve before committing new capital in either direction.
Experience-Level Guidance
Beginner
Ethereum was bearish yesterday and is now watching. That shift means the framework is no longer confident in the downside call. This is not a buy signal. It means the picture has become unclear and both sides have arguments. When the analysis says watching, it is telling you the smartest position is no position. Ethereum is complex with its own ecosystem dynamics beyond just the price chart. Let the framework tell you when to act.
Intermediate
The shift from bearish to watching is the framework telling you the selling pressure is exhausting. That does not mean bottom, it means transition. The 1,650-1,825 range is the near-term battlefield. A clean reclaim of 1,825 with volume shifts the read bullish. A breakdown below 1,650 reconfirms the bearish thesis. Plan both scenarios with defined risk. ETH/BTC ratio is worth monitoring as a relative strength indicator. If ETH is outperforming BTC during this correction, that is a subtle bullish signal for the altcoin complex.
Advanced
The framework has stepped back from Monday’s bearish call. The trend line cross at a key level is bearish, but the value area rejection and early buyer activity create conflict. This is a transition zone. The DeFi ecosystem health, staking yields, and Layer 2 activity are ETH-specific fundamentals that the chart framework captures indirectly through volume and flow data. For directional plays, wait for the range to resolve. For volatility plays, the elevated implied vol on ETH options creates opportunities. The 1,500 structural floor is the level that changes the conversation from correction to capitulation. Watch BTC closely as the correlation remains high in bear regimes.
This content is for informational and educational purposes only. It does not constitute financial advice, investment recommendations, or a solicitation to trade. All trading involves risk. Past performance does not guarantee future results. Always conduct your own research and consult a qualified financial adviser before making investment decisions. Titan Protect is not responsible for any losses incurred from acting on this information.
Tuesday 30 Jun 2026
Ethereum (ETH/USD)
Daily Framework Read | Monday 29 June 2026
Q3 Day 1
CONFIDENCE
Moderate
RISK FACTOR
7.8%
Framework Interpretation
Structure
Ethereum on the daily chart shows the framework reading MOSTLY SHORT with the trend running out of steam. The value area high has been rejected, a range-bound label is visible, and price is sitting in a contested zone between support and resistance. Every timeframe is falling together, which is bearish, but not yet organised into a decisive breakdown. The trend line has crossed at a key level, reinforcing the structural caution.
Momentum
Momentum is fading within the bearish structure. The framework flags the trend as running out of steam, which means momentum is fading rather than accelerating. This is an important distinction. A fading trend can still move lower, but the velocity is declining. Buyers are not stepping in with conviction, but sellers are also not pressing as hard as the structure would suggest they should. The internal readings need the structure to deepen before this becomes a higher-conviction call.
Volume
Confidence is split. No clear edge right now on volume. Macro holds but micro is indecisive. The volume profile shows a market that is distributing from higher levels but not yet capitulating lower. The implication is that this is a slow grind lower rather than a sharp correction, unless a catalyst accelerates the move.
The Call
Bearish with moderate confidence, but fading. The analysis reads the trend as losing power but still directionally lower. Ethereum is underperforming Bitcoin on this cycle, which is a relative weakness signal. The long case requires a hold above the current support and a push toward the value area high. Until that happens, the framework leans short. Q3 Day 1 ETH ETF flow data and the broader crypto risk sentiment are the catalysts to watch.
Key Levels
| Level | Price | Significance |
|---|---|---|
| Resistance 2 | 1,950 | Cloud base, major overhead supply |
| Resistance 1 | 1,830 | Value area high, rejection zone |
| Current Price | ~1,760 | Below value, range-bound zone |
| Support 1 | 1,680 | Near-term demand, trend line confluence |
| Support 2 | 1,500 | Channel floor, major structural support |
Risk Assessment
HIGH
Fading trend + relative weakness vs BTC + ETF flow uncertainty + 24/7 market
Ethereum carries the highest risk in today’s crypto batch. The fading trend means the bearish case could either accelerate or reverse. Relative weakness versus Bitcoin adds a layer of uncertainty about whether ETH-specific factors are driving the underperformance. ETF flow data, DeFi narrative shifts, and network upgrade expectations all add to the complexity.
Scenario Analysis
Bull Case
20%
Reclaim 1,830 VAH, ETF inflows, DeFi narrative returns
Sideways
30%
Range 1,680-1,830 as fading trend grinds
Correction
40%
Break below 1,680, acceleration toward 1,500 floor
Black Swan
10%
Smart contract exploit, regulatory ban, or ETH ETF delisting
Position Sizing Guidance
STANDARD
REDUCED
AVOID
Moderate confidence with a fading trend warrants reduced sizing. The bearish lean is there but the momentum is losing power, which creates uncertainty about timing. If already positioned bearish, tighten stops above 1,830. If flat, wait for either a confirmed break below 1,680 or a rejection at 1,830 before committing. The fading nature of the trend means patience pays.
Experience-Level Guidance
Beginner
Ethereum is in a slow downtrend that is losing momentum. This is confusing because it is not crashing but it is not rallying either. The framework says bearish but fading. For beginners, the lesson here is that not every downtrend is a cliff edge. Some are slow grinds. Do not try to catch a bottom in a fading downtrend. Wait for the framework to flip before considering buying.
Intermediate
ETH relative weakness versus BTC is a signal worth tracking. If ETH is underperforming in a risk rally, it suggests ETH-specific selling pressure. The 1,680 support is the line in the sand. A clean break targets 1,500. If the 1,830 VAH is reclaimed, the bearish thesis weakens. Track the ETH/BTC ratio for relative clues before taking a directional view.
Advanced
Fading bearish trend with split confidence is classic late-stage distribution. The question is whether it resolves into acceleration or reversal. The ETH/BTC pair tells the story of relative flows. If BTC holds while ETH breaks 1,680, the sector rotation into BTC dominance accelerates. If both rally, the bear thesis is invalid. Watch Q3 Day 1 ETH ETF flows and DeFi TVL for institutional positioning clues. Options implied vol on ETH is higher than BTC, which may create relative value opportunities in vol strategies.
This content is for informational and educational purposes only. It does not constitute financial advice, investment recommendations, or a solicitation to trade. All trading involves risk. Past performance does not guarantee future results. Always conduct your own research and consult a qualified financial adviser before making investment decisions. Titan Protect is not responsible for any losses incurred from acting on this information.
Sunday 28 Jun 2026
Ethereum (ETH/USD)
Daily Framework Read | Sunday 28 June 2026
Launch Edition
CONFIDENCE
Moderate
RISK FACTOR
7.2%
Framework Interpretation
Structure
Ethereum is showing clearer bearish structure than Bitcoin on the daily timeframe. The analysis reads structure as behind the sell, with price having rejected at the value area high and broken below a trend line. The pattern suggests organised selling rather than random volatility. Every timeframe is falling together, which the framework interprets as an aligned bearish signal.
Momentum
Risk appetite is fading and the analysis reads momentum as muted across the layers. This is not aggressive selling, but it is persistent. Favour cash, the analysis says, which translates to: even if you are bearish, do not overcommit. The pace of decline suggests distribution rather than panic.
Volume
Sellers are pressing with active selling and profit taking. The analysis reads this as genuine demand erosion, not just a pause. The selling pressure is building, and the case for a short is stronger on this front. However, it is not yet at the capitulation levels that would signal a climax.
The Call
MOSTLY SHORT with moderate confidence. Ethereum is the weakest major crypto in today’s batch. The framework sees the setup as bearish with structure, momentum, and volume aligning more than elsewhere. The short case is to sit tight at current levels, watch selling pressure build, and look for the breakdown confirmation. The price for a short is strong at current levels, with the framework identifying clear invalidation zones above.
Key Levels
| Level | Price | Significance |
|---|---|---|
| Resistance 2 | 2,650 | Value area high rejection, invalidation zone |
| Resistance 1 | 2,580 | Broken trend line, near-term overhead |
| Current Price | ~2,500 | Below broken support, sell zone active |
| Support 1 | 2,380 | Prior consolidation demand zone |
| Support 2 | 2,200 | Major structural floor, channel floor |
Risk Assessment
HIGH
BTC correlation drag + DeFi sensitivity + 24/7 liquidity thinning
Ethereum’s risk is compounded by its high correlation with Bitcoin and its additional sensitivity to DeFi protocol activity and gas fee dynamics. The 24/7 market amplifies weekend moves, and thin liquidity can create outsized candles that trigger stops. The more aligned bearish read increases directional risk for anyone positioned against the call.
Scenario Analysis
Bull Case
15%
BTC recovery leads ETH higher, reclaim 2,580 on volume
Sideways
25%
Range 2,380-2,580 through weekend, distribution continues quietly
Correction
50%
Selling accelerates, test of 2,380 and potentially 2,200
Black Swan
10%
DeFi protocol failure, regulatory action, or BTC cascade sell-off
Position Sizing Guidance
STANDARD
REDUCED
AVOID
Moderate conviction on the short side, but high risk means reduced sizing. The framework supports the bearish lean enough to warrant participation, but not enough to justify full-size positions heading into a weekend. Keep stops tight and accept that weekend liquidity can run them.
Experience-Level Guidance
Beginner
Ethereum is showing bearish signals and the framework is leaning short. For beginners, this means: do not buy the dip. When the analysis reads MOSTLY SHORT, adding long exposure goes against the analytical evidence. If you hold ETH, review your risk tolerance and consider whether your position size matches the current environment. Do not make emotional decisions.
Intermediate
ETH is underperforming BTC in this pullback, which is typical of higher-beta crypto during risk-off periods. The 2,380 support is the key level. If it holds, this could be a buying opportunity within a larger uptrend. If it breaks, the 2,200 floor becomes the target. Plan for both scenarios before Monday and know your risk on each.
Advanced
Ethereum’s cleaner bearish alignment compared to Bitcoin makes it the more interesting short in the crypto complex. The framework sees organised selling with every timeframe falling together. Watch for a bounce towards 2,580 broken trend line for a short entry with a tight stop. If the breakdown is confirmed, the ETH/BTC ratio may also weaken, offering a relative-value opportunity. DeFi TVL data and staking flows are the on-chain indicators to monitor over the weekend.
This content is for informational and educational purposes only. It does not constitute financial advice, investment recommendations, or a solicitation to trade. All trading involves risk. Past performance does not guarantee future results. Always conduct your own research and consult a qualified financial adviser before making investment decisions. Titan Protect is not responsible for any losses incurred from acting on this information.
Thursday 25 Jun 2026
Titan Crypto Desk · Daily Framework Read · Thursday 25 June 2026
Ethereum (ETH/USD): Short Signal at 56% With Cascading Lane Breaks and Structural Deterioration
Confidence: Around 56%
Partial Exit
Yesterday vs Today
| Signal | Short (Wednesday) | SHORT (Thursday) |
| Shift | Short maintained. ETH is tracking BTC’s weakness with cascading lane breaks to the downside and value area high crossed lower. Structure is mixed with both down and recovery labels. The framework notes building momentum to the downside. Entry within the trade framework is getting closer to the shorter basis. Partial exit flagged. | |
Daily Read
Ethereum is tracking Bitcoin’s weakness with a short signal at 56% confidence. The chart shows cascading lane breaks to the downside, with structure building on the short side. Every layer of momentum is building, and everything is aligned but the direction is down.
ETH’s selling is less pronounced than BTC’s 2.9% drop, suggesting some relative resilience, possibly from DeFi-specific demand or staking yield support. But the framework does not distinguish between the cause of the selling, only the structure, and the structure says short.
The partial exit flag means the short is approaching maturity. Lane breaks have cascaded through multiple levels and the next meaningful support zone is below. Any bounce attempt will face the overhead structure from the week’s breakdown. The framework advises managing existing positions rather than adding at these levels.
Key Levels
| Level | Price | Significance |
|---|---|---|
| Resistance | 3,450 | Overhead from breakdown, short invalidation |
| Current Zone | 3,200 – 3,350 | Active short zone, partial exit |
| Support | 3,000 | Psychological level, major demand zone |
Risk Assessment
Around 70%
Elevated risk. Crypto-wide selling with BTC leading. Liquidation cascades possible. 24/7 market means no respite. Partial exit territory for existing shorts. New entries carry worse risk-reward than earlier in the move.
What to Watch Today
- BTC direction as the primary correlation driver for ETH
- ETH/BTC ratio for relative strength assessment
- DeFi TVL and staking flows for ETH-specific demand signals
- 3,000 psychological level as the next major test
This daily read is produced by the Titan Crypto Desk for educational and informational purposes only. It does not constitute financial advice or a recommendation to buy or sell any instrument. All levels and scenarios are analytical reference points, not trading instructions. Past performance of any level or scenario is not indicative of future results. Always apply your own risk management. Capital is at risk.
Wednesday 24 Jun 2026
Titan Digital Desk | Daily Framework Read | 24 June 2026
Ethereum (ETH/USD): Structure Collapsing as Altcoin Selling Accelerates
Spot: $2,575 | Day Change: -3.59% | Session: Pre-London
Daily Read
SHORT – Consider Partial Exit
Structure is behind the move. Read this carefully. Entry at the midline. Structure is bearish. Declined point reached. Every layer of resistance is pointing down. Active selling, not just profit-taking. The trend line has crossed at a key level.
Yesterday vs Today
Monday 23 June
ETH was already showing weakness as the altcoin complex came under pressure. The risk-off rotation in equities was spilling into crypto. The value area high had been tested and was showing signs of failing.
Tuesday 24 June
Down 3.59%, significantly worse than Bitcoin’s 2.37%. Multiple lens levels have broken down in sequence. The trend line has crossed at a key level. Structure is emphatic. This is a confirmed breakdown.
The Read
Ethereum is at $2,575 and the chart looks bad. Not ambiguous. Not mixed. Bad. Multiple lens levels have broken to the downside in rapid succession. The trend line has crossed at a key level. The value area high was crossed. This is a confirmed structural breakdown and the framework is reading it accordingly.
The 3.59% decline is worse than Bitcoin’s 2.37%, which tells you the altcoin risk-off is more severe than the headline crypto decline. ETH is underperforming BTC, and when that happens during selloffs, it typically means the risk appetite within crypto is deteriorating rapidly. The BTC/ETH ratio widening is a classic late-cycle signal in digital assets.
The chart shows a clear sequence of breakdowns. Each lens level was tested, failed, and became resistance on the way down. The right-hand panel is explicit: structure is working against the price. Sit down and keep stops tight. Momentum is aligned to the downside. Active selling rather than passive profit-taking. That distinction is important because active selling tends to have more follow-through.
The lower section of the chart shows the underlying trend is falling and structure is behind the move. The trend needs to hold above a critical support area or the move extends further. The framework is flagging this as a short with a recommendation to consider partial exits, which means the move is getting extended but the direction remains clear.
From a cross-asset perspective, ETH’s decline is consistent with the broader tech selloff. The tech sector fell 3.80% yesterday, and ETH often trades as a leveraged proxy for tech sentiment given the overlap in investor base. When tech investors deleverage, ETH tends to get sold harder than BTC because of the higher beta.
The question is where does ETH find a floor. The next meaningful support zone is around $2,450 to $2,500. Below that, the $2,350 level represents a prior consolidation base. Any bounce into the $2,650 to $2,700 zone should be viewed as a selling opportunity rather than a trend reversal until the framework confirms otherwise.
Key Levels
| Level | Price | Significance |
|---|---|---|
| Resistance | $2,700 | Broken lens level, sell zone on retests |
| Resistance | $2,650 | Prior support now flipped, overhead supply |
| Current Price | $2,575 | Below broken structure, short confirmed |
| Support | $2,500 | Psychological round number |
| Support | $2,450 | Prior consolidation base, trend line crossed |
Downside Risk
Around 65%
Structure confirmed, active selling, altcoin weakness
Bounce Risk
Around 35%
Extended move, partial exit suggested
Scenario Analysis
Bear Case (Primary – Around 55%)
ETH breaks $2,500 and extends toward $2,450 or lower. The altcoin selloff deepens, BTC/ETH ratio widens further, and ETH underperforms the crypto complex. Tech sector weakness provides no relief.
Base Case (Around 30%)
ETH holds above $2,500 on a closing basis and consolidates. The selling stalls as the move becomes extended. Range-bound between $2,500 and $2,650 as the market digests the decline.
Bull Case (Around 15%)
Broader risk sentiment stabilises and crypto produces a sharp relief rally. ETH reclaims $2,700 on short covering. Requires BTC to lead and equities to find a floor.
What to Watch Today
- ►Whether $2,500 psychological level holds on a closing basis
- ►BTC/ETH ratio for relative strength deterioration signal
- ►Tech sector direction as the correlation proxy
- ►DeFi TVL changes for on-chain demand signals
This daily read is produced by the Titan Digital Desk for informational and analytical purposes only. It does not constitute financial advice or a recommendation to buy or sell any financial instrument. Markets can move against any framework. Always apply your own risk management. Capital is at risk. Titan Protect Limited.
Tuesday 23 Jun 2026
Titan Macro Desk | Daily Framework Read | 23 June 2026
Ethereum (ETH/USD): Following Bitcoin Lower With Extra Downside
Session Context: BTC -2.3% | Broad Risk-Off Day 2 | VIX 19.9
Framework Read
BEARISH – High Beta to BTC Decline
Ethereum tracks Bitcoin in direction but with greater magnitude. In a sustained risk-off environment, ETH typically underperforms BTC. Today follows that pattern.
The Read
Ethereum and Bitcoin move together but they do not move equally. ETH carries higher beta to BTC in both directions. When BTC falls 2.3%, ETH is typically down more. That dynamic plays out today as the broader risk-off environment weighs on the entire crypto complex, with Ethereum taking proportionally more of the impact.
The reason for this asymmetry is market structure. Bitcoin has more institutional ownership through ETFs, futures markets, and direct institutional custody. That institutional base provides a degree of price support in drawdowns because institutions have longer time horizons and more disciplined position management. Ethereum, while also institutionally owned, has a larger proportion of retail and DeFi-driven demand, which is more sentiment-sensitive and liquidates faster in risk-off environments.
Ethereum also has its own narrative that can cut both ways. The DeFi ecosystem and smart contract platform thesis gives ETH a growth-asset quality that makes it more sensitive to risk appetite changes than Bitcoin’s digital gold narrative. When markets are risk-off, growth assets are sold more aggressively than stores of value.
The ETH/BTC ratio is a useful signal today. If ETH is falling faster than BTC in percentage terms, the ratio drops and that confirms the risk-off trade is active within the crypto complex. Capital within crypto consolidating into Bitcoin is actually a sign of de-risking rather than full exodus, which provides some structural support for BTC even as ETH falls harder.
Staking yields on Ethereum provide a partial buffer. Validators and stakers have long-duration positions that do not liquidate on day-to-day price swings. This structural demand from the staking ecosystem means ETH rarely goes into freefall without a broader crypto market crisis. But it does not prevent meaningful short-term drawdowns.
The path for ETH today is substantially determined by what BTC does. If BTC holds $62,000 and equity markets stabilise, ETH may find a floor in its current zone and recover modestly. If BTC tests $60,000, ETH is likely to see a proportionally larger move lower. The two are joined at the hip in this environment.
Key Levels
| Level | Price | Significance |
|---|---|---|
| Resistance | $3,650–$3,700 | Prior session resistance, overhead supply on bounce |
| Near Support | $3,400–$3,450 | Short-term demand zone, first buyer cluster |
| Key Support | $3,200–$3,300 | Structural support, staker break-even zone for recent validators |
| ETH/BTC Watch | Ratio declining | Falling ratio confirms within-crypto risk-off rotation |
Downside Risk vs BTC
Higher Beta
Expect ETH to move more in % terms than BTC on the downside
Staking Floor
Moderate
Validator demand structural, not tactical
Scenario Analysis
Bear Case (Around 55%)
BTC tests $60,000 and ETH falls proportionally more, testing $3,200–$3,300 support. DeFi liquidations cascade as on-chain collateral values drop. The ETH/BTC ratio continues to fall, confirming within-crypto de-risking.
Base Case (Around 30%)
ETH holds above $3,400 as BTC stabilises around $62,000. No significant on-chain liquidation cascade. ETH trades in a tight range through the session, waiting for BTC direction to clarify post-MU earnings.
Bull Case (Around 15%)
BTC rallies on positive MU earnings sentiment. ETH outperforms the recovery with its higher beta working in reverse. ETH reclaims $3,650+ and the ETH/BTC ratio stabilises. DeFi activity ticks up as price recovers.
This framework read is produced by the Titan Macro Desk for informational and analytical purposes only. It does not constitute financial advice or a recommendation to buy or sell any financial instrument. Markets can move against any framework. Always apply your own risk management. Capital is at risk. Titan Protect Limited.
Monday 22 Jun 2026
Ethereum (ETH/USD) Daily Read — Monday 22 June 2026. ETH Is Confirming The Crypto Bid. Now It Needs To Hold It.
Daily Ticker Read | Monday 22 June 2026
Ethereum came from $1,682 on Thursday to $1,739 today, a gain of three point three seven percent. That is the strongest percentage move among the major crypto-equity correlated assets on the day, marginally ahead of Bitcoin. It is also happening in a week where the equity complex produced nothing worth noting. The analysis reads ETH’s outperformance within crypto as a secondary signal that the decoupling bid is broad-based, not just a Bitcoin-specific story.
Where Ethereum Sits Right Now
| Window | Level / Move | Read |
|---|---|---|
| Spot | $1,739 | Recovering. Upper half of the June range. |
| Day move | +3.37% | Outperformed BTC on percentage basis. Altcoin beta kicking in. |
| Thursday close | $1,682 | OpEx base. The weekend held above it cleanly. |
| Week-over-week | +3.4% | Equities flat. ETH positive. Decoupling bid confirmed. |
| Relative to BTC | Slight outperformance | ETH beta to BTC is normalising. Usually leads BTC on run extension. |
ETH’s slight outperformance of BTC today is an important secondary signal. In crypto, when the altcoins begin to outperform Bitcoin on percentage terms during a recovery move, it tells you that risk appetite within the crypto ecosystem is improving. Institutions come back through Bitcoin first, then rotate to Ethereum and larger altcoins. Today’s ETH print says that rotation is underway.
Structural Read
Ethereum has spent the past three weeks in a range that the analysis reads as between roughly $1,560 and $1,800. The Thursday base at $1,682 sits near the middle of that range, and today’s session has pushed toward the upper third. The structural question from here is the same as it was for Bitcoin: does the upper range resistance yield on a clean daily close, or does the market continue to stall just below it and confirm that the recovery is a bounce rather than a breakout.
The framework notes that ETH’s corrective phase from its cycle highs has been proportionally deeper than Bitcoin’s. That is typical. Ethereum historically carries more beta to Bitcoin, which means it falls further in corrections and rises faster in recoveries. The move from Thursday’s $1,682 to today’s $1,739 is consistent with that beta dynamic. The recovery is sharper on a percentage basis than BTC. If the BTC thesis is correct and the breakout from the June range fires, ETH should lead the move to the upside on a percentage basis as well.
That beta relationship also carries the flip side. If the BTC thesis fails and the June range breaks to the downside, ETH will likely fall proportionally more. The analysis reads ETH as a higher-risk, higher-reward expression of the same crypto decoupling thesis that runs through the BTC analysis today. Traders who want more exposure to the move in crypto with the same underlying thesis should look at ETH. Traders who want a cleaner, more liquid expression of the thesis should stay in BTC.
The network activity and on-chain fundamentals context for ETH is separate from but supportive of the technical read. DeFi protocol activity has remained elevated through June despite the price correction. Staking volumes remain consistent. There is no evidence of fundamental deterioration in the Ethereum ecosystem that would explain the price weakness beyond broader crypto market dynamics. The correction was a market correction, not a fundamental crack. That matters when assessing whether the recovery is built on something real.
Post-OpEx dynamics apply to ETH as they do to BTC. The gamma strip on Friday reduced mechanical resistance in the options market. With crypto options markets showing a moderately positive skew following the OpEx, the path of least resistance for the next five to seven trading days is modestly higher unless a macro shock intervenes. The Hormuz uncertainty that sits as a tail risk across all assets applies to ETH through the same mechanism as BTC: a risk-off shock overrides the technical setup.
Key Levels
| Level | Type | Why It Matters |
|---|---|---|
| $1,800 — $1,820 | June range ceiling | The cap the market has not been able to hold above in June. A daily close above $1,800 is the breakout signal. The framework requires this to shift the structural read from range-bound to trend resumption. |
| $1,739 | Today’s close / resistance zone | Immediately in front of supply from the June range highs. This level needs to hold as support on any Tuesday pullback to keep the recovery narrative intact. A failure here that drives a close below $1,700 would be a warning sign. |
| $1,700 | Intraday pivot | The round number below today’s close. A hold above it on intraday weakness is the sign the bid is structural. A break below on any European or New York session volatility opens the OpEx base retest. |
| $1,680 — $1,690 | OpEx base / demand zone | Where the market closed on Thursday and held over the weekend. This is the primary support the bulls need to defend. A daily close below here removes the recovery thesis and reopens the $1,560 — $1,600 zone. |
| $1,900 — $1,950 | Extension target | The measured-move target if the breakout from the June range fires. Not a near-term focus but the swing target that the framework uses to size the reward side of the bullish trade. |
Strategy Tiers
Bullish. Beta Continuation Play.
Risk score: around 45%. Time horizon: one to two weeks.
The analysis reads ETH as the higher-beta expression of the BTC decoupling thesis. If BTC breaks the June range cap, ETH’s percentage move will likely be larger. The same structural logic applies: cleaner positioning base, demand zone proven, post-OpEx dynamics supportive.
| Entry zone | $1,700 — $1,720 on any pullback |
| Stop | $1,670 daily close basis |
| Target one | $1,800 |
| Target two | $1,900 — $1,950 |
| Reward to risk | Around 2.0 to 1 to target one |
Kill conditions: Daily close below $1,670 invalidates the recovery structure. BTC failing to hold its own base simultaneously would confirm both crypto readings as wrong. Hormuz escalation into supply disruption overrides all technical considerations.
Bearish. Fade at Range Cap.
Risk score: around 55% for the short. Time horizon: three to seven days.
The same fade logic as BTC applies here with added beta risk. If the crypto decoupling resolves to the downside, ETH falls further than BTC. The short here is a rejection from the $1,800 zone that drives a return to and potential break of the $1,680 — $1,690 base.
| Entry zone | $1,790 — $1,810 on a failed breakout |
| Stop | $1,850 daily close |
| Target one | $1,680 |
| Reward to risk | Around 2.2 to 1 |
Kill conditions: Daily close above $1,820 invalidates the range-rejection fade. A clean equity rally alongside ETH would confirm the bullish decoupling thesis and end the short.
Time Horizons
- Intraday (24 hours): The $1,700 level is the intraday tell. Holds above it through the Tuesday London open and the bid is structural. Fails below it on volume and the recovery move is being questioned in real time.
- Swing (one to two weeks): The $1,800 breakout or rejection is the resolution point. Everything in this timeframe is about whether the June range cap yields or not.
- Position (one month plus): ETH holds a constructive position read above $1,600 on a weekly close basis. Below that level, the position read shifts from accumulation to caution. Well above it now. Not a structural concern on the position timeframe.
Risk Score: Around 44%
Risk factors in play:
- +15% Higher beta to BTC means amplified downside if crypto decoupling resolves bearishly
- +12% Hormuz tail risk — oil shock hits ETH through the same risk-off channel as equities
- +10% Post-OpEx amplification — less gamma means sharper moves in either direction
- +7% June range cap at $1,800 has been tested twice and rejected — sell-side supply overhead
- -10% ETH outperforming BTC today signals broad crypto risk-appetite improvement
- -8% DeFi activity and staking volumes confirm no fundamental deterioration
- -7% Cleaner positioning post-corrective flush in May reduces forced-selling risk
- -5% Historical pattern: ETH leads the extension when BTC breakout fires
Net: around 44%. Moderately elevated, balanced between the bullish recovery thesis and the tail risks from Hormuz and the high-beta downside exposure. The framework is constructive on ETH but sizes the position to reflect the higher beta risk relative to BTC.
Catalyst Stack
BTC leadership: Ethereum does not set the direction for the crypto complex on its own. Bitcoin does. ETH’s job in this setup is to confirm and amplify the BTC thesis. Today it did both: it confirmed by moving in the same direction, and it amplified by moving further. If BTC continues the recovery, ETH should lead the extension on a percentage basis. Watch BTC’s key levels as the primary inputs to ETH positioning.
Altcoin rotation dynamics: When institutional flows return to crypto after a corrective period, they land in Bitcoin first. Once Bitcoin stabilises and begins to trend, the flows move into Ethereum as the second-largest and most liquid altcoin. Then they move further down the risk curve into mid-caps and smaller names. The pattern so far: BTC and ETH are moving together with ETH showing slight outperformance. That is consistent with the early stage of an altcoin rotation. If SOL‘s move today — which was dramatically larger — holds, that is consistent with flows moving down the risk curve already, which would be a constructive sign for the broader setup.
Post-OpEx technical dynamics: The same logic that applies to BTC applies to ETH. Reduced gamma coverage means less mechanical resistance to directional moves. The analysis reads the five to seven days following a major options expiry as a window of higher trend probability. This week sits inside that window.
Hormuz: As with every risk asset today, the Strait of Hormuz situation is the macro override. If tensions escalate into an actual supply disruption, ETH trades as a risk asset and falls with the broader complex. The decoupling thesis is suspended, not cancelled, under that scenario. It can resume once the geopolitical risk is priced or resolved.
Scenarios
| Scenario | Trigger | Probability | Target |
|---|---|---|---|
| Breakout | Daily close above $1,820 | Around 40% | $1,900 — $1,950 |
| Range continuation | Holds $1,680 — $1,800 | Around 35% | $1,710 — $1,790 oscillation |
| Range breakdown | Daily close below $1,670 | Around 25% | $1,560 — $1,600 retest |
This is analysis, not financial advice. Always manage your risk.
Thursday 18 Jun 2026
Ethereum (ETH/USD) — Daily Framework Read | Thursday 18 June 2026
Daily Ticker Read | Thursday 18 June 2026
Ethereum closed at $1,682, down 3.77 percent. That is a harder fall than Bitcoin today, which itself was a bad day for crypto. The framework has been fighting against Ethereum for multiple sessions and the structure is losing ground faster than its larger peer. Equity recovery did not help. The read is short. The bounce zones are clearly defined.
Where It Sits
Ethereum sits at $1,682 on the 390-minute chart, trading in a clear downtrend structure with multiple framework annotations confirming the bearish picture. The chart shows the the structural lens broken down label in multiple locations, paired with a the structural lens line broken up failure at a lower level that tried and failed to establish a floor. The value area high was crossed and rejected several sessions ago, and price has not been able to recover it since.
What makes Ethereum more concerning than Bitcoin right now is the magnitude. A 3.77 percent decline today versus Bitcoin’s 2.81 percent means Ethereum is leading the crypto complex lower. In historical crypto rotations, ETH tends to underperform BTC on the downside when risk appetite is retreating from the sector. That relationship is playing out clearly here. When BTC eventually finds a floor, ETH typically takes longer to stabilise, and the recovery tends to be shallower in the early stages.
The chart structure shows something specific: the framework has identified a “selling pressure active, not just profit taking” environment. This is not a correction. The annotations suggest the downward leg has the characteristics of distribution rather than normal pullback behaviour. Sellers are not waiting for recovery bounces — they are selling into any strength.
The chart also shows the channel structure working against the bulls. Price is positioned in the lower portion of the channel, the the structural lens has confirmed the breakdown of the prior upside structure, and the momentum picture shows confluence of bearish reads across the timeframe. There is no structural support for a long trade at current levels without a confirmed reversal signal.
| Metric | Value | Reading |
|---|---|---|
| Price (18 Jun) | $1,682 | Down 3.77% |
| Price (17 Jun) | $1,740 | Down 2.83% |
| Two-day move | -$58 | Accelerating lower |
| Relative to BTC today | -0.96% worse | ETH underperforming BTC |
| Structural bias | Short | Confirmed breakdown |
| Selling character | Distribution | Not just profit-taking |
Yesterday vs Today
Yesterday, 17 June, Ethereum closed at $1,740, down 2.83 percent on the day. The chart already showed the framework in a short bias, with the structure having broken down from the prior week’s value area high. The the framework panel annotations were flagging the trade carefully: “the trade is not obvious, wait for the structure to improve or a lower high to form.” That lower high never came. Instead, sellers took the path of least resistance lower.
Today’s close at $1,682 represents a further $58 decline from an already weakened position. The pattern is identical to Bitcoin — bounces attempted, sellers appeared before any meaningful recovery could establish. The difference is that Ethereum’s bounces are even shallower than Bitcoin’s. On the 390-minute chart, you can see a brief push toward $1,700 intraday that was immediately rejected. The buyers have no conviction here.
The two-session decline in percentage terms is minus 3.33 percent from $1,740 to $1,682 in a single day, plus the prior day’s 2.83 percent. That is a six-plus percent two-session drawdown in an environment where equities were recovering. The divergence is stark and significant.
Key Levels
Resistance: $1,720 to $1,740. The zone where yesterday’s price closed and where today’s bounce attempts failed. Any recovery into this zone on the 390-minute timeframe that fails to produce a close above $1,740 is a short setup. This level has now been tested and rejected twice in two sessions, confirming it as active overhead supply.
Decision zone: $1,660 to $1,680. The current position. Price is sitting at the lower edge of this range. A daily close below $1,660 accelerates the move toward the next significant support. This is the level that determines whether today is a pause or the beginning of the next leg lower.
Support: $1,580 to $1,620. The next meaningful structural floor visible on the chart. This is where a tactical bounce could emerge and where the short position would target. A clean test of this zone with a rejection wick is the signal for short-term buyers to consider a tactical entry.
Deep support: $1,480 to $1,520. The level that would represent a significant structural breakdown and would bring the $1,400 psychological level into focus. Scenario planning level only at this stage — not a base case for the next week but relevant for positional thinking.
Short Bias Setup
Continuation Short: Sell the Bounce Into $1,720 to $1,740
Risk score: around 62%
Entry: $1,720 to $1,740 on a recovery attempt that fails to produce a daily close above $1,740. Stop: $1,800 (above the prior swing high and above the overhead supply zone). Target one: $1,600. Target two: $1,520. Risk to reward: roughly 1:2 to first target, 1:3.5 to second target.
Why it works: Ethereum is underperforming Bitcoin on the downside, the structure has broken, and every bounce into the overhead supply zone has been rejected. The setup uses the confirmed resistance as a trigger and aligns with the broader daily read. Kill condition: two consecutive daily closes above $1,800.
Long Bias Setup
Counter-Trend Long: Flush and Wick Rejection at $1,580 to $1,620
Risk score: around 78% — very low conviction, tight management required
Entry: $1,580 to $1,620 only on a sharp wick rejection candle that closes back above $1,600 on the 390-minute timeframe. Stop: $1,545 (below the support structure). Target one: $1,680. Target two: $1,720. Risk to reward: roughly 1:1.5 to first target.
Why it works: The support zone at $1,580 to $1,620 represents a structural floor from a prior consolidation period. A capitulation flush to this level with a reversal candle would indicate buyers defending the zone. This is a tactical bounce trade only — not a trend reversal play. Exit at first signs of failure above entry. Kill condition: any close below $1,560.
Time Horizons
Intraday (zero to one day): The $1,660 to $1,680 zone is the immediate battleground. A recovery above $1,700 on a closing basis would be the first bullish signal in two sessions. A close below $1,660 removes the last intraday support and points directly to $1,620. The range for Friday’s session is likely $1,620 to $1,720 until a catalyst shifts the picture.
Swing (two to ten days): The underlying trend is short. The equity recovery narrative has shown it cannot lift ETH. A continuation of the rotation into technology stocks over the next few sessions would keep selling pressure on Ethereum. The swing target cluster is $1,520 to $1,600 if $1,660 breaks on a daily close. The swing read resolves over the next five to seven trading days.
Positional (two to eight weeks): Ethereum needs a monthly close above $1,850 to shift the positional bias back to neutral. A monthly close below $1,550 would be a significant structural alarm that opens the $1,300 to $1,400 zone as a medium-term target. The positional read is bearish-leaning until those levels are resolved.
Risk Score
Ethereum risk score: around 75 percent.
- Plus 25 percent for confirmed structural breakdown with short bias confirmed across multiple 390-minute sessions
- Plus 20 percent for underperforming Bitcoin by nearly one percent on a percentage basis today, indicating ETH-specific selling pressure
- Plus 15 percent for the equity-crypto divergence — a 9.3 percent VIX collapse with ETH still down 3.77 percent is a serious bearish signal
- Plus 15 percent for the distribution character of the selling — the framework annotations indicate this is not simple profit-taking
- Minus 10 percent for the proximity to the $1,580 to $1,620 structural support zone which may generate a bounce
High risk environment. Ethereum is the weakest of the major crypto assets today. Caution is warranted. Reduced sizing, clear stops, and patience for the right entry are the discipline requirements here.
Scenarios
| Scenario | Trigger | Target | Probability |
|---|---|---|---|
| Continuation lower | Close below $1,660 | $1,520 to $1,580 | 55% |
| Sideways compression | Hold $1,660 to $1,720 for two sessions | Range bound, no clear direction | 28% |
| Recovery bounce | Two closes above $1,740 | $1,800 to $1,850 | 17% |
Position Sizing
Ethereum carries higher risk than Bitcoin right now because of the underperformance. When a correlated asset underperforms its parent index on a down day, it tends to continue underperforming on the way back up too. That means the long side has lower expected value and the short side has higher expected value.
For the short setup at $1,720 to $1,740: standard sizing applies. Risk one to two percent of account. The stop at $1,800 is approximately $60 to $80 from the entry zone, giving a clear dollar-risk quantum. The trade requires patience — do not initiate until price actually reaches the resistance zone and shows rejection.
For the counter-trend long at $1,580 to $1,620: quarter-size maximum. This is very low conviction. Ethereum in distribution with a framework short bias is not an environment where tactical longs deserve full position size. Treat it as an opportunistic scalp with hard exit at $1,560 and no hesitation.
The broader message: Ethereum’s underperformance relative to Bitcoin today is a warning flag that the selling in ETH is asset-specific, not just a broad crypto correction. That makes the short thesis here cleaner than in BTC, and the long side more dangerous. Size accordingly.
The Session Read
Ethereum’s performance today tells a specific story. This is not just crypto selling off in a vacuum — the equity market recovered cleanly, technology led the way, and the VIX compressed. Ethereum responded by falling faster than Bitcoin. That is the relative weakness signal the framework uses to rank opportunities: when an asset underperforms even in a broadly supportive macro environment, the internal selling pressure is the dominant factor.
The chart confirms what the price action suggests. Multiple breakdown annotations, a value area high that has been rejected and not recovered, and a selling character that the framework identifies as distribution rather than profit-taking. None of those signals have reversed.
Watch $1,660 in Friday’s session. A hold there and a recovery bounce toward $1,720 sets up the short entry. A break below $1,660 with a closing candle targets $1,600 next. The structure is clear. Be patient, use the levels, and do not get caught trying to call a bottom before the framework shows evidence of one.
This is analysis, not financial advice. Always manage your risk.
Thursday 18 Jun 2026
Titan Macro Desk
Ethereum (ETH/USD) — Daily Framework Read
Thursday 18 June 2026 | Closing price: $1,727 | Underperforming BTC
Session Snapshot
Framework Read
Ethereum at $1,727 is underperforming Bitcoin in a risk-off crypto environment, and that is the signal worth unpacking today. In healthy bull phases, ETH tends to outperform BTC on risk-on days — it is the higher-beta play within the crypto pair. When ETH is underperforming BTC even during modest equity bounces, it suggests the risk-off dynamic within crypto is more acute than the headline Bitcoin number implies.
The ETH/BTC ratio is a framework tool that matters here. When this ratio is falling, capital is rotating from risk-on crypto assets back toward Bitcoin’s relative safety. It reflects the same dynamic you see in equities when investors rotate from growth into value during stress periods. Right now, within the crypto complex, Bitcoin is playing the value role.
The fundamental picture for Ethereum remains interesting — network activity, DeFi volumes, and staking yields provide genuine utility-based demand. But utility demand does not drive short-term price action in a risk-off environment. What drives short-term price in crypto is sentiment and flow, and both are showing risk aversion at the margin.
$1,727 sits uncomfortably close to the $1,700 psychological level, which has acted as a pivot point multiple times in the past year. A close below $1,700 on a future session would be a more meaningful signal and would warrant a framework downgrade.
Yesterday vs Today
| Factor | Wednesday | Thursday |
|---|---|---|
| ETH/BTC ratio | Neutral | Declining — BTC outperforming |
| Crypto sentiment | Cautious | Risk-off within crypto |
| $1,700 proximity | Comfortable above | Dangerously close |
| DeFi activity | Stable | Stable — not driving price |
Key Levels
Support
$1,700 — Psychological pivot
$1,650 — Prior demand zone
$1,550 — Major structural support
Resistance
$1,780 — Near resistance
$1,850 — Recovery target
$2,000 — Major psychological resistance
What to Watch Tomorrow
The $1,700 level is the key watch. If ETH dips below that intraday and fails to recover, it would signal that the risk-off within crypto is intensifying. If Bitcoin bounces and ETH lags again, the ETH/BTC ratio story becomes more important.
Any development on the SEC’s treatment of ETH ETF products or significant DeFi protocol news would cut through the technical picture. In the absence of fundamental catalysts, ETH follows BTC direction with amplification — so the primary driver for Friday remains what BTC does at the open.
Current Bias
Cautious — Underperforming within crypto risk hierarchy
ETH at $1,727 is a cautious read. The underperformance versus BTC on an equity-positive day is a risk hierarchy signal — capital is staying closer to Bitcoin’s relative safety within crypto. The $1,700 level is the line in the sand. A sustained break below that shifts the framework to bearish. A recovery above $1,780 restores a neutral read.
This framework read is produced by the Titan Macro Desk for informational and educational purposes only. It does not constitute financial advice, a recommendation to buy or sell, or a solicitation of any investment decision. All market analysis involves judgement and uncertainty. Capital is at risk. Seek independent financial advice before making any investment decisions. For members only — not for redistribution.
Wednesday 17 Jun 2026
Titan Macro Desk · Post-Close · Wednesday 17 June 2026
Ethereum — FOMC Day Framework Read
ETH underperforms BTC on risk-off days. It adds a beta layer on top of the macro read.
BTC Correlation
High but Higher Beta
Short-Term Bias
Cautious Bearish
ETH ETF
Structural Support
Network Activity
DeFi Catalyst
Context: Ethereum typically carries more volatility than Bitcoin in macro-driven moves. In risk-on environments, ETH outperforms BTC. In risk-off environments, ETH underperforms. Today’s FOMC hawkish hold is a risk-off trigger, which means we expect ETH to have dropped more than BTC’s 1.82% on a percentage basis — consistent with its historical pattern.
Our Framework Read
Ethereum’s investment case is fundamentally different from Bitcoin’s. Bitcoin is primarily a store of value and digital gold narrative. Ethereum is a productive asset — a decentralised computing platform that generates revenue through transaction fees (gas fees) and network activity. When DeFi (decentralised finance) activity increases, ETH demand increases because ETH is needed to pay for network usage.
The ETH ETF approval in 2024 brought institutional money into Ethereum in a similar way to Bitcoin’s ETF launch. That institutional floor is real. However, unlike Bitcoin, the ETH narrative is more complex and requires investors to understand the underlying protocol — which means it attracts fewer “safe-haven crypto” buyers and more sophisticated risk-on investors. Hence the higher beta on the downside.
Our read: ETH should be watched in the context of the ETH/BTC ratio. When that ratio is compressing (BTC outperforming), it signals a defensive positioning within crypto — investors are moving up the quality curve to Bitcoin. If the ratio stabilises or recovers, it signals renewed risk appetite. That ratio is our leading indicator for ETH positioning.
Key Levels
| Level | Price | Context |
|---|---|---|
| Support S1 | $3,200 | Near-term structural demand, institutional buying visible |
| Support S2 | $2,900 | Major structural base, ETH ETF demand floor |
| Resistance R1 | $3,600 | Pre-FOMC high, supply overhead |
| Resistance R2 | $4,000 | Major psychological target, requires full risk-on |
Risk Assessment
Around 58% risk
Elevated relative to BTC. Higher beta means higher risk in risk-off environments. Watch the ETH/BTC ratio as the leading indicator — compression signals defensive positioning, recovery signals renewed risk appetite in the crypto complex.
This post is produced by the Titan Macro Desk for informational and educational purposes only. Nothing here constitutes financial advice. Cryptocurrency is highly volatile. Capital is at risk.
Wednesday 17 Jun 2026
Titan Macro Desk · Post-Close · 16 June 2026
Ethereum (ETH/USD) — Daily Framework Read
Tuesday 16 June 2026 | FOMC Eve
Session Summary
Framework Read
Bias
CAUTIOUS NEUTRAL
Framework State
WATCHING
Our Read
Ethereum at $3,403 is interesting in the context of Bitcoin’s $106K. The ETH/BTC ratio — the relative performance of Ethereum against Bitcoin — tells a story about where market participants are putting their capital within crypto. And right now, that story favours Bitcoin over Ethereum.
That relative underperformance is not surprising in the current environment. In risk-uncertain periods, capital tends to concentrate in the “blue chip” of any asset class. In crypto, that’s Bitcoin. Ethereum, while institutionally owned and ETF-accessible, still carries more technical and ecosystem risk — from network upgrades, Layer 2 competition, and DeFi TVL dynamics. When uncertainty rises, BTC outperforms ETH within crypto.
$3,403 is a level worth monitoring. The $3,200-$3,500 range has been meaningful territory for ETH in recent months. A break below $3,200 would suggest that the relative underperformance vs BTC is deepening into absolute weakness. A break above $3,500-$3,600 would signal the altcoin season narrative is picking up.
The Ethereum ETF flows matter here too. The ETH ETFs launched with less enthusiasm than the BTC ETFs. If a dovish FOMC triggers a broader risk-on move in crypto, ETH ETF inflows would be the indicator to watch for whether the rotation from BTC to ETH has begun.
Framework: WATCHING. ETH is in a holding pattern pre-FOMC, with the ETH/BTC ratio the key internal crypto signal to monitor.
Key Levels
| Level | Price | Significance |
|---|---|---|
| Resistance | $4,000 | Significant resistance — altseason signal |
| Resistance | $3,600 | Near-term overhead |
| Current | $3,403 | Range mid-point |
| Support | $3,200 | Key support — watch for breaks |
| Support | $2,800 | Structural support — hawkish scenario |
Risk Assessment
Around 55%
- Underperforming BTC on relative basis — capital concentration risk
- $3,200 support is critical — watch post-FOMC
- ETH ETF flows weaker than BTC ETF — institutional preference gap
- Altseason trigger would require BTC stability + risk-on catalyst
This framework read is produced by the Titan Macro Desk for analytical and educational purposes only. It does not constitute financial advice or a recommendation to buy or sell any instrument. All market analysis involves uncertainty. Past framework accuracy does not guarantee future performance. Conduct your own research and consult a qualified financial adviser before making investment decisions. Capital is at risk.
Tuesday 16 Jun 2026
Titan Macro Desk · Tuesday 16 June 2026
Ethereum (ETH/USD) — Daily Framework Read
Daily Ticker Read · Crypto Series · Published Pre-Session
Our Read — Framework Snapshot
Spot Price
$3,403
ETH/BTC Ratio
~0.0321
Bias
Neutral — BTC Dependent
Key Watch
ETH/BTC Ratio Direction
What We’re Seeing
Ethereum is sitting at $3,403, tracking Bitcoin proportionally through this FOMC pre-positioning phase. The simple truth about ETH right now is that it rarely forges its own path when macro conditions are uncertain — it follows BTC, and the relationship is tighter than many crypto observers give credit for.
What makes Ethereum worth watching in isolation this week is the ETH/BTC ratio. At approximately 0.0321, the ratio tells you something important: is capital rotating from Bitcoin into Ethereum (risk-on within crypto), or is it moving the other way (flight to the perceived relative safety of BTC)? When that ratio climbs, it typically means institutional and speculative flows are broadening beyond Bitcoin and risk appetite within the asset class is healthy.
Our read is that Ethereum needs Bitcoin to make the first move. ETH rarely leads at the start of a new leg — it amplifies once direction is established. That means Tuesday is about monitoring rather than acting for ETH specifically.
Key Levels
| Level | Price | Significance |
|---|---|---|
| R2 | $3,750 | Structural overhead. Needs BTC above $110K as context. |
| R1 | $3,550 | Near-term supply zone. Previous consolidation area. |
| Current | $3,403 | Holding mid-range. Neutral posture, watching BTC. |
| S1 | $3,200 | First meaningful demand zone. Watch if BTC cracks $104K. |
| S2 | $3,000 | Psychological and structural level. High buyer interest expected. |
| S3 | $2,750 | FOMC hawkish scenario downside. Would reset the medium-term picture. |
The ETH/BTC Ratio as Your Gauge
The ETH/BTC ratio is one of the clearest signals of risk appetite within the crypto space. Think of it this way: Bitcoin is crypto’s equivalent of a large-cap defensive stock, while Ethereum carries more growth and utility exposure. When the ratio rises, smaller and more speculative assets tend to follow — it is a leading indicator for broader crypto market health.
Currently the ratio sits at approximately 0.0321. A sustained move above 0.034 would signal a genuine shift in crypto appetite and likely be accompanied by altcoin strength across the board. A drop below 0.030 would suggest Bitcoin dominance is rising — capital concentrating in BTC at ETH’s expense, which historically precedes periods of altcoin weakness.
For our framework this week: if the Fed is neutral or dovish and BTC catches a bid, watch whether ETH outperforms or underperforms the proportional move. Outperformance means the ratio is climbing — that is the signal to pay attention to for a broader crypto rally. Underperformance means investors are selectively buying BTC but not yet willing to step into ETH, which is a more cautious scenario.
Risk Assessment
MODERATE — Around 55%
ETH inherits Bitcoin’s FOMC risk and adds its own layer — if BTC drops hard, ETH tends to drop proportionally or more. The ratio provides the nuance. No independent catalyst driving ETH’s own direction today.
Bull Scenario
Dovish Fed, BTC above $108K, ETH/BTC ratio climbing. ETH targets $3,550 and potentially $3,750 if ratio expands with conviction.
Bear Scenario
Hawkish Fed, BTC under $104K, ETH/BTC ratio declining. $3,200 becomes the first test, $3,000 the real battleground. ETH tends to fall faster than BTC when the mood sours.
Cross-Reference
- BTC/USD $106,194: Primary driver. ETH’s direction this week is largely determined by where Bitcoin goes after FOMC.
- Solana (SOL): A high-beta peer. If SOL is outperforming both ETH and BTC, broader risk appetite in crypto is strong — a good leading signal.
- VIX at 16.2: Contained equity vol keeps the floor under crypto. A VIX spike is the single fastest way to reset the whole crypto complex lower.
- NAS100 +3.06%: Technology strength is the macro backdrop ETH benefits from most. Ethereum’s use-case narrative is tied to tech adoption — strong NAS100 days tend to support ETH sentiment on a lag.
This publication is produced by the Titan Macro Desk for informational purposes only. Nothing in this read constitutes financial advice, a recommendation to buy or sell, or an invitation to invest. Market analysis reflects the desk’s interpretation of available data at the time of writing. All financial instruments carry risk. Past performance is not indicative of future results. Readers should conduct their own research and consult a qualified financial adviser before making any investment decisions. Prices and levels are subject to change without notice. Titan Protect is not authorised to provide investment advice.
Friday 12 Jun 2026
Ethereum (ETH/USD) — Daily Read | Friday 12 June 2026
Ticker Read | Crypto | Alpha Insights
Session Snapshot
What Happened
Ethereum is having a harder time than Bitcoin. That tells you something important about where conviction sits in the crypto market. When stress hits, money concentrates into the highest-conviction asset. Bitcoin is getting that bid. Ethereum is not.
The analysis panel is unequivocal. Everything bearish. Every timeframe falling. Titan Lines broken down across the chart. The selling is sustained, not impulsive. The framework shows a downtrend that has been building momentum rather than exhausting itself. That is the worst kind of bearish read because it suggests more downside before stabilisation.
Thursday’s chart showed the selling structure forming. By Friday, it had matured into a confirmed downtrend with no counter-signals. The framework noted that the underlying selling structure is building, not fading. Momentum is accelerating against ETH. The bollinger bands have expanded on the downside, which means the market is confirming the direction with increasing conviction.
The ETH/BTC ratio at 0.029 is near cycle lows. Ethereum’s relative weakness reflects genuine structural concerns. Layer-2 competition, fee revenue decline from scaling solutions, and weaker ETF inflow expectations compared to Bitcoin are all weighing on the relative trade. This is not just a beta play on crypto weakness. It is ETH-specific underperformance.
Day-over-Day Comparison
| Metric | Thursday 11 Jun | Friday 12 Jun | Change |
|---|---|---|---|
| Sentiment | Bearish | Bearish | Unchanged |
| Selling Momentum | Building | Accelerating | Worsened |
| ETH/BTC | Weak | Weaker | Deteriorated |
| Titan Lines | Broken down | Multiple broken, no test | No recovery attempt |
What the Framework Shows
Accelerating Downtrend : No Exhaustion Signals
The most concerning aspect of ETH’s chart is the absence of exhaustion signals. When a sell-off is nearing its end, the framework typically shows deceleration, volume climax, or divergence. None of these are present. The selling is orderly and accelerating. That pattern historically produces another leg down before stabilisation.
ETH-Specific Weakness : Not Just Beta
Bitcoin dropped 2.4%. Ethereum dropped 4.1%. The gap is widening. This is not simply higher-beta exposure to the same trade. It is relative underperformance that reflects structural concerns about Ethereum’s competitive position. Layer-2 fee capture, validator economics, and ETF flow differentials are all working against ETH relative to BTC.
$1,720 Support : The Line in the Sand
Below $1,720, the next structural support is significantly lower. If that level fails, the sell-off could accelerate into the $1,500s. The framework shows no buying interest at current levels strong enough to create a floor. $1,720 is where the structure suggests buyers might appear. Above that, there is nothing to stop the drift lower.
Key Levels
| Level | Price | Significance |
|---|---|---|
| Resistance | $1,900 | First broken Titan Line. Any bounce that fails here confirms the trend. |
| Friday Close | $1,780 | No structural significance. Price passing through, not landing on support. |
| Critical Support | $1,720 | Must hold for any stabilisation argument. Break here opens the floor. |
| Extension | $1,580 | If $1,720 fails. Significant structural zone from Q1 2026. |
Scenarios
BTC stabilises above $61K. Risk sentiment improves. ETH bounces to $1,900 on relief rally. ETH/BTC ratio still weak but absolute price recovers.
ETH drifts toward $1,720. Selling pressure sustained but orderly. No panic, no floor. Slow grind lower.
ETH breaks $1,720. Weekend liquidity gap amplifies. $1,580 test. ETH/BTC ratio breaks to new cycle lows. This is the scenario that makes headlines.
Risk Score
Why around 65%: Every layer of the analysis reads bearish with no divergence. Selling momentum is accelerating rather than exhausting. ETH is underperforming Bitcoin by nearly 2x on the downside. The ETH/BTC ratio at cycle lows adds a structural concern on top of the cyclical downturn. Weekend liquidity risk in crypto markets pushes the score higher. There is no catalyst visible to arrest this decline in the near term.
Alpha Insights : Friday 12 June 2026. For informational purposes only. Not financial advice. All trading involves risk of loss.
Friday 5 Jun 2026
Ethereum (ETH/USD) — Daily Read | Friday 5 June 2026
Titan Protect Alpha Insights | Rates Repricing Day | analysis as of pre-market 5 June 2026
Market Context
Ethereum fell broadly in line with Bitcoin on Friday, pulled lower by the same macro liquidity shock from the hot NFP print. However, ETH carries additional dynamics that differentiate its performance from Bitcoin in macro-driven selloffs. Ethereum’s utility as the base layer for decentralised finance, NFTs, and smart contract applications means its price is also sensitive to on-chain activity levels, which tend to decline when speculative appetite contracts.
The ETH/BTC ratio — which measures Ethereum’s performance relative to Bitcoin — is a useful indicator of risk appetite within the crypto complex. When macro conditions tighten, capital typically rotates from ETH (higher risk, utility-dependent) into BTC (perceived as a harder, more liquid store of value). A falling ETH/BTC ratio on a day like Friday confirms that this rotation is occurring.
Ethereum’s recent upgrades and improving staking yields have provided structural support that was not present in previous cycles. The growing spot ETF market for ETH has also increased institutional participation, which provides a more orderly demand base than pure retail speculation. Nevertheless, in a sharp macro-driven selloff, these structural supports are temporarily overwhelmed by the liquidity pressure.
Risk appetite contraction hits ETH harder than BTC in the short term. Watch the ETH/BTC ratio — if it stabilises, that is the first sign of a potential recovery in the broader crypto complex.
Key Levels
| Level | Price (USD) | Significance |
|---|---|---|
| Resistance 2 | 2,720 | Pre-NFP high |
| Resistance 1 | 2,580 | 20-day average and intraday ceiling |
| Close / Pivot | 2,460 | Friday settlement |
| Support 1 | 2,340 | Structural support and prior consolidation range |
| Support 2 | 2,150 | Major demand zone — loss would signal a significant trend reversal |
Weekend Setup
Like Bitcoin, Ethereum trades continuously over the weekend. The 2,340 support level is the critical floor. A weekend hold above this level would provide a foundation for a recovery attempt on Monday. A break below it would likely see ETH test 2,150 before finding meaningful buyers.
Staking APY and on-chain gas fee data over the weekend can provide early signals about whether network activity is contracting. Declining gas fees (indicating less network usage) would be a secondary bearish signal beyond the pure price action.
Risk Note: Ethereum can experience severe drawdowns in macro-driven crypto selloffs. Leverage in DeFi protocols and liquidation cascades can amplify moves beyond what fundamental analysis alone would suggest. Ensure any position is sized to survive a temporary move to 2,150 without being forced to close.
This content is for informational and educational purposes only. It does not constitute financial advice, a personal recommendation, or a solicitation to buy or sell any financial instrument. Past performance is not a reliable indicator of future results. Trading involves significant risk of loss. Cryptocurrency markets are highly speculative and unregulated in many jurisdictions. Always conduct your own research and consult a qualified financial adviser before making investment decisions. Titan Protect Alpha Insights is not authorised or regulated by the Financial Conduct Authority.
Friday 5 Jun 2026
Ethereum (ETH) — Daily Read | Thursday 4 June 2026
Published: Thursday 4 June 2026 | Titan Protect Alpha Insights
Ethereum is down 2.0% to $1,775, underperforming Bitcoin on the day. This ETH-BTC spread divergence is a signal worth tracking. When Ethereum underperforms Bitcoin in a risk-uncertain environment, it suggests the market is preferring the simpler, higher-liquidity store-of-value narrative of Bitcoin over Ethereum’s more complex smart contract and DeFi utility case. At $1,775, ETH is at a level where near-term direction is unclear.
What the Analysis Shows
Ethereum’s underperformance relative to Bitcoin is a recurring pattern in risk-uncertain environments. Bitcoin benefits from the institutional ETF bid and the digital gold narrative. Ethereum’s value is tied more directly to on-chain activity: DeFi usage, NFT markets, Layer 2 transaction volumes. When macro uncertainty rises, these speculative use cases tend to see reduced activity, which reduces the demand case for ETH.
The $1,775 level is a meaningful reference point. Below $1,800 and ETH is back in consolidation territory. The question is whether the Ethereum ecosystem can demonstrate renewed utility growth to justify a premium above Bitcoin’s relative stability. The Dencun upgrade’s impact on Layer 2 fees has been positive for transaction volumes, but it has not yet translated into a sustained ETH price premium.
Bias: Cautiously Bearish relative to Bitcoin. ETH underperforming BTC in risk-uncertain conditions is a clear signal. The $1,750 level is the next support to watch. A bounce from there with improved volume would be needed to change the near-term picture.
Key Levels
| Level | Price | Significance |
|---|---|---|
| Support 1 | $1,750 | Near-term demand level |
| Support 2 | $1,680 | Deeper structural support |
| Resistance 1 | $1,850 | Near-term recovery target |
| Resistance 2 | $1,960 | Breakout level above |
Tomorrow’s Setup
Watch the ETH/BTC ratio as the cleanest signal of relative performance. If the ratio continues falling, ETH is underperforming and the bear case within crypto strengthens. NFP-driven risk appetite will shape both, but ETH needs a catalyst of its own — on-chain activity surge or institutional ETF inflows — to reclaim leadership from Bitcoin.
Risk Note: Ethereum’s price is more sensitive to on-chain activity data than Bitcoin. A major DeFi protocol failure or security exploit would hit ETH specifically and severely. The broader crypto sentiment around NFP is a shared risk with the rest of the complex.
This analysis is for informational purposes only and does not constitute financial advice. Markets involve risk. Past performance is not indicative of future results. Always conduct your own due diligence before making any investment decisions.
Thursday 4 Jun 2026
Ethereum (ETH/USD)
Daily Read — Wednesday 3 June 2026
Current Price
$1,819
Daily Change
-2.09%
What Happened Today
Ethereum fell 2.09% to $1,819, underperforming Bitcoin’s 1.53% decline — a pattern that is familiar in risk-off environments. ETH tends to carry a higher beta than BTC during selloffs, amplifying losses when sentiment turns. At $1,819, Ethereum is testing the $1,800 psychological support level, which has been a significant battleground this year.
The network fundamentals remain solid. Transaction volumes, DeFi activity, and Layer 2 adoption continue to grow. However, in a risk-off macro environment these on-chain metrics take a back seat to sentiment and correlation trading. Ethereum trades like a high-beta tech stock when equities are selling off.
The $1,800 level is the critical support. A close below $1,800 would be technically damaging and could accelerate selling. A hold and bounce from here would be constructive for the near-term outlook.
Key Levels
| Level | Price | Significance |
|---|---|---|
| Resistance | $1,920 | Prior session high |
| Pivot | $1,819 | Current close |
| Support 1 | $1,800 | Round number / critical support |
| Support 2 | $1,680 | Monthly base |
Current Bias
Higher beta than BTC means bigger moves in both directions. Sitting at $1,800 support is precarious. The next 48 hours matter for the near-term structure.
What to Watch Tomorrow
- $1,800 support hold — the most important level in the short term
- Bitcoin direction as the leading indicator for ETH
- Any network-specific news (ETF approvals, protocol upgrades)
- Risk appetite across equities — macro correlation is very high right now
Risk Assessment
High. Around 68% risk environment. ETH at $1,800 support in a risk-off macro environment with heavy earnings and NFP event risk this week is a high-risk setup for long positions.
This content is for informational purposes only and does not constitute financial advice. Past performance is not indicative of future results. Trading involves risk of loss. Always conduct your own research before making any investment decisions.
Tuesday 2 Jun 2026
AUD/USD — Daily Framework Read | Tuesday 2 June 2026
AUD/USD | Post Close Setup Daily Read | Data basis: 2026-06-02 close
Where It Sits
Structure
Structurally AUD/USD sits above its short-term moving averages with the daily trend firmly higher. The recent advance has been orderly with no signs of distribution or topping behaviour. The reference anchor at 0.7184 acts as the bias line.
Momentum
Momentum is neutral with internal readings near the centre of the range. That is the signature of a market digesting the prior move. The tape needs a fresh catalyst to commit to direction.
Volume & Flow
Volume data is limited for this session. The positioning read is neutral — no obvious skew in either direction. Watch for flow confirmation on the next session.
Key Levels
| Level | Type | Significance | Action Zone |
|---|---|---|---|
| 0.7236 | Resistance | Upper range target, prior supply zone | Take profits / fade if rejected |
| 0.7201 | Pivot | Mid-range continuation marker | Hold = constructive; lose = consolidation |
| 0.7184 | Session close | Reference anchor for next session | Above = continuation; below = mean revert |
| 0.7156 | Support | Recent range floor, demand zone | Buy zone with defined stop |
| 0.7122 | Major support | Prior breakout retest level | Stop-out below for longs |
Three Scenarios
Continuation
AUD/USD holds the session close at 0.7184 and pushes higher on continued positioning flow. The broader trend remains intact. Watch the dollar tape for confirmation.
Range
AUD/USD opens flat and ranges around 0.7184. Neither side has conviction without a fresh data catalyst. Range trade dominates.
Mean Reversion
AUD/USD breaks below support on a shift in dollar positioning. Mean reversion within the broader trend. Watch for a clean test of support before committing.
Risk Score
Risk sits at Around 45%
Risk sits around 45 per cent. Vix at 15.7 supports a measured risk posture. sentiment at 57 is neutral. Currency pairs carry intervention and data-release headline risk. Standard sizing with defined stops — discipline beats conviction.
How to Walk It
Entry / Stop / Target structure:
- Long 0.7156 pullback | Stop 0.7122 | Target 0.7201 | R:R 2:1
- Long 0.7201 breakout | Stop 0.7184 | Target 0.7236 | R:R 1.5:1
- Fade 0.7236 rejection | Stop above resistance | Target 0.7184 | R:R 2:1
Experience-level guidance:
Beginner: Reduce size to half your standard. Trade only the cleanest setup from the entries above. If the tape opens against your bias, do nothing — wait for the second hour, when the institutional flow has tipped its hand.
Intermediate: Use the levels table to define the trading range. Fade the extremes with defined stops, take profits before the round-number resistance levels.
Advanced: The vol regime supports defined-risk structures around the key pivot levels. Keep notional small relative to your book — asymmetric speculation, not core positioning.
Continue Reading
The macro frame driving this read is unpacked in the session briefs:
Check the latest session briefs on the site.
This analysis is for educational and informational purposes only. It does not constitute financial advice. Always manage your risk independently and in accordance with your own financial circumstances.