The Tesla Framework Journal for May 2026, newest read at the top. Each dated entry is our read on the close, kept as a living record so the framework can be judged over time. This is analysis, not financial advice.
Saturday 30 May 2026
Tesla (TSLA) — Daily Read | Saturday 30 May 2026
Tesla (TSLA) | Post Close Setup Daily Read | Data basis: 2026-05-30 close
Where It Sits
Structure
Structurally Tesla (TSLA) has pulled back into the session close. The broader trend remains intact on the daily timeframe but the shorter timeframe has softened. The structure is contested near the 434.79 level.
Momentum
Momentum is firm with the daily timeframe showing clear acceleration. Internal readings sit in the upper portion of the range. The risk is not that momentum fails but that it stalls at round-number resistance and triggers profit-taking.
Volume & Flow
Flow on the session close was measured. Positioning data suggests steady accumulation rather than aggressive directional commitment. The pattern supports continuation rather than reversal.
Key Levels
| Level | Type | Significance | Action Zone |
|---|---|---|---|
| 454.00 | Resistance | Upper range target, prior supply zone | Take profits / fade if rejected |
| 441.00 | Pivot | Mid-range continuation marker | Hold = constructive; lose = consolidation |
| 434.79 | Session close | Reference anchor for next session | Above = continuation; below = mean revert |
| 424.00 | Support | Recent range floor, demand zone | Buy zone with defined stop |
| 412.00 | Major support | Prior breakout retest level | Stop-out below for longs |
Three Scenarios
Continuation
Tesla (TSLA) holds 434.79 and extends higher on continued sector leadership and institutional rotation. The broader tape supports continuation. Watch for a clean hold above the pivot.
Range
Tesla (TSLA) opens flat and churns around 434.79. Magnet to the prior close in absence of company-specific catalyst. Range trade.
Mean Reversion
Tesla (TSLA) fades on sector rotation or company-specific headline, gives back below support. Mean reversion within the broader uptrend.
Risk Score
Risk sits at Around 65%
Risk sits around 65 per cent. Vix at 15.4 supports a measured risk posture. sentiment at 61 is in greed territory. Single-stock positions carry company-specific headline risk. Standard sizing with defined stops — discipline beats conviction.
How to Walk It
Entry / Stop / Target structure:
- Long 424.00 pullback | Stop 412.00 | Target 441.00 | R:R 2:1
- Long 441.00 breakout | Stop 434.79 | Target 454.00 | R:R 1.5:1
- Fade 454.00 rejection | Stop above resistance | Target 434.79 | R:R 2:1
Experience-level guidance:
Beginner: Reduce size to half your standard. Trade only the cleanest setup from the entries above. If the tape opens against your bias, do nothing — wait for the second hour, when the institutional flow has tipped its hand.
Intermediate: Use the levels table to define the trading range. Fade the extremes with defined stops, take profits before the round-number resistance levels.
Advanced: The vol regime supports defined-risk structures around the key pivot levels. Keep notional small relative to your book — asymmetric speculation, not core positioning.
Continue Reading
The macro frame driving this read is unpacked in the session briefs:
Check the latest session briefs on the site.
This analysis is for educational and informational purposes only. It does not constitute financial advice. Always manage your risk independently and in accordance with your own financial circumstances.
Thursday 28 May 2026
Tesla (TSLA) — Daily Framework Read | Thursday 28 May 2026
Tesla (TSLA) | Post Close Setup Daily Read | Data basis: 2026-05-28 close
Where It Sits
Structure
Structurally Tesla (TSLA) sits above its short-term moving averages with the daily trend firmly higher. The recent advance has been orderly with no signs of distribution or topping behaviour. The reference anchor at 442.10 acts as the bias line.
Momentum
Momentum is neutral with internal readings near the centre of the range. That is the signature of a market digesting the prior move. The tape needs a fresh catalyst to commit to direction.
Volume & Flow
Flow on the session close was measured. Positioning data suggests steady accumulation rather than aggressive directional commitment. The pattern supports continuation rather than reversal.
Key Levels
| Level | Type | Significance | Action Zone |
|---|---|---|---|
| 454.00 | Resistance | Upper range target, prior supply zone | Take profits / fade if rejected |
| 446.00 | Pivot | Mid-range continuation marker | Hold = constructive; lose = consolidation |
| 442.10 | Session close | Reference anchor for next session | Above = continuation; below = mean revert |
| 436.00 | Support | Recent range floor, demand zone | Buy zone with defined stop |
| 428.00 | Major support | Prior breakout retest level | Stop-out below for longs |
Three Scenarios
Continuation
Tesla (TSLA) holds 442.10 and extends higher on continued sector leadership and institutional rotation. The broader tape supports continuation. Watch for a clean hold above the pivot.
Range
Tesla (TSLA) opens flat and churns around 442.10. Magnet to the prior close in absence of company-specific catalyst. Range trade.
Mean Reversion
Tesla (TSLA) fades on sector rotation or company-specific headline, gives back below support. Mean reversion within the broader uptrend.
Risk Score
Risk sits at Around 65%
Risk sits around 65 per cent. Vix at 15.7 supports a measured risk posture. sentiment at 60 is in greed territory. Single-stock positions carry company-specific headline risk. Standard sizing with defined stops — discipline beats conviction.
How to Walk It
Entry / Stop / Target structure:
- Long 436.00 pullback | Stop 428.00 | Target 446.00 | R:R 2:1
- Long 446.00 breakout | Stop 442.10 | Target 454.00 | R:R 1.5:1
- Fade 454.00 rejection | Stop above resistance | Target 442.10 | R:R 2:1
Experience-level guidance:
Beginner: Reduce size to half your standard. Trade only the cleanest setup from the entries above. If the tape opens against your bias, do nothing — wait for the second hour, when the institutional flow has tipped its hand.
Intermediate: Use the levels table to define the trading range. Fade the extremes with defined stops, take profits before the round-number resistance levels.
Advanced: The vol regime supports defined-risk structures around the key pivot levels. Keep notional small relative to your book — asymmetric speculation, not core positioning.
Continue Reading
The macro frame driving this read is unpacked in the session briefs:
Check the latest session briefs on the site.
This analysis is for educational and informational purposes only. It does not constitute financial advice. Always manage your risk independently and in accordance with your own financial circumstances.
Thursday 28 May 2026
Tesla (TSLA) — Daily Framework Read | Thursday 28 May 2026
Tesla (TSLA) | Pre Asia Setup Daily Read | Data basis: 2026-05-28 close
Where It Sits
Structure
Structurally Tesla (TSLA) sits above its short-term moving averages with the daily trend firmly higher. The recent advance has been orderly with no signs of distribution or topping behaviour. The reference anchor at 440.36 acts as the bias line.
Momentum
Momentum is neutral with internal readings near the centre of the range. That is the signature of a market digesting the prior move. The tape needs a fresh catalyst to commit to direction.
Volume & Flow
Volume data is limited for this session. The positioning read is neutral — no obvious skew in either direction. Watch for flow confirmation on the next session.
Key Levels
| Level | Type | Significance | Action Zone |
|---|---|---|---|
| 463.00 | Resistance | Upper range target, prior supply zone | Take profits / fade if rejected |
| 448.00 | Pivot | Mid-range continuation marker | Hold = constructive; lose = consolidation |
| 440.36 | Session close | Reference anchor for next session | Above = continuation; below = mean revert |
| 428.00 | Support | Recent range floor, demand zone | Buy zone with defined stop |
| 413.00 | Major support | Prior breakout retest level | Stop-out below for longs |
Three Scenarios
Continuation
Tesla (TSLA) holds 440.36 and extends higher on continued sector leadership and institutional rotation. The broader tape supports continuation. Watch for a clean hold above the pivot.
Range
Tesla (TSLA) opens flat and churns around 440.36. Magnet to the prior close in absence of company-specific catalyst. Range trade.
Mean Reversion
Tesla (TSLA) fades on sector rotation or company-specific headline, gives back below support. Mean reversion within the broader uptrend.
Risk Score
Risk sits at Around 65%
Risk sits around 65 per cent. Vix at 16.3 supports a measured risk posture. sentiment at 61 is in greed territory. Single-stock positions carry company-specific headline risk. Standard sizing with defined stops — discipline beats conviction.
How to Walk It
Entry / Stop / Target structure:
- Long 428.00 pullback | Stop 413.00 | Target 448.00 | R:R 2:1
- Long 448.00 breakout | Stop 440.36 | Target 463.00 | R:R 1.5:1
- Fade 463.00 rejection | Stop above resistance | Target 440.36 | R:R 2:1
Experience-level guidance:
Beginner: Reduce size to half your standard. Trade only the cleanest setup from the entries above. If the tape opens against your bias, do nothing — wait for the second hour, when the institutional flow has tipped its hand.
Intermediate: Use the levels table to define the trading range. Fade the extremes with defined stops, take profits before the round-number resistance levels.
Advanced: The vol regime supports defined-risk structures around the key pivot levels. Keep notional small relative to your book — asymmetric speculation, not core positioning.
Continue Reading
The macro frame driving this read is unpacked in the session briefs:
Check the latest session briefs on the site.
This analysis is for educational and informational purposes only. It does not constitute financial advice. Always manage your risk independently and in accordance with your own financial circumstances.
Tuesday 26 May 2026
Tesla (TSLA)
MOSTLY LONG
Friday Close • 25 May 2026
The Read
Tesla crossed a trend line at a key level this week, and it has held that crossover. That is not a minor chart event for a name this volatile — it is a structural signal that says the sellers who have been leaning on this level have run out of fuel. The broader picture is mostly aligned to the long side, with one element still sitting out. The trend is higher, the structure is building behind it, and momentum is pointing in the right direction. The crossover turning into a hold rather than a fake-out changes the conversation from cautious watching to active interest.
Tesla sits firmly in the Mag 7 institutional accumulation story that has been playing out all week. The put-to-call ratio below 0.6 tells you the options market is not positioned for a selloff. It is positioned for continuation. Tesla is one of the more polarising names in this group — it attracts strong sentiment both ways — but when the options flow and the price structure agree, sentiment becomes noise. The structure is trending higher. The key level crossover adds weight to that view. Institutions building positions in this name at this level are not doing so carelessly.
The risk to the thesis is also the most important thing to respect. Tesla can move 5% to 8% in a single session on news, headlines, or even a tweet. The stop has to reflect that reality. A tight stop on Tesla is an invitation to get shaken out before the move happens. The structure favours the longs here, but the execution has to be sized with full respect for how this name behaves. Getting the direction right and the size wrong is still a losing trade in something this active.
Key Levels
| Level | Price | Notes |
|---|---|---|
| Entry Zone | $305.00 – $309.00 | Retest of broken trend line from above |
| Stop | $298.00 | Below key structural base, allows volatility |
| Target 1 | $330.00 | Next significant resistance |
| R:R | ~2.3:1 | Based on midpoint entry |
Risk Assessment
Around 50%
Structure is bullish and the trend line crossover is confirmed. Risk is elevated by Tesla’s inherent volatility and headline sensitivity. The signal is not fully unified, meaning one layer is still absent. Size at no more than half of your normal allocation until full alignment arrives or a pullback entry is confirmed.
Experience Guidance
Tesla rewards traders who respect it and punishes those who don’t. The most common mistake here is chasing strength after the trend line crossover because it feels like confirmation. The smarter approach is to wait for price to come back and test that line from above — that retest turns former resistance into support, and that is the location with the cleanest risk. If you are a newer trader, use smaller size than you think you need. If you are more experienced, the structure gives you a framework to work within, but Tesla will test your patience before it tests that target.
This content is for informational and educational purposes only. It does not constitute financial advice or a recommendation to buy or sell any security. Trading financial instruments carries significant risk. Past performance is not indicative of future results. Always conduct your own research and consult a qualified financial adviser before making investment decisions.
Saturday 23 May 2026
Tesla (TSLA) — Weekend Daily Read
Framework Bias
NEUTRAL BIAS
Tesla is one of the most complex stocks to analyse using a pure price framework because CEO-related newsflow overrides technical levels with a regularity unmatched by any other large-cap. The framework is neutral on TSLA, which reflects the genuine uncertainty about whether the stock is being driven by the EV business, the AI and robotics story, the energy storage business, or Musk’s public persona at any given point.
The EV business itself has been under pressure. Competition from Chinese manufacturers has intensified, margins have been compressed by price cuts, and volume growth has slowed from the exceptional pace of prior years. These are real business challenges that would warrant a lower valuation if Tesla were a pure EV company. The market continues to pay a significant premium for the optionality embedded in Full Self-Driving, the Optimus robot project, and the energy storage business.
The framework observes that Tesla at $285 (estimated) is significantly below its all-time highs but well above the lows it visited during the worst of the Musk-distraction period earlier in 2026. That recovery suggests the bulls are willing to buy at levels around $250 to $260. The ceiling, however, requires a genuine catalyst — FSD approval, Optimus commercial deployment, or a major delivery beat.
Key Levels
| Level Type | Price | Note |
|---|---|---|
| Major Resistance | $340 | Prior swing high and key target |
| Near Resistance | $300 | Round number and near-term ceiling |
| Current Price | ~$285 | Estimated Friday close |
| Near Support | $265 | Prior week low and demand zone |
| Key Support | $250 | Round number and bull/bear line |
| Major Support | $220 | Monthly structural demand |
Trade Framework
| Scenario | Entry Zone | Stop | Target | R:R |
|---|---|---|---|---|
| Long on $265 support hold | $266 to $270 | $248 | $300 | approx 1.8:1 |
| Long on $300 break | $302 | $285 | $340 | approx 2.2:1 |
| Short on fundamental disappointment | $265 break | $280 | $230 | approx 2.3:1 |
Confidence level: around 48%. The lowest-confidence individual stock in the framework. TSLA’s CEO-driven newsflow and the uncertainty about which business narrative is driving price at any given moment make this a 48% confidence trade at best from current levels. Wait for a cleaner technical setup at either the $265 support or the $300 resistance to build conviction.
Weekend Context
The Memorial Day weekend gives Elon Musk 72 hours to make announcements, post on X, or engage in political activity that can dramatically affect Tuesday’s open. This is not a theoretical risk; it has happened multiple times in the past year. The single most important piece of Tesla pre-market due diligence before Tuesday’s open is to check what Musk has posted over the weekend.
The Robotaxi launch timeline and Full Self-Driving commercial deployment remain the key catalysts that could re-rate Tesla significantly higher. Any positive development on either front would be a material stock catalyst. Conversely, a regulatory setback from NHTSA on FSD or an accident-related investigation would weigh heavily.
Energy storage revenue (Megapack) has been growing rapidly and is becoming a meaningful contributor to Tesla’s overall revenue mix. This part of the business is less well understood by retail investors but is attracting significant institutional interest because it does not depend on Musk’s management attention in the same way the automotive and AI businesses do. It is the underappreciated part of the Tesla story.
Friday 22 May 2026
Daily Ticker Read — Friday 22 May 2026
TSLA: Holding Above $400, Watching for a Break
Tesla Inc • $417.85 • +0.14% Thursday close
Current Read
Effectively flat. Tesla is coiling above the $400 level, which has been significant psychological support for several weeks. The near-zero move on Thursday suggests neither buyers nor sellers are willing to commit right now. A coil like this ahead of a Friday session is worth watching: the resolution will tell you which way the market is leaning.
What Changed
Tesla has been consolidating for several sessions in the $410-430 range. The $400 level below represents a line in the sand. Multiple tests of that zone have held, which means there is genuine buying interest there. However, each bounce from $400 has failed to make a new high, creating a compression pattern: lower highs into a flat support.
There is no major catalyst this week that is Tesla-specific. The narrative backdrop involves CEO attention, vehicle delivery run-rate commentary from various analysts, and the ongoing question about whether the autonomous driving story will re-rate the stock higher. None of that is resolving on Friday. The trade this week is purely technical.
The wider technology sector context matters. NVDA’s sell-off has created some anxiety across high-multiple growth names. TSLA carries a high multiple based on forward expectations rather than current earnings. If risk appetite deteriorates in the afternoon session on Friday, TSLA could be dragged lower regardless of its own technical picture.
Key Levels
Long Entry
$400-405
Key support zone
Stop
$394
Below $400 structure
Target
$428-432
Prior week high zone
Resistance
$425-430 is the ceiling that has been capping each bounce. A clean break above $430 on volume opens $445. Without that break, the coil resolves lower towards $400.
Friday Scenario
Bull Case
Friday opens above $418, holds, and pushes toward the $425-428 resistance zone. The coil resolves to the upside. Look for volume expansion on the move up as confirmation. Target $428 for the session.
Bear Case
Broad tech weakness pulls TSLA below $415 in the opening hour. The coil breaks lower, $405 gets tested. If $400 then gets tested before 14:00 ET, treat it as a long opportunity only if volume washes out on the dip.
Sizing and Approach
Tesla is a name that can move 3-6% on any given day without a specific catalyst. Given the coiling pattern, a breakout in either direction could be sharp. Keep position sizes manageable. The cleanest trade is the $400-405 long if Friday gives you a test of that zone early, rather than chasing price in the middle of the range.
Avoid entering at the current $417 level without a clear directional signal. You are buying the middle of a range. Wait for the market to show you which boundary it is testing first.
Cross-References
Watch NAS100 for the macro direction. TSLA tracks the index closely when there is no stock-specific news. NVDA’s digestion is the sector read: if semis stabilise, risk appetite across growth names including TSLA improves. If NVDA continues lower, expect TSLA to struggle holding $415.
Tuesday 19 May 2026
Tesla Closes $15 Below Max Pain as Put Buyers Dominate the Options Flow
Monday 18 May 2026 | Stocks | TSLA
Session Summary
Tesla closed Monday at $409.99, sitting $15 below its options max pain level of $425 for the Friday 18 May expiry — a significant divergence that suggests the max pain gravitational pull failed to materialise for Tesla in the way it did for Apple. The put-to-call volume ratio of 0.748 is notably higher than NVDA (0.49) and AAPL (0.605), confirming that options participants are far more defensive on Tesla. Put volume of 891,158 contracts represented a heavy hedging day. Combined with a put-to-call open interest ratio of 0.775, the structural lean in Tesla options is meaningfully more bearish than its Nasdaq peers.
Daily Read
Tesla’s $15 gap below max pain at session close is an abnormal outcome for an options expiry week. Typically, the max pain mechanism exerts enough dealer hedging pressure to pull price toward the pain level. The fact that Tesla closed $15 away from $425 means one of two things: either institutional selling pressure was strong enough to overwhelm the max pain mechanics, or the market is pricing in a specific negative catalyst that offsets the upward pull from options positioning.
The put-to-call ratio of 0.748 at Tesla versus 0.49 at NVDA and 0.605 at AAPL is a meaningful divergence within the Magnificent Seven. It tells you that the same institutional participants who are bullishly positioned in AI infrastructure (NVDA) and consumer tech (AAPL) are taking a materially more cautious view on Tesla. This is consistent with Tesla’s unique exposure to EV competitive dynamics, margin pressure from price cuts, and the ongoing sensitivity of the stock to Elon Musk-related news flow. The Nasdaq being down 0.43% today would not alone explain why Tesla is so far below max pain — the company-specific discount is real.
Key Levels
| Level | Price | Context |
|---|---|---|
| Max Pain / Target | $425.00 | This week’s max pain; reclaiming $425 would represent a 3.7% recovery from Monday’s close |
| Resistance | $415.00 — $418.00 | Intermediate resistance between current price and max pain; first obstacle for bulls |
| Support / Entry (long) | $405.00 — $408.00 | Just below Monday’s close; round-number support zone worth monitoring on Tuesday open |
| Stop | $396.00 | Below $400 psychological support; a break here is a significant structural event |
| Target | $420.00 — $425.00 | Max pain recovery zone; R:R approximately 1.8:1 from $407 entry |
Tomorrow’s Setup
Bias: Cautiously bearish with a bounce possibility. The gap below max pain creates a theoretical case for mean reversion toward $425, but the put-heavy options positioning argues that investors are not convinced of a bounce.
- Bull scenario: Tuesday opens above $410, broader Nasdaq stabilises, and TSLA squeezes toward $415 — $420 as put sellers cover. A move back to $425 is possible but requires broader tech leadership first.
- Bear scenario: Monday’s close below $410 extends. A break below $400 would represent a meaningful structural breakdown and could trigger accelerated selling. The put-heavy positioning means there is ample downside protection in place for large holders.
- Volatility note: Tesla’s put-to-call ratio of 0.748 combined with the stock’s historical intraday swings means position sizing discipline is essential. Tesla regularly moves 3 — 5% in a single session.
Experience Guidance
New to TSLA trading: A 0.748 put-to-call ratio means nearly three-quarters of every dollar in options flow is positioned defensively — that is a clear signal that experienced traders are not loading up on calls right now.
Developing trader: Tesla’s gap below max pain is not a straightforward buy signal — it is equally valid to read it as the market rejecting the $425 level. Wait to see which side confirms on Tuesday morning.
Experienced trader: The $400 level below is more important than the $425 max pain above — if you are long, your stop placement must account for the possibility that the market tests $400 before bouncing. A stop at $396 keeps you in the trade while respecting the major support.
This content is for informational and educational purposes only and does not constitute financial advice. Past performance is not indicative of future results. All trading involves risk. Always conduct your own research before making any investment decisions.
Monday 18 May 2026
Tesla Closes $15 Below Max Pain as Put Buyers Dominate the Options Flow
Monday 18 May 2026 | Stocks | TSLA
Session Summary
Tesla closed Monday at $409.99, sitting $15 below its options max pain level of $425 for the Friday 18 May expiry — a significant divergence that suggests the max pain gravitational pull failed to materialise for Tesla in the way it did for Apple. The put-to-call volume ratio of 0.748 is notably higher than NVDA (0.49) and AAPL (0.605), confirming that options participants are far more defensive on Tesla. Put volume of 891,158 contracts represented a heavy hedging day. Combined with a put-to-call open interest ratio of 0.775, the structural lean in Tesla options is meaningfully more bearish than its Nasdaq peers.
Daily Read
Tesla’s $15 gap below max pain at session close is an abnormal outcome for an options expiry week. Typically, the max pain mechanism exerts enough dealer hedging pressure to pull price toward the pain level. The fact that Tesla closed $15 away from $425 means one of two things: either institutional selling pressure was strong enough to overwhelm the max pain mechanics, or the market is pricing in a specific negative catalyst that offsets the upward pull from options positioning.
The put-to-call ratio of 0.748 at Tesla versus 0.49 at NVDA and 0.605 at AAPL is a meaningful divergence within the Magnificent Seven. It tells you that the same institutional participants who are bullishly positioned in AI infrastructure (NVDA) and consumer tech (AAPL) are taking a materially more cautious view on Tesla. This is consistent with Tesla’s unique exposure to EV competitive dynamics, margin pressure from price cuts, and the ongoing sensitivity of the stock to Elon Musk-related news flow. The Nasdaq being down 0.43% today would not alone explain why Tesla is so far below max pain — the company-specific discount is real.
Key Levels
| Level | Price | Context |
|---|---|---|
| Max Pain / Target | $425.00 | This week’s max pain; reclaiming $425 would represent a 3.7% recovery from Monday’s close |
| Resistance | $415.00 — $418.00 | Intermediate resistance between current price and max pain; first obstacle for bulls |
| Support / Entry (long) | $405.00 — $408.00 | Just below Monday’s close; round-number support zone worth monitoring on Tuesday open |
| Stop | $396.00 | Below $400 psychological support; a break here is a significant structural event |
| Target | $420.00 — $425.00 | Max pain recovery zone; R:R approximately 1.8:1 from $407 entry |
Tomorrow’s Setup
Bias: Cautiously bearish with a bounce possibility. The gap below max pain creates a theoretical case for mean reversion toward $425, but the put-heavy options positioning argues that investors are not convinced of a bounce.
- Bull scenario: Tuesday opens above $410, broader Nasdaq stabilises, and TSLA squeezes toward $415 — $420 as put sellers cover. A move back to $425 is possible but requires broader tech leadership first.
- Bear scenario: Monday’s close below $410 extends. A break below $400 would represent a meaningful structural breakdown and could trigger accelerated selling. The put-heavy positioning means there is ample downside protection in place for large holders.
- Volatility note: Tesla’s put-to-call ratio of 0.748 combined with the stock’s historical intraday swings means position sizing discipline is essential. Tesla regularly moves 3 — 5% in a single session.
Experience Guidance
New to TSLA trading: A 0.748 put-to-call ratio means nearly three-quarters of every dollar in options flow is positioned defensively — that is a clear signal that experienced traders are not loading up on calls right now.
Developing trader: Tesla’s gap below max pain is not a straightforward buy signal — it is equally valid to read it as the market rejecting the $425 level. Wait to see which side confirms on Tuesday morning.
Experienced trader: The $400 level below is more important than the $425 max pain above — if you are long, your stop placement must account for the possibility that the market tests $400 before bouncing. A stop at $396 keeps you in the trade while respecting the major support.
This content is for informational and educational purposes only and does not constitute financial advice. Past performance is not indicative of future results. All trading involves risk. Always conduct your own research before making any investment decisions.
Sunday 17 May 2026
TSLA : Friday 16 May 2026
Ticker Review | Technology / Automotive | Alpha Insights
Week at a Glance
TSLA is a high-beta rate-sensitive name in a rising rate environment with no institutional dark pool support. The combination does not create edge. It creates exposure.
What Happened
TSLA did not have a good week. The macro environment it operates in : consumer discretionary, growth premium valuation, rate-sensitive : faced specific headwinds on Friday that compound for Tesla specifically.
The 10-year yield breaking above 4.50% is the primary problem. Tesla carries a premium valuation built on future earnings growth expectations. Higher discount rates compress the present value of future earnings. That mathematics hits every growth stock, but it hits the highest-multiple names hardest. Tesla’s valuation premium above its current earnings is larger than most traditional automakers. The rate headwind is amplified by that premium.
Tesla is also consumer discretionary at heart. The consumer spending validated by Friday’s hot retail data is spending on necessities and experiences : Walmart beat, Home Depot beat. A $50,000 electric vehicle is a different purchasing decision in a 4.50%+ rate environment. Auto financing costs are rising. That creates friction in the sales cycle even if consumer balance sheets remain healthy overall.
The dark pool data is unambiguous. No institutional accumulation signal for TSLA on Friday. $11.88 billion moved through dark pools and none of it went into TSLA. When institutions have that much to deploy and they pass on your stock, that is data.
What the Alpha Insights Said
Sector Flow : Consumer Discretionary: REDUCE
Consumer discretionary received a REDUCE rating in the sector analysis. The reasoning: rate lag is building. Consumer spending is holding now (validated by retail sales and Walmart/Home Depot beats). But the two-to-three quarter lag between rate rises and demand destruction means the current data is backward-looking. Forward earnings for consumer discretionary face a headwind that is not yet visible in the numbers. TSLA is in this category with additional rate-sensitivity on its valuation multiple.
Institutional Flow Read : Consumer Discretionary Absent from Dark Pool
The institutional flow analysis showed NVDA at $2.96B dark pool, energy accumulation, and mild accumulation in SPX and large-cap. Consumer discretionary broad was not in the accumulation column. When the largest single-session dark pool total of the quarter ($11.88B) avoids your sector, the institutional message is clear. The capital is going elsewhere.
Macro Pulse : Rising Rates Hit Growth Multiples
The macro analysis documented that 10-year above 4.50% compresses growth multiples. Historically at 4.50%+, the market has justified forward P/E of 16-18x not 21x. Tesla’s premium multiple is vulnerable in this environment. The rate headwind does not care about the quality of the underlying business. It is arithmetic applied to discounted cash flows. Higher discount rates, lower present values.
Tactics : No Trade Plan for TSLA
The tactics analysis produced no trade plan for TSLA. The only positions with detailed entry/stop/target plans were crude, GBP, NVDA, gold, EUR/USD, and SPX range. TSLA did not qualify for a structured trade setup in any of the 14 analytical posts. When the framework processes all available data and produces no plan for an instrument, that is the framework’s answer. The answer for TSLA is no current edge.
Key Factors
| Factor | Reading | TSLA Impact |
|---|---|---|
| 10Y Yield | 4.50%+ | Compresses growth multiple. Direct headwind for premium valuation names. |
| Auto Financing Cost | Rising | 4.50%+ base rate creates friction in high-ticket consumer purchases. |
| Dark Pool Signal | None | Institutions deployed $11.88B Friday. Zero into TSLA. |
| Sentiment Beta | High | TSLA amplifies index moves. Down days hit harder than up days help in trending periods. |
| Macro Sensitivity | Very High | Consumer discretionary + growth multiple + rate environment = triple sensitivity. |
Signal + Bias
High-beta instrument in a rising rate environment with no institutional support. The conditions that would justify entry (rates declining, VIX settling, institutional accumulation signal) are not present.
This is not a judgement on Tesla as a business. It is a read on the current macro environment relative to TSLA’s specific characteristics. High-beta instruments require either a confirmed bullish macro trend or a specific technical setup with institutional backing. Neither is present for TSLA right now.
The capital that would go into TSLA is better deployed in instruments where the framework is pointing with clear signal. Crude is MAX. NVDA is STANDARD with a clear gate. GBP is STANDARD. TSLA has none of that structure behind it.
Next Week Setup
TSLA’s environment does not materially change next week without a macro shift. The FOMC minutes on Wednesday 14:00 ET are the primary thing to watch. If the minutes are dovish : signalling that rate cuts are back on the agenda : TSLA benefits disproportionately because its premium valuation becomes more sustainable at lower discount rates. That is the bull scenario for TSLA re-entry.
The consumer earnings cluster on Wednesday (Target, Lowe’s, TJX) provides a read on consumer discretionary spending broadly. If consumer spending remains strong but guidance turns cautious on second-half expectations, that is the rate-lag signal starting to show. For TSLA, cautious consumer guidance would push re-entry further out.
The VIX level matters for TSLA specifically because of its beta. At VIX 18.43 with a new floor of 17-20, TSLA’s intraday range is wider than normal. Position sizing rules require 30-40% reduction from baseline across all instruments. For high-beta names like TSLA, the equivalent reduction should be more aggressive. The risk-reward in wide-range conditions without institutional backing is poor.
Conditions for TSLA Re-engagement
- 10-year yield falls below 4.20% (removes rate compression headwind)
- VIX settles below 17 (reduces beta amplification risk)
- Institutional dark pool signal appears (confirmation of institutional floor)
- Consumer sector upgraded from REDUCE to STANDARD or better
None of these conditions are met this week. Revisit after FOMC minutes resolution.
Risk Score
Why around 65%: Three compounding headwinds: rising rates compress the premium valuation multiple, 4.50%+ financing costs create friction in the sales cycle for high-ticket consumer items, and there is zero institutional dark pool support confirmed for Friday’s session. High-beta characteristics mean the downside in Scenario C is amplified relative to the index. The risk-reward does not justify entry in the current environment. Wait for conditions to change.
Alpha Insights : Friday 16 May 2026. For informational purposes only. Not financial advice. All trading involves risk of loss.
Friday 15 May 2026
Tesla (TSLA) — Daily Read | Friday 15 May 2026
Friday close | TSLA ~$435 est | Thursday’s clean participation reversed on sell-off day | Not financial advice
WHAT CHANGED FROM YESTERDAY
Yesterday TSLA was at $449.22 (+0.89%), participating cleanly in the CPI-driven risk-on session. It moved with the market as a growth stock rather than a car company — which is how the market treats it when risk appetite is high. The read noted TSLA participates on risk-on days and retreats on risk-off days. Today is the retreat. With IWM at -2.41% (the weakest major index), SPY at -1.20%, and QQQ at -1.51%, TSLA as a high-beta growth/risk proxy is estimated down 3-4% to around $430-435. The $449 level that was the Thursday close is now the first resistance level for any recovery next week.
HEADLINE STATE: SELL-OFF PARTICIPATION — TSLA Follows Risk-Off Lower, ~3-4% Estimated Decline
Tesla is a beta amplifier. On Thursday (+0.89%) it outperformed SPY (+0.78%) slightly. On Friday in a sell-off environment, expect TSLA to underperform. IWM’s -2.41% is the relevant comparison — TSLA has more in common with growth-sensitive small-cap behaviour than with the steady Dow components. The growth concern that drove IWM to -2.41% applies directly to Tesla’s valuation premium. The stock is priced for a future that requires a certain growth environment. When that environment is questioned, the premium compresses.
| Metric | Thu 14 May | Fri 15 May | Note |
|---|---|---|---|
| TSLA | $449.22 (+0.89%) | ~$435 est (-3% est) | Risk-off reversal |
| IWM (best comparison) | ~$284 | $277.60 (-2.41%) | Growth index hardest hit |
| Character | Growth stock in risk-on | Growth stock in risk-off | Symmetric beta |
| VIX | ~17.3 | 18.43 (+6.78%) | Risk repriced = TSLA repriced |
KEY LEVELS INTO NEXT WEEK
- $449.22 — Thursday close and now the first resistance for a recovery next week.
- $435 — estimated Friday close, first reference for Monday.
- $420 — meaningful support below. A Monday open at or below here signals the sell-off has more momentum.
- $400 — the psychological level and deeper structural support. Only in view if the sell-off extends significantly next week.
OVERWATCH CONTEXT
The Overwatch earnings repricing cycle signal captures TSLA’s situation precisely. TSLA is one of the most premium-valued stocks in the market relative to its current earnings. That premium requires a certain future — growth, autonomous driving adoption, energy storage scaling. When the macro data prints soft (Retail Sales disappointing on growth), the market discounts those futures at a higher risk rate. Higher discount rate = lower present value = TSLA’s premium compresses. The -3 to -4% estimate for Friday is the premium compression in action. It is not a fundamental change to Tesla’s business. It is the market adjusting what it is willing to pay for uncertain future earnings in a more uncertain growth environment.
WHAT TO WATCH NEXT WEEK
- IWM direction next week. TSLA tracks growth sentiment as closely as the Russell 2000. IWM up = TSLA up.
- Any TSLA-specific catalyst — delivery numbers, Cybertruck updates, energy storage contracts — overrides the macro beta temporarily.
- $449 reclaim next week on recovering volume confirms Thursday’s risk-on move was not a false break.
- VIX below 17 next week is the cleanest signal for TSLA recovery. Risk-on returns, TSLA premium re-expands.
Friday 15 May 2026 | Not financial advice. For informational purposes only.
Friday 15 May 2026
Tesla Inc (TSLA) — Daily Read | Friday 15 May 2026
Post-CPI close | Rate-cut + growth confirmation = dual tailwind for TSLA | Not financial advice
WHAT CHANGED FROM YESTERDAY
Yesterday’s read identified TSLA as a dual-sensitivity instrument: it benefits from both the rate-cut repricing (high forward earnings multiple, long growth runway like NVDA) and from the growth confirmation story (EV demand requires consumer confidence and growth optimism). Thursday’s CPI confirmation delivered both catalysts simultaneously. The Overwatch confirmed the 8/3/1 grid and the growth regime (Crude $102) — both are TSLA-positive. TSLA participating in the Thursday rally alongside QQQ is the expected outcome. Friday’s Retail Sales data is arguably the most important single data point for TSLA this week: strong consumer spending is direct evidence that the consumer discretionary environment that drives EV purchase decisions is healthy.
HEADLINE STATE: DUAL TAILWIND — Rate-Cut + Growth Confirmation Both Apply
TSLA sits at the intersection of two confirmed narratives. First: it is a high-duration growth stock with a forward earnings multiple that benefits from rate-cut repricing (same logic as NVDA, slightly different magnitude). Second: it is a consumer discretionary purchase — when people feel confident enough to buy a new EV, that is a consumer confidence signal. Retail Sales today is the second-stage confirmation. If the US consumer is spending, TSLA’s Q2 delivery outlook improves. Strong data means both the rate-cut repricing continues and the delivery environment is healthier than feared. That is the cleanest double-confirmation scenario for TSLA entering Friday.
Key Levels
| Level | Price | Significance |
|---|---|---|
| Post-CPI position | Participated in Thursday rally | Both rate-cut and growth narratives confirm — dual tailwind active |
| Strong RS scenario | Continuation higher | Consumer spending confirmed + rate-cut path = TSLA second leg |
| In-line data | Consolidation | Rate-cut repricing continues, growth held — steady above support |
| Weak RS risk | Consumer demand concern | Weak consumer = delivery headwind = TSLA reprices down from both angles |
| Rate sensitivity vs AAPL | Higher | TSLA multiple is larger than AAPL — rate-cut repricing matters more |
| Consumer sensitivity | Direct | EV is a consumer discretionary purchase — Retail Sales data is the forward revenue signal |
Structure · Momentum · Flow
Structure
Confirmed as part of the NAS100 participation in Thursday’s CPI rally. TSLA is a high-beta NAS100 name — when QQQ leads, TSLA tends to participate with amplified returns.
Momentum
Positive from Thursday’s event. TSLA’s high beta to the index means its momentum amplifies index moves. In a rate-cut + growth confirmation environment, TSLA momentum is one of the stronger trades in the NAS100 complex.
Flow
Two flows operating: rate-cut repricing (growth stock discount rate falls) and consumer confidence (EV demand environment improves). Both active. Both confirmed by Thursday’s data. Both continue as long as the macro picture holds.
| Bias | LONG — dual tailwind confirmed, consumer data is the next input |
| Risk estimate | Around 25% — binary on Retail Sales, but both macro narratives confirm |
| Best outcome today | Strong RS = rate repricing + consumer confirmation = TSLA second leg |
| Risk case | Weak RS = consumer demand concern = hits TSLA from both the growth and delivery angles |
| Week carry | Bullish — dual-sensitivity to the two biggest confirmed narratives of the week |
This content is for educational and informational purposes only and does not constitute financial advice. Past analysis does not guarantee future results. Always conduct your own research before making any trading decisions.
Thursday 14 May 2026
Tesla (TSLA) — Daily Read | Thursday 14 May 2026
Post-CPI mid-session | Participating cleanly in the risk-on move | Not financial advice
NEW TICKER — First Entry in Daily Read Rotation
TSLA is new to the daily read rotation today. No prior read to compare against directly. Context: TSLA is at $449.22 (+0.89%) — participating solidly in the CPI-driven risk-on move, outperforming the S&P (+0.78%) and broadly in line with the QQQ (+0.85%). Tesla is behaving like a growth stock today rather than a car company — which is how the market treats it when risk appetite is high and sentiment is bullish.
HEADLINE STATE: CLEAN PARTICIPATION — +0.89%, In Line with Tech Complex
Tesla is moving with the market today. +0.89% on a CPI day with equities broadly up 0.78-0.85% is exactly what you expect from a high-beta growth stock when macro conditions improve. Unlike AAPL which is lagging, TSLA is tracking the QQQ. Tesla’s sensitivity to interest rates and economic conditions makes it a CPI-reactive stock — lower inflation = lower financing costs for car buyers = better demand outlook. The market is pricing that today. TSLA is not the star of the day (NVDA at +3.9% gets that crown) but it is a clean participant.
Key Levels
| Level | Price | Significance |
|---|---|---|
| Current price | $449.22 | +0.89% — clean CPI participation |
| $450 psychological | $450 | Just above current price — approaching a key round number |
| vs QQQ today | In line | TSLA tracking the tech ETF — clean beta behaviour |
| vs AAPL today | +1.04% outperformance | TSLA participating while AAPL lags — notable divergence |
| vs NVDA today | 3% underperformance | NVDA leading — TSLA is second tier in today’s move |
Structure · Momentum · Flow
Structure
First read on TSLA. Approaching $450 on a CPI-positive day is a positive structural signal for the near term. $450 is a round number that will attract both buyers and sellers — the price action around that level will define the next directional bias.
Momentum
Positive and aligned with the broader market. Tesla tracking QQQ suggests momentum is market-driven, not stock-specific today. Healthy participation, not a standout but not a laggard either.
Flow
TSLA benefits from both the AI/tech trade (it is a tech company by market multiple) and from the consumer demand narrative (lower rates = better auto financing). Double beneficiary on a CPI day. Flow is supportive.
TODAY’S BIAS: CAUTIOUS LONG — $450 Break Would Confirm
TSLA at $449.22 approaching $450 is the key setup. A clean break above $450 and hold would be a positive structural signal for the near-term long. If $450 acts as resistance and price fades back toward $445, it is a ranging signal and the better trade is to wait for the level to break cleanly. First read on TSLA leans cautiously positive while the market remains risk-on.
Risk: Around 40%
Clean participation in the risk-on move is a positive signal. Risk is moderate because this is the first baseline read for TSLA — no prior context to compare against. The $450 level is the binary: break above it confirms the near-term long, fail at it and the setup needs reassessment.
By Experience Level
New to this
Tesla is one of the most volatility-sensitive large-cap stocks. It swings harder than most in both directions. On good days it participates — on bad days it often falls more. Today it is participating cleanly. Use today as a baseline and track how it behaves in the next few sessions to build a read on its current character.
Developing
Watch the $450 level carefully. Round numbers in high-profile stocks attract a lot of orders — both limit orders and stop losses. A clean break with volume above $450 is a different signal to a spike and fade. Volume at the level tells you whether the break is real.
Experienced
TSLA tracking QQQ today rather than outperforming or underperforming is a “beta-normal” session. The interesting question for TSLA specifically is the Musk factor — any news flow around DOGE or political sentiment can override the macro read entirely for TSLA. Keep one eye on that risk when holding positions into the next session.
This is a daily analysis read for educational and informational purposes only. Nothing here is financial advice. Past performance is not a guide to future results. Trading carries significant risk of loss. Always apply your own risk management.
Tuesday 5 May 2026
Tesla (TSLA) — Daily Framework Read
Tesla Inc. (TSLA) | Daily Framework Read | Tuesday 5 May 2026
Tesla opens the new week pinned in a tight band beneath an old structural shelf. The analysis reads neutral — the chart is between two pieces of evidence that both deserve respect. Price is consolidating after the post-earnings repricing, with acceptance through the high three-eighty handle and an overhead reference that has rejected price more than once. Volatility on the broad tape ticked up Monday — VIX +7.65 percent to 18.29, VVIX kicking 98.29 — and that backdrop tightens the leash on a name that already runs a put-skewed options structure. The read is a coiled spring needing a session catalyst to release.
The TSLA thesis Tuesday. The chart is in a measured range under a clear overhead reference and above a defended volume shelf. With Monday’s VIX expansion and greed cooling at the edges, the analysis reads this as a neutral structure waiting for confirmation. A clean reclaim of the overhead reference flips the read constructive. A break of the lower shelf opens the next visit lower. Until one of the two prints, this is a watch, not an entry.
Where It Sits Today
FRAMEWORK READ
Neutral
Consolidation under shelf | Watch
VIX MONDAY
18.29
+7.65% on the day | Headwind backdrop
FEAR & GREED
62.9
Greed cooling from 66.1 | Risk-off whisper
SPY CLOSE
718.01
-0.37% Mon | Tape soft into Tuesday
The analysis reads TSLA neutral on a balanced auction. The post-earnings move is digested and the chart has carved a corrective range. Two markers matter directly: the upper acceptance band that sits as overhead supply, and the lower shelf where recent session lows clustered. This is textbook coil — the framework’s neutral read means the next session bar matters more than the last twenty.
The macro backdrop has shifted at the margin. Monday saw VIX expand to 18.29 with VVIX through 98, telling you the market is paying up for protection without a single named catalyst. Fear and greed slid from 66.1 to 62.9 over the same window, still in greed but losing ground. For a higher-beta consumer name, that backdrop tightens the boundary on every move.
What The Framework Reads
Structure is balance, not trend. The chart is in a measured consolidation following the earnings rebase, with acceptance through the upper three-eighties handle and a clean shelf around the recent session lows. The analysis reads neutral with bias to react — the next directional bar gets weight, not the last one.
Momentum is flat on the higher timeframe and alternating intraday — what range-bound action looks like before resolution. The framework sees no momentum buildup in either direction yet. Energy is in the index complex right now, not in the single name. When it rotates back into stock-specific stories, TSLA’s coil is one of the cleaner ones to watch.
Volume and flow are the most informative read. The profile shows two high-volume nodes — one at the upper acceptance band, one at the lower shelf — with thinner participation between them. The market has agreed on two prices and is undecided which one is next. Options skew remains put-tilted, a structural feature of the name. The desk is paid more for downside than upside, which is the asymmetry to respect on size.
Cross-asset overlay matters. Monday’s tape was a quiet drift down with a volatility uptick — SPY off thirty-seven basis points, Russell off sixty. That is not panic, it is slow drain. For a Tesla position, slow drain is the more dangerous environment because it produces gradual erosion, and erosion favours the put-skew side of the book.
Key Levels
| Level | What To Watch | Why It Matters |
|---|---|---|
| Upper acceptance shelf | Overhead supply | The framework’s primary overhead reference. A reclaim with strong volume on the session bar is the constructive trigger. A test that fails confirms the range stays in force. |
| Lower acceptance shelf | Bid defence | The lower edge of the coil. Breakdown with volume opens the next downside reference. Holding it on a flush tape says the buyers are still home. |
| Range mid-point | Decision point | The fair price between the two acceptance bands. Most of the session above it tilts bias up. Below it tilts bias down. |
| VIX 20 cross | Macro override | VIX through 20 with TSLA’s put-skew already structurally lifted is a sector-level signal to reduce, not just a single-name read. |
| SPY 715 reference | Tape floor | SPY losing 715 on a session basis puts the tape into defensive mode. Tesla rarely fights the index when the index is breaking structure. |
Three Scenarios Into The Week
| Scenario | Probability | Path |
|---|---|---|
| Sideways — Coil Holds | 45% | Range stays intact. Price oscillates between the upper acceptance shelf and the lower defended shelf. No decisive volume bar in either direction. The wider tape stays in its quiet drift, and TSLA respects its own consolidation. The framework stays neutral and the entry trigger stays armed. |
| Bull — Reclaim Plays | 30% | A session reclaim of the overhead reference with volume. VIX backs off, fear and greed re-firms above 65, and the broader tape shows energy stocks plus consumer cyclicals catching a bid. The framework flips the read constructive. Long entries become valid above the reclaimed level with a stop back inside the prior range. |
| Bear — Shelf Breaks | 25% | Price loses the lower acceptance shelf with volume. SPY simultaneously trades through 715. VIX presses 20 and the put-skew on Tesla pays out. The framework flips defensive. Short entries are valid against the broken shelf with the prior range as the invalidation. |
Risk Score
Around 60%
Neutral daily read in a moderate-risk environment. Downside factors: structural put-skew, Monday’s volatility expansion, slow drift in the index complex, cooling fear and greed. Upside factors: clean post-earnings rebase, defined lower shelf with documented bid response, unbroken weekly structure. The 60% score reflects an environment where the tape can resolve either way and size discipline matters more than directional view.
How To Walk It
Tesla is on the watch list, not the trade list. The asymmetric edge is in waiting for resolution rather than guessing the direction. The constructive trigger is a clean reclaim of the overhead reference with volume confirmation. The defensive trigger is a breakdown of the lower shelf with the index tape confirming. The trade to avoid is the middle of the range — most expensive in time, least informative in signal.
| Tier | Action | Condition |
|---|---|---|
| Today | No new entries inside the range. Watch SPY 715 and the VIX 20 line for the broader tape signal. | Coil is intact. The analysis reads neutral until a decisive bar lands. |
| Long trigger | Long on a clean reclaim of the upper acceptance shelf with volume. Stop back inside the prior range. | Reclaim must hold into the session close, not just the candle wick. |
| Short trigger | Short on a breakdown of the lower acceptance shelf with index confirmation. Invalidation is back inside the prior range. | SPY needs to be on the same page. Tesla rarely breaks alone. |
This is analysis, not financial advice. Always manage your risk.
Continue with Titan Protect
Twenty-plus instruments. One framework.
We read more than twenty instruments daily across four sessions. The framework’s sunrise call landed across the day — the Pre-NY case study shows what the lines drew, what New York did, and where the read stands.
Core
£59/mo
Indicator suite plus daily framework reads.
Edge Popular
£109/mo
Core plus Shield dashboard and member-only briefs.
Elite
£179/mo
Edge plus weekly 1:1 call and early access to new tools.
Save 15% on annual billing
Want to see the framework in action? Free Explorer tier — no card required.
Join the live community: Discord channel · Shield dashboard
Education, not financial advice. Trade your own analysis.
Sunday 3 May 2026
Tesla (TSLA) — Daily Framework Read | Sunday 3 May 2026
Tesla (TSLA) | Monday Open Framework Read | Data basis: Friday 1 May 2026 close
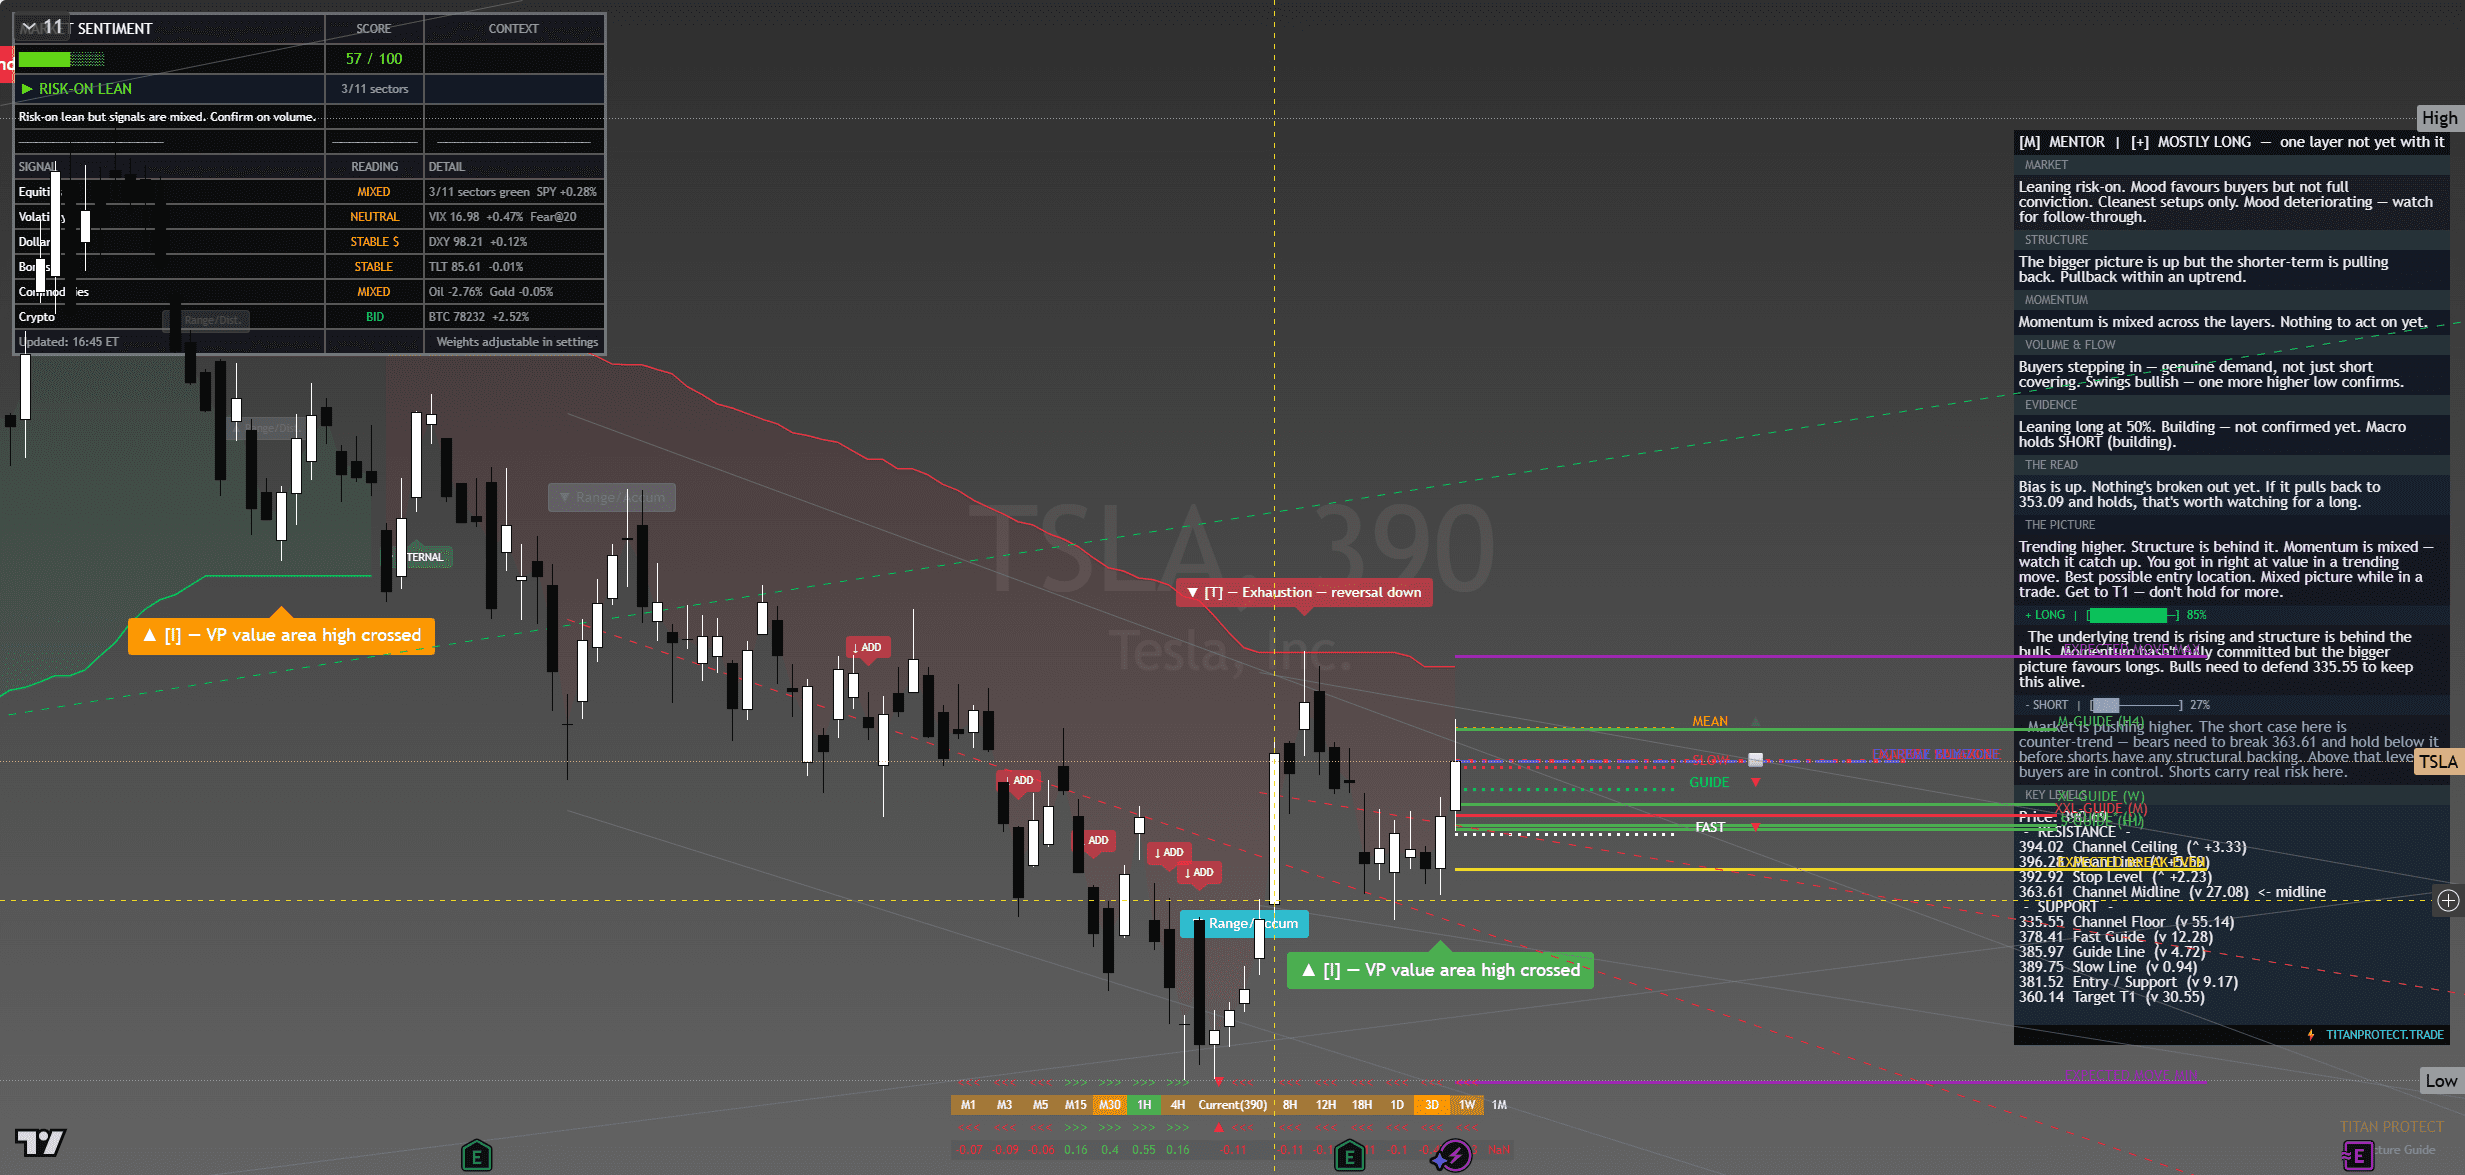
Tesla (TSLA) — chart with framework overlay. The Lens annotations show structural breaks, reversal triggers and confluence zones at the levels referenced below.
Where It Sits
Structure
Structurally TSLA is in a clear uptrend with higher highs and higher lows on daily and 4-hour timeframes. Friday’s close sits in the upper third of the recent range, holding above the rising 20-day MA. The structure is constructive but the volatility profile demands smaller size.
Momentum
Momentum is firm and accelerating on the daily timeframe — that is the signature of a high-beta name catching up to the broader tape. Internal momentum readings sit in the upper half of their range without flagging exhaustion.
Volume & Flow
TSLA volume on Friday’s close was strong, with options flow showing aggressive call buying in the 270-280 strikes. The positioning is bullish with conviction. The flip side is that crowded positioning can reverse fast.
Key Levels
| Level | Type | Significance | Action Zone |
|---|---|---|---|
| 275.00 | Resistance | Round number, recent swing high zone | Take profits if reached |
| 267.00 | Pivot | Friday intraday high cluster | Hold above = bullish bias |
| 262.40 | Friday close | Reference anchor | Bias line for Monday open |
| 256.00 | Support | Recent breakout retest level | Buy zone with defined stop |
| 248.00 | Major support | Prior consolidation floor | Stop-out below for longs |
Three Scenarios Into Monday Open
Continuation
TSLA opens firm, holds 262, takes 267 cleanly on continued risk-on mood and EV narrative. Runs to 275 round number by close. High-beta continuation.
Range
TSLA opens flat, churns 258-270 through the session. Magnet to Friday close. Range trade with high intraday volatility typical of the stock.
Mean Reversion
TSLA fades on demand headlines or competitor news, breaks 256, runs to 248. High-beta give-back possible on any risk-off shift.
Risk Score
Risk sits at Around 65% heading into Monday open.
Risk is elevated. TSLA is the highest-beta name in the major mega-cap complex with daily ranges that routinely exceed 4 percent. The structure is constructive but the stock’s volatility means stops need to be wider and position sizes proportionally smaller. The trade is real but the discipline must be tight.
How to Walk It
Entry / Stop / Target structure:
- Long 256.50-258.00 pullback | Stop 254.00 | Target 267.00 | R:R 3:1
- Long 267.50 breakout | Stop 263.00 | Target 275.00 | R:R 1.7:1
- Short 277+ rejection | Stop 280.00 | Target 268.00 | R:R 3:1
Experience-level guidance:
Beginner: The Monday open after a Friday record close is exactly the situation where over-confidence costs money. Reduce size to half your standard. Trade only the cleanest setup from the entries above. If the tape opens against your bias, do nothing — wait for the second hour, when the institutional flow has tipped its hand.
Intermediate: Use the levels table to define the trading range. Fade the extremes with defined stops, take profits before the round-number resistance levels. Do not carry directional positions through the day if you cannot watch the tape — Monday opens are prone to fast reversals.
Advanced: The vol regime is supportive of trending moves. Defined-risk options structures around the key pivot levels capture the asymmetry cleanly. Keep notional small relative to your book — Monday after a record-close week is asymmetric speculation, not core positioning.
The Sunday Composite — How This Read Sits Inside The Cross-Asset View
This single-instrument framework read is one slice of the larger Sunday weekend synthesis. The composite takes positioning, macro, sentiment, volatility, sector dispersion and trade structure as separate analytical layers and arrives at a unified composite verdict for Monday open. Each layer below is unpacked in full.
Read the full composite for the cross-asset context driving this instrument:
The institutional positioning split — Asset Managers vs Leveraged Funds in size
PCE clearance and the macro case for Monday’s carry
The three-layer sentiment disagreement — surface greed, retail neutral, professionals hedged
The vol curve term structure and what VVIX is signalling
Sector dispersion and the breadth problem behind the record close
The Monday position-management playbook — sizing tiers and trade plans
Sunday Overwatch — the unified composite verdict
Continue Reading
The macro frame driving this read is unpacked in the weekend briefs:
Sunday Setup — Reading The Tape Into Monday Open
PCE Cleared, VIX Crushed, SPY Closed 720 — Friday Post-Close Recap
This analysis is for educational and informational purposes only. It does not constitute financial advice. Always manage your risk independently and in accordance with your own financial circumstances.
Continue with Titan Protect
Twenty-plus instruments. One framework.
We read more than twenty instruments daily across four sessions. The framework’s sunrise call landed across the day — the Pre-NY case study shows what the lines drew, what New York did, and where the read stands.
Core
£59/mo
Indicator suite plus daily framework reads.
Edge Popular
£109/mo
Core plus Shield dashboard and member-only briefs.
Elite
£179/mo
Edge plus weekly 1:1 call and early access to new tools.
Save 15% on annual billing
Want to see the framework in action? Free Explorer tier — no card required.
Join the live community: Discord channel · Shield dashboard
Education, not financial advice. Trade your own analysis.