The Apple Framework Journal for April 2026, newest read at the top. Each dated entry is our read on the close, kept as a living record so the framework can be judged over time. This is analysis, not financial advice.
Thursday 30 Apr 2026
AAPL Stands Alone Tonight — Last Mag 7 Print Carries the Full Narrative Weight Into a Sell-the-Beat Tape
Apple Inc. (AAPL) | Daily Framework Read | Thursday 30 April 2026
AAPL reports after the bell tonight at approximately 21:00 BST. It is the last name in the Mag 7 cluster to print. GOOGL beat cleanly and rallied five and a half percent. MSFT beat cleanly. META beat spectacularly — EPS $10.40 against a $6.82 estimate — and fell seven percent. AMZN beat spectacularly — EPS $2.78 against $1.64 — and fell six percent. The cohort has told you the tape sells guidance concerns, capex narratives, and forward uncertainty even when the quarterly numbers are good. AAPL carries the lowest implied move of the quartet at four to five percent. Its dark pool campaign ran 157 orders at $869 million notional Tuesday. Services revenue is the watch metric. The institutional setup heading into the print is the cleanest of the four names — but the cleanest setup in this tape is not the same as a safe setup.
The AAPL thesis into the print. The institutional campaign held at $869 million into tonight’s binary. Implied vol sits around 25%, the lowest of the quartet. Historical rate says AAPL IV overprices the realised move roughly 70% of the time over the last eight quarters. The mild call-skew in the options structure suggests the options market leans fractionally bullish — but it leans, it does not commit. The services revenue growth rate is the single metric that moves this stock. Product line is not the surprise candidate. The set-up is tighter than META or AMZN. The bar set by the sell-the-beat tape is higher than any implied move suggests. This read covers the setup into the print — not the outcome. The number has not been published.
Where It Sits Today
DARK POOL (Tue)
$869M
157 orders | Campaign sustained
IMPLIED MOVE
4–5%
IV ~25% | Lowest in quartet
OPTIONS SKEW
Call-side
Mild lean | Not a commitment
REPORT TIME
~21:00 BST
Thu 30 Apr | After-market close
The XLK sector context through Thursday: the sector has recovered 0.80 percent both Wednesday and Thursday — two consecutive days of tech recovery after the Mag 7 cluster results. SPY closed at 711.58 Wednesday with max pain at $694 for Thursday’s expiry, sitting roughly $17 above the pin. The NQ futures at 27,390 with an overnight range of 27,185 to 27,622 tell you the market is holding the cluster-result tape without panicking. That is the AAPL pre-print environment: technically constructive at the index level, thematically dangerous at the single-name level, with one print outstanding.
The AAII sentiment context matters. Weekly bulls dropped back to 38.1 percent from 46 percent the prior week — retail loaded long at the ten-week high last week and is cooling. Fear and Greed sits at 63.4, Greed, but has pulled back from 63.8 yesterday. The crowd that was most bullish last week is now watching AAPL’s print decide whether their positioning was right. That retail long position is not in AAPL specifically — but AAPL as the last Mag 7 print carries the psychological weight of confirming or breaking the week’s tech recovery narrative.
What The Framework Reads
The institutional read on AAPL is the most nuanced in the cluster. The dark pool campaign at 144 orders Monday and 157 orders Tuesday at $869 million shows mild build — not the conviction of the NVDA campaign at 896/802 orders, and not the aggression of AMZN’s 274-order build. It is a pre-print hold, not a pre-print bet. The desk maintained the campaign through the FOMC and through the risk-off moves Wednesday morning, but did not accelerate it. That is the slow money’s way of saying: we have conviction but we are sizing it proportionally to the binary risk, not the narrative conviction.
The options structure is the second layer. AAPL’s IV30 sits around 25 percent going into the print — compared to META’s 32 percent and AMZN’s 30 percent. The expected move of 4 to 5 percent is priced as the smallest single-name move in the quartet. The mild call-skew means the options market fractionally expects the upside case — but a call-skewed setup in a sell-the-beat tape is not insurance. META had put-skew and still fell seven percent. The direction of the skew tells you about pre-print positioning. The post-print move depends on what the number says about services growth and China exposure.
Services revenue is the metric. Product lines — iPhone, Mac, iPad — are not the surprise candidate this quarter. The consensus expects modest hardware growth that matches the current product cycle. Services is where the multiple lives. Apple Intelligence monetisation, App Store take rates, subscription revenue per device — these are the numbers the market will read against the services premium baked into the stock. If services growth slows, the stock reprices lower regardless of the headline EPS. If services accelerates — and GOOGL’s advertising revenue holding steady is a partial comp — the multiple expands.
China is the tail risk. The tariff narrative running through Q1 created uncertainty around both supply chain costs and consumer demand in the Greater China region. Any commentary on China sales weakness or supply chain cost guidance adds to the downside pressure that META and AMZN’s guidance language created. Any confirmation that China demand held or that supply chain costs were absorbed better than feared adds to the upside case. The earnings call commentary on China will move the stock as much as the headline number.
The cohort context sets the bar higher than 25% IV and 4 to 5 percent implied move suggest. Every investor watching AAPL tonight knows META beat by 52 percent on EPS and fell seven percent. The market did not sell because the number was bad — it sold because the forward guidance and capex commitments created uncertainty about future profitability. AAPL faces the same bar. A clean beat with clean guidance clears it. A beat with any ambiguous guidance gets sold into the same risk framework. The setup is the best in the quartet. The bar is the highest it has been in years.
Key Levels
| Level | Price / Zone | What It Means |
|---|---|---|
| Implied move upper bound | +4 to +5% | The range the options market has priced for a clean delivery. A move inside this band is the expected outcome. Vol crush occurs above this. |
| Implied move lower bound | -4 to -5% | The downside band. META and AMZN both exceeded their downside implied moves on guidance concerns. This is the floor the options market is pricing — not necessarily the floor the stock holds. |
| Campaign support zone | Dark pool cost basis | 157 orders, $869M notional provides structural support at the institutional accumulation level. Campaign only reduces on a sustained narrative break. |
| Services acceleration threshold | Strong YoY services growth | If services revenue shows meaningful acceleration vs prior quarters, the multiple-expansion case is intact. This is what the call-skew is pricing as the thin upside tail. |
| Sell-the-beat risk zone | -6 to -8% (cohort tail) | META fell 7%, AMZN fell 6% on beats. If guidance disappoints or China commentary is negative, AAPL can trade through its implied move the same way its peers did. |
| NQ support (index floor) | 27,000 | An AAPL miss sending NQ below 27,000 activates the negative-gamma mechanics identified in Wednesday’s options structure analysis. |
Three Scenarios Into the Print Tonight
Note: AAPL has not reported as of this read’s publication. The following scenarios are pre-print analysis frameworks, not outcome predictions. This section will be superseded by the post-close update once the number is published.
| Scenario | Probability | Path Into the Print |
|---|---|---|
| Clean Beat + Clean Guidance | 40% | Services growth accelerates or holds strong. China commentary neutral or positive. No guidance cuts. Stock rallies inside the 4–5% implied move. Vol sellers collect. NQ extends above 27,400. Campaign extension justified. |
| Beat But Guidance Friction | 35% | Numbers beat consensus but services growth decelerates, China commentary cautious, or capex guidance higher than expected. Stock sells the beat 3–5%. Tape follows META/AMZN pattern. NQ holds 27,000 but stalls. PCE Friday becomes the next resolver. |
| Miss or Substantial Miss-to-Guidance | 25% | Services disappoints materially or China exposure shows. Stock falls 5–8%, through the implied move band. NQ breaks 27,000. Hedge book activates. PCE Friday becomes a compounding risk rather than a resolver. Campaign at $869M takes meaningful mark-to-market pressure. |
Risk Score
Around 80%
AAPL is the highest single-stock risk on the board today. Not because the setup is bad — it is the best in the quartet. But because the interaction of the print tonight, the sell-the-beat tape this week, PCE Friday tomorrow, and VIX3M still building (+3.42% today to 21.19) stacks risks in sequence rather than independently. Factors pushing risk higher: cohort sold the beat twice already, VVIX at 96, PCE Friday unknown, China tail active. Factors capping the extreme: campaign intact, lowest implied move, call-skewed structure, AAPL’s historical IV overpricing rate of 70% in last eight quarters. The 80% score reflects that this is the single most consequential print of the week and the number is unknown.
How To Walk It
The Pre-NY brief said it clearly: no naked equity longs into AAPL tonight. META and AMZN showed you what the market does to beats in this environment. That call stands. The framework read here does not change the tactical guidance — it adds the structural context. If you are trading around AAPL tonight, the discipline is: defined size, defined stop, no overnight hold without a plan for the scenario where the stock goes through the downside implied move.
| Tier | Action | Condition |
|---|---|---|
| Pre-print | No naked equity exposure added before the number | The cohort template — META beat 52%, fell 7% — is the rule |
| Post-print — clean beat | Wait for AH gap confirmation, then stalk long on first pullback to the AH floor | Services growth confirmed. Stop below AH low. Size at most 50% of normal. |
| Post-print — sell the beat | Short on failed rally through the prior regular-session close after AH opens lower on a beat | Guidance disappointed. Mirror the META template. Stop above the AH high. |
| Post-print — PCE Friday | Square all AAPL positions before 13:30 BST Friday regardless of overnight direction | PCE is the second gate. Do not carry single-name binary overnight AND into a macro binary the same morning. |
Continue Reading
- GOOGL Vindicated The Slow Money. Now AAPL, MSFT, META and AMZN Decide Whether The Cohort Holds — Earnings Echo Wednesday 29 April 2026
- Mag 7 Campaigns Held, SPY Block Doubled, Hedges Reloaded — Positioning Wednesday 29 April 2026
- Mag 7 Quartet IV Crush Stacked Against Friday PCE Tail — Option Watch Wednesday 29 April 2026
- Four-Way Dissent, $700 Billion on the Line Tonight — Overwatch Wednesday 29 April 2026
This is analysis, not financial advice. Always manage your risk.
Sunday 26 Apr 2026
AAPL Sits 39 Cents From Max Pain Going Into Thursday’s Earnings. The Tape Is Loaded Both Sides.
Daily Ticker Read | Sunday 26 April 2026
Apple closed Friday at $271.06. Max pain is $270. Pinned within forty cents of gravity going into the binary print of the week. Call flow leads. Put skew pays for insurance. Framework reads long with a finger on the exit.
Where AAPL Is Right Now
| Read | Value | Note |
|---|---|---|
| Last price (Fri close) | $271.06 | Inside record-high zone |
| Max pain (next expiry) | $270.00 | Spot is 0.39% above the gravity strike |
| Expected move (this week) | ±1.32% | Pre-earnings range, blows out Thursday |
| Implied band | $267.47 to $274.65 | Pre-print only. Post-print is wider. |
| ATM implied vol | 22.7% | Calm at the money |
| OTM put IV | 177.4% | Insurance is paid. Tail-fear priced. |
| Put-to-call volume | 0.47 | Calls outweigh puts more than two to one |
Range Location
Apple sits near the upper edge of multi-week balance, within a fraction of a percent of the dealer pain point. Recent leg lifted through prior value-area low and tagged upper acceptance. Framework signal is long with one confirmation layer: tactical bias, not continuation. Doing what dealer-pinned mega-caps do into binary events: drift to max pain and wait.
Structural Read
Upward bias inside a tight pre-event band. Structure intact, momentum solid, bid steady. None of that survives a Thursday miss. Until then, the trend rewards confirmed pullbacks, not chasing breaks. Three layers stacked the same way: weekly call buyers providing the bid, the dealer cycle providing the magnet, Friday’s institutional accumulation providing the floor.
Pre-Earnings Positioning Context
Friday’s institutional tape flagged Apple as one of the heaviest accumulation prints on the screen. Block buying at $796M across 147 prints, 2.9 million shares, all logged before earnings. Desks setting position size ahead of the binary. AAPL sits inside the bullish-flow mega-cap basket with NVDA, MSFT and AMZN, where call-side conviction is paired with QQQ and IWM index hedges.
The AAPL chain shows the same hand. 270 calls cleared 34,500 contracts at 12.7x volume-to-OI. The 272.5 call cleared 28,000 at 10.7x. 270 puts cleared 21,000, 272.5 puts cleared 14,000. Two-way flow at the gravity strike is textbook straddle-stretch ahead of a vol event. Top call OI stacks $275 / $277.5 / $280 (upside zone). Top put OI sits $267.5 / $270 / $272.5 (insurance close to spot).
Translation. Long into the print with insurance. Target above $275 on a clean report, fold below $267 on a miss. The dealer position keeps Apple within walking distance of $270 until Thursday closes the gate.
Three Levels That Matter
| Level | Price | Why It Matters |
|---|---|---|
| Upside target | $275.00 | Highest call open interest. Magnet on a clean print. |
| Pin | $270.00 | Max pain. Dealer gravity. The strike the tape defends until Thursday closes. |
| Downside guard | $267.50 | Top put open interest cluster. Fail here and the chain re-rates. |
Two Trade Ideas
1. Pre-Print Long Straddle (Vol Trade)
Setup: Buy ATM straddle at $270 strike, expiry covering Thursday’s close.
Risk: 1 to 2% of account in defined premium.
Profit: Above $275 or below $265 after the print.
Stop: Time-decay loss if Apple stays $268 to $273 into Thursday. Take it before the print.
R to R: Asymmetric but expensive. Skew is rich. Use only for variance exposure, not direction.
2. Directional Long, Pre-Print Trim
Entry: Long shares or call spread on hold above $270 with confirmation through $271.50.
Stop: $267.50 close basis. Put-shelf invalidation.
T1: $275 (call OI magnet). Trim 50% here.
T2: $277.50 to $280 if the print clears.
R to R: ~1.1 to 1 to T1, ~2.5 to 1 to T2.
Rule: Reduce to a quarter or close before Thursday close. Full size through a binary print is gambling.
Time Horizons
Intraday (Mon to Wed): Trade the pin. Buy retests of $270 with stops $1 below. Sell tests of $273 to $274 on rejection. Do not carry size overnight Wednesday.
Swing (this week): Bias long, 25 to 50% size. Add only on confirmed holds above $271.50. Trim or close fully by Thursday close.
Position (2 to 4 weeks): Print decides. Above $275 holding, the structure opens to $285 and beyond. Below $267.50 closing, the institutional campaign unwinds and the next level sits closer to $260.
Risk Score: ~70% (Elevated)
Risk score factors:
- +30% Binary earnings Thursday AMC
- +15% OTM put IV at 177%, fear fully priced
- +10% Spot pinned within forty cents of max pain
- +10% Macro week stacked: Mag 7, Powell’s last presser, Hormuz live
- +5% AAII bull-flip (+14.3 points) is a contrarian warning
Net around 70%. Directional bias up. Risk elevated regardless because the catalyst is binary and the option market prices both outcomes.
The Catalyst
Apple reports Thursday AMC. That is the catalyst of the week for this name. Powell speaks, Mag 7 prints stack, Hormuz remains a tail-risk, but none of those move Apple the way the numbers will. Revenue guidance, services margin, Greater China units, AI capex: four lines the desks read first. Clear the bar: $275 magnet, $277.50 to $280 opens behind it. Disappoint: the $267.50 put shelf fails and the chain re-prices toward $260.
Until Thursday close, treat Apple as a pinned name. After, it is a different chart. Set alarms, size to survive, take T1 ahead of the print, let the report write the next page.
What We Called vs What Happened
Scoring the Wednesday 22 April read against Friday 26 April close at $271.06.
| Call (22 Apr) | Outcome (by 26 Apr) | Verdict |
|---|---|---|
| Long with high conviction, worst-to-first reversal as institutional repositioning | No follow-through. Spot drifted back from $273.17 to $271.06 over the window. Reversal stalled inside the same $268 to $275 band | Partially |
| Target $280 measured move | Not tagged. Highest print stayed below the prior swing high | Missed |
| Entry zone $268 to $270 on pullback | Pullback delivered into the upper end of the zone. Bid held, structure repaired | Confirmed |
| Stop below $260 invalidates | Stop never tested. Lowest print held well clear of $264.70 support | Confirmed |
| Resistance $276.50 on continuation | Not reached. Tape pinned to $270 max pain through the window into Thursday print | Missed |
Track record: two of five calls confirmed over the four-session window. The reversal stalled at the dealer pin instead of running, but the floor and the entry zone both held cleanly. The print on Thursday is now the resolution catalyst.
This is analysis, not financial advice. Always manage your risk. Earnings prints are binary events with the potential for sharp adverse moves.
Thursday 23 Apr 2026
Daily Framework Read | Thursday 23 April 2026 | Published 22:00 London / 17:00 New York / 07:00 Tokyo
Microsoft $415.75 -3.97%
Microsoft had a brutal session, dropping nearly 4% and leading the tech selloff. The decline was the worst single-day performance in weeks and dragged the entire NAS100 lower. The selling was broad-based within the name, suggesting portfolio-level de-risking rather than sector rotation. When MSFT falls this hard, the market is repositioning ahead of something.
Framework Read
| Layer | Reading | Interpretation |
|---|---|---|
| Direction | CAUTIOUS | Short-term damage done. Needs to stabilise |
| Structure | Broken short-term | 4% gap lower breaks the short-term uptrend |
| Momentum | Sharply negative | Momentum flipped bearish on all short-term timeframes |
| Flow | Distribution | Heavy volume selling. Institutional de-risking |
| Evidence | Cautious | Wait for stabilisation. Do not catch this falling |
Yesterday vs Today
Yesterday MSFT rallied with the broader market. Today it reversed violently. A 4% decline in the second-largest company by market cap is not normal profit-taking. This is repositioning. Whether it is earnings-related anxiety, AI capex concerns, or portfolio rebalancing, the selling was real and heavy.
The Read
MSFT at $415 is back to levels from two weeks ago, erasing the recent rally. The 4% drop demands respect. It could be a one-day flush that creates a buying opportunity, or it could be the start of a deeper pullback toward $400. The framework waits for the next session for confirmation.
The call: wait. Do not buy the dip yet. Let $410 area prove as support first. If it holds with a green candle tomorrow, consider entry. If it fails, $400 is the next stop.
Key Levels
| Level | Price | Significance |
|---|---|---|
| Resistance 2 | $435.00 | Prior high before the selloff |
| Resistance 1 | $425.00 | Breakdown level, now resistance |
| Current | $415.75 | Testing support after flush |
| Support 1 | $410.00 | Must hold for recovery thesis |
| Support 2 | $400.00 | Psychological and structural support |
| Support 3 | $390.00 | Deep support |
What We Called vs What Happened
The framework was long MSFT with the broader tech rally. Today’s 4% decline was beyond the expected pullback range. The magnitude of the move warranted an immediate pivot to cautious. Stops should have been hit for anyone positioned long with proper risk management.
Risk Assessment
Domain risk: Around 55% (elevated)
A 4% single-day decline signals elevated risk. Follow-through selling tomorrow would confirm a deeper correction. Earnings uncertainty adds to the risk profile. Do not buy the dip until the selling exhausts.
Bottom line: MSFT dropped nearly 4% in the sharpest selloff in weeks. Short-term structure is broken. Wait for $410 to prove as support before re-engaging. Do not catch a falling knife. If $410 fails, $400 is next.
Cross-reference: Today’s Sectors Report for tech rotation analysis.
This is analysis, not financial advice. Always manage your risk.
Thursday 23 Apr 2026
Daily Framework Read | Wednesday 22 April 2026 | Published 22:00 London / 17:00 New York / 07:00 Tokyo
Microsoft $432.92 +2.07%
Microsoft gained 2.07% in what is now a three-day institutional campaign. The framework says LONG with high conviction. Three consecutive days of buying with above-average volume is not retail enthusiasm. That is a systematic allocation by large funds. When institutions commit to a name for three straight sessions, the move typically has further to run.
Framework Read
| Layer | Reading | Interpretation |
|---|---|---|
| Direction | LONG | High conviction. Three-day institutional campaign. Systematic buying |
| Structure | Trending, clean | Higher highs, higher lows. No structural damage. Clean trend |
| Momentum | Sustained | Three days of positive momentum. Not a spike. Sustained buying pressure |
| Flow | Institutional campaign | Above-average volume for three straight sessions. Systematic allocation |
| Evidence | Aligned bullish | Everything confirms. Structure, momentum, flow all say the same thing |
Yesterday vs Today
Yesterday Microsoft was one of the few mega-caps in the green while others were selling off. Today it continued higher with even more volume. The persistence is the tell. One day of buying can be noise. Two days might be coincidence. Three days is a campaign. Someone with deep pockets has decided Microsoft is where they want to be, and they are not finished.
The Read
Microsoft is the institutional favourite right now. The AI narrative, the cloud revenue growth, and the dividend make it the complete package for large funds that need to own mega-cap tech. The three-day campaign is the market telling you that the smart money has made its choice. They chose Microsoft over the rest of the field.
The call: long. The campaign is ongoing, the structure is clean, and the momentum is sustained. Any pullback to $425-428 is an entry. The $445 target is the next measured move. Do not stand in front of a three-day institutional campaign.
Key Levels
| Level | Price | Significance |
|---|---|---|
| Target | $445.00 | Measured move target. Channel projection on the campaign |
| Resistance | $438.00 | Prior swing high. First test zone |
| Entry Zone | $425-428 | Pullback entry. Campaign support zone |
| Support | $420.00 | Structural support. Campaign base |
| Stop Zone | $415.00 | Below here, the three-day campaign has failed |
What We Called vs What Happened
Yesterday the framework flagged Microsoft as the institutional favourite with above-average volume buying. Today confirmed that read with a continuation of the campaign. The persistence of the buying is exactly what the framework predicted. When institutions commit, they do not stop after one day.
Risk Assessment
Domain risk: Around 20% (low)
A three-day institutional campaign with confirmed volume is one of the lowest-risk setups available. The institutions have committed and they will defend their position. The main risk is a broad market sell-off that overrides the individual name. But on a single-stock basis, the risk is minimal.
Bottom line: Microsoft is in the middle of a three-day institutional campaign. The smart money has chosen this name and they are not done. Stay long. Entry on pullbacks to $425-428. Target $438-445. Stop below $415. Do not fight the institutions when they are this committed.
Cross-reference: Today’s Positioning Report for mega-cap institutional flow analysis.
This is analysis, not financial advice. Always manage your risk.
Tuesday 21 Apr 2026
Daily Framework Read | Tuesday 22 April 2026 | Published 22:00 London / 17:00 New York / 07:00 Tokyo
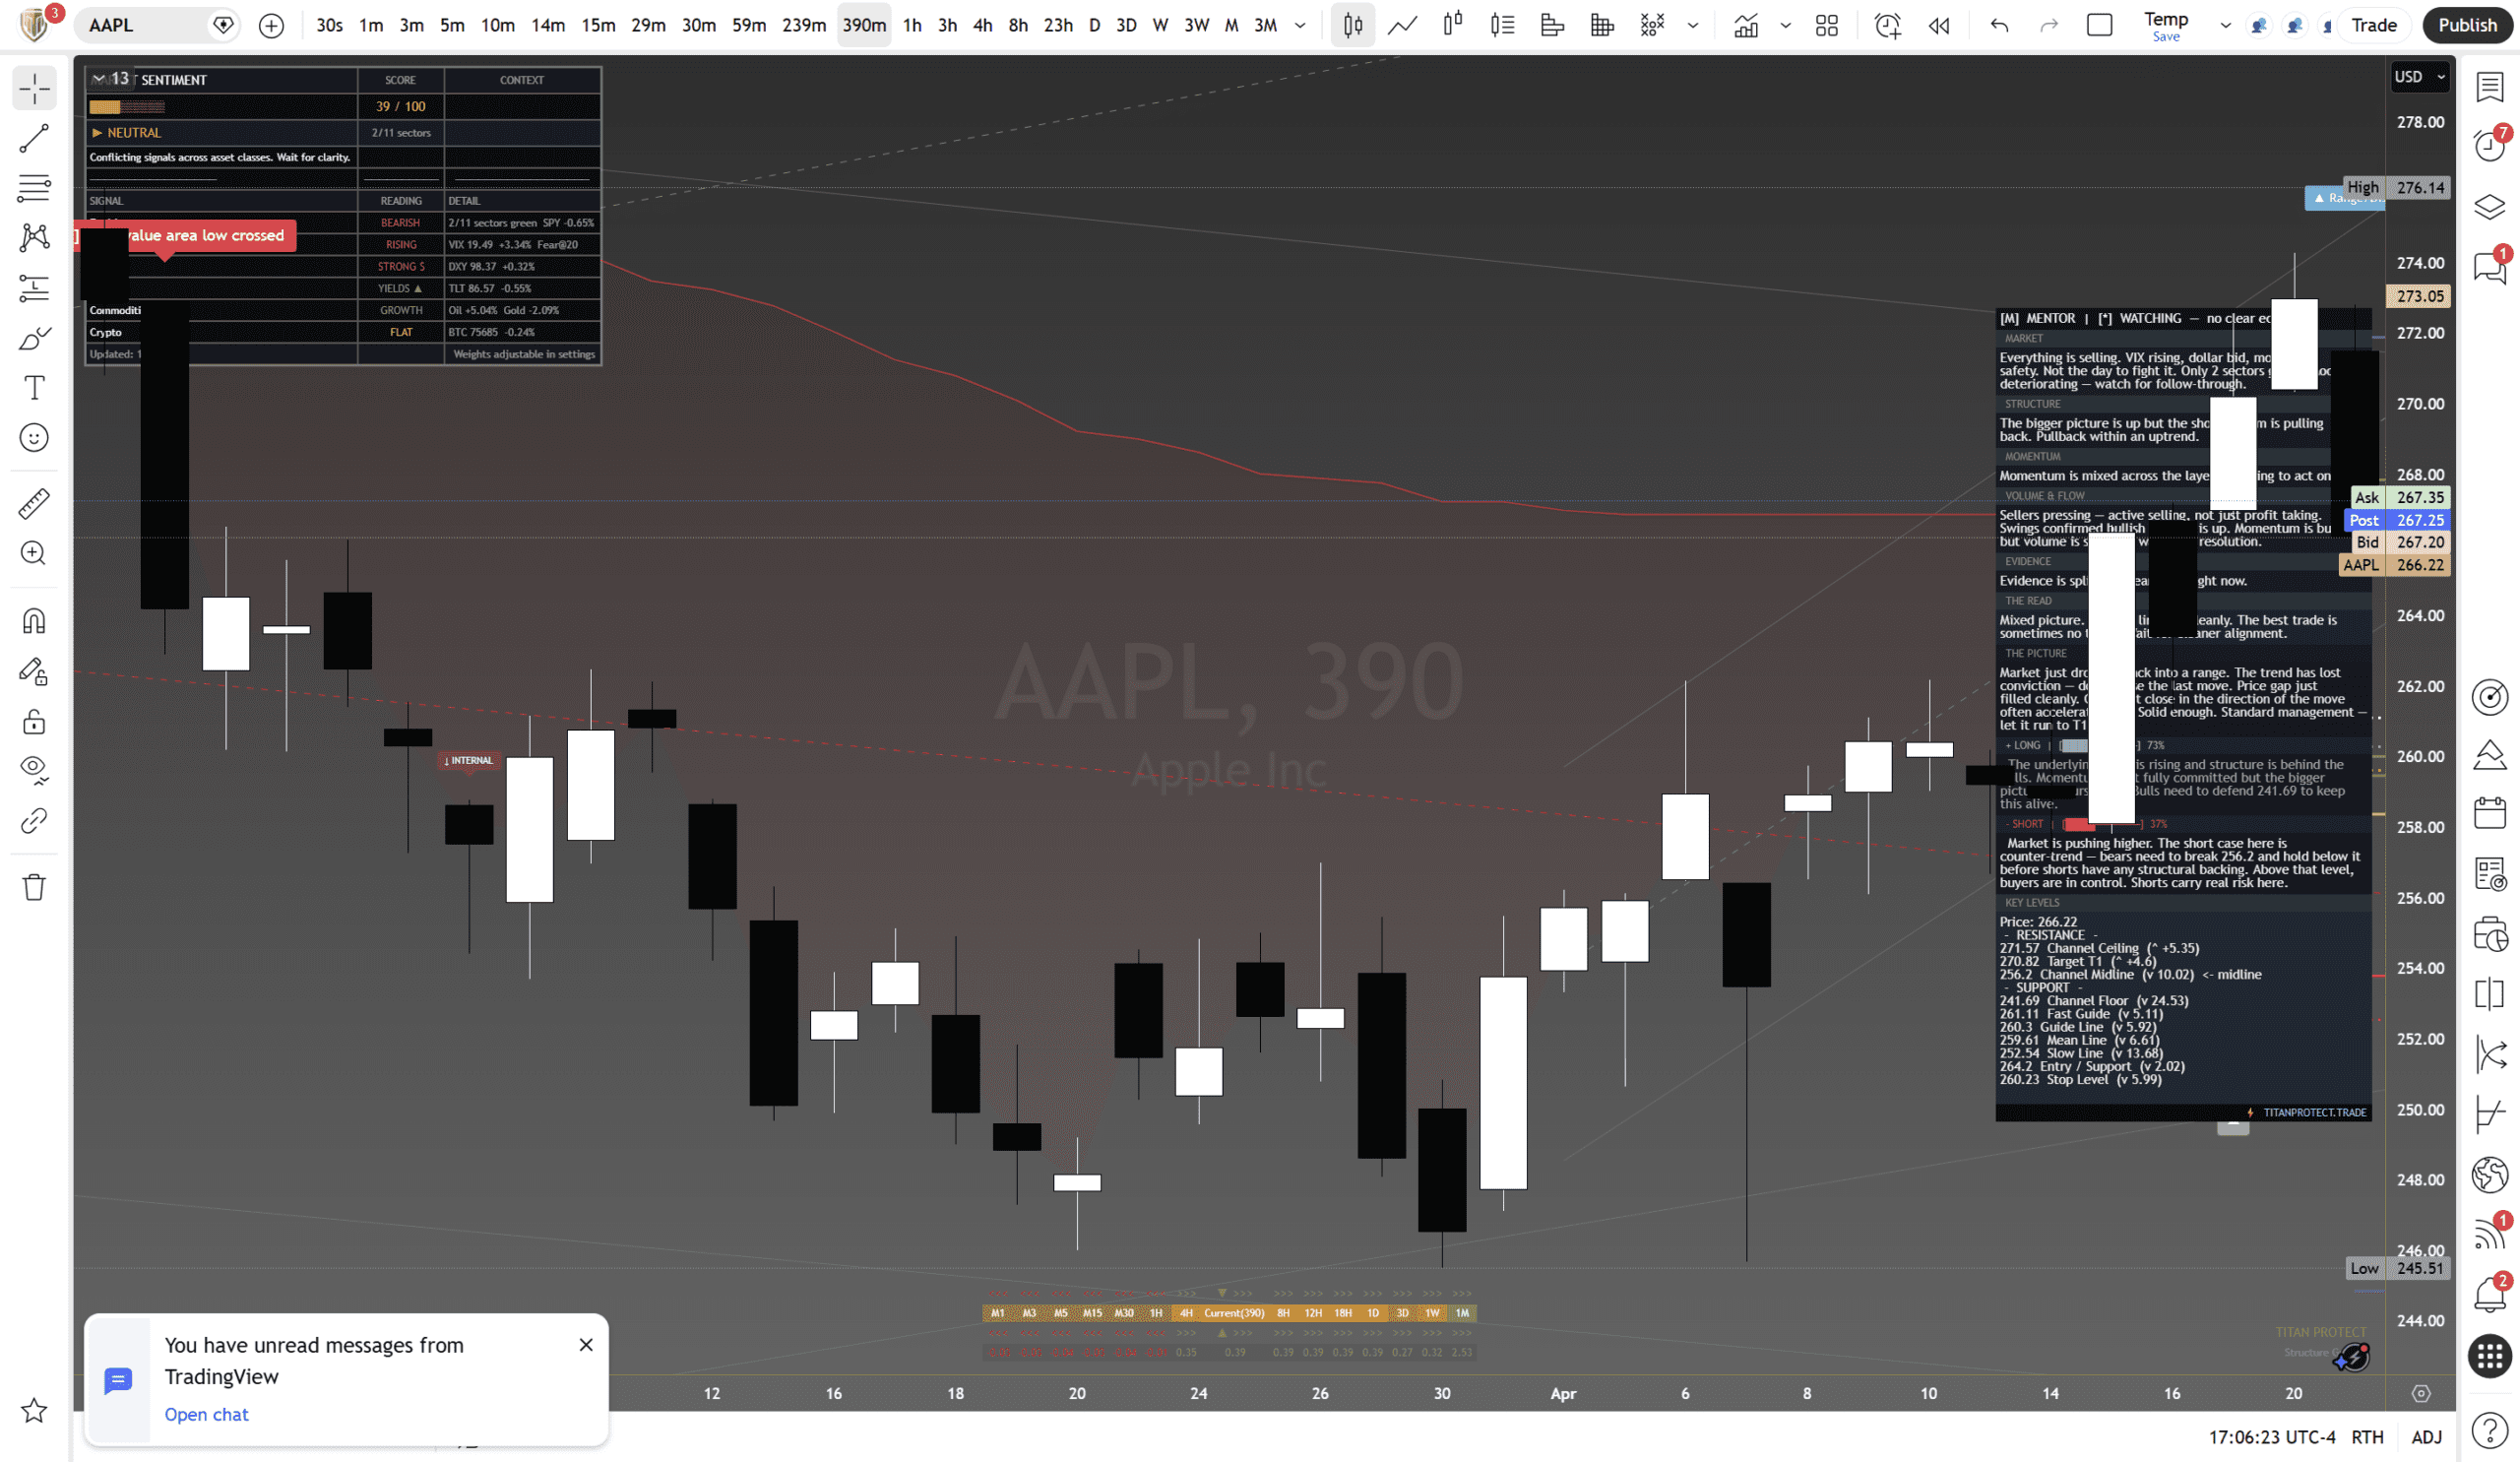
Apple closed at $266.22, down 2.52% on the session and the weakest of the mega-caps today. The framework says WATCHING. No clear edge. Nothing lines up cleanly. The best trade is sometimes no trade, and this is one of those moments where you wait for clearer alignment before committing capital.
What the Framework Says
| Layer | Reading | Interpretation |
|---|---|---|
| Direction | Watching | 73% long bias / 17% short. No clear edge yet. The framework is on the fence |
| Structure | Up, pulling back | Bigger picture is up but the shorter-term is pulling back. Pullback within an uptrend |
| Momentum | Mixed | Mixed across the layers. Nothing to act on yet |
| Flow | Sellers pressing | Sellers are pressing. Profit-taking visible. Swings confirmed bullish but volume is settling. Watch for resolution |
| Evidence | Split | Evidence is split. No clear edge right now. This is a watch, not a trade |
The Read
This is a mixed picture. Nothing lines up cleanly. The best trade is sometimes no trade. Wait for clearer alignment. The market just dropped back into a range. The trend has lost conviction. Do not chase the last move. Price gap just filled cleanly. Gaps that close in the direction of the move often accelerate after. Standard management applies: let it run to the next target.
The underlying trend is rising and structure is behind the bulls. Momentum has not fully committed but the bigger picture favours longs. Bulls need to defend $241.69 to keep this alive. That is the line. Above it, the pullback is noise. Below it, the character changes.
Market context: Everything is selling. VIX rising, dollar bid, money to safety. Not the day to fight it. Only 2 sectors green. Mood deteriorating. Apple down 2.52% in a session where MSFT gained 1.46% tells you the market is being selective. The institutions are choosing which names to own and Apple is not the priority today.
Key Levels
| Level | Price | Distance | Significance |
|---|---|---|---|
| Ceiling | $271.57 | +$5.35 | Channel ceiling. Needs to reclaim this to change the picture |
| Target 1 | $270.82 | +$4.60 | First measured target on a reversal |
| Midline | $256.20 | -$10.02 | Channel centre. Key zone for institutional positioning |
| Fast Guide | $261.11 | -$5.11 | First dynamic support layer |
| Guide Line | $260.30 | -$5.92 | Secondary structural support |
| Mean Line | $259.61 | -$6.61 | Average price. Cluster of support at $259-261 |
| Slow Line | $253.24 | -$12.98 | Deep support layer |
| Entry / Support | $264.70 | -$1.52 | Nearest actionable support level |
| Stop Level | $260.23 | -$5.99 | Below this, reassess the long case |
| Channel Floor | $241.09 | -$25.13 | Absolute structural floor. Bulls must defend this to keep the uptrend alive |
Scenario Analysis
| Scenario | Trigger | Implication |
|---|---|---|
| Long case | Hold $264.70 and structure confirms. Reclaim $271.57 | Bigger picture is behind the bulls. Momentum needs to catch up. Patient longs favoured |
| Short case | Bears need to break $256.20 midline and hold below | Market is pushing higher overall. Shorts are counter-trend. Above $256, buyers are in control. Shorts carry real risk |
| Wait case | Evidence stays split, momentum stays mixed | This is the most likely near-term outcome. Nothing to force. Watch for the layers to align |
Risk Assessment
Domain risk: Around 55% (moderate-elevated)
Apple was the biggest loser among mega-caps today at -2.52%. The evidence is split, the framework is watching, and the market is selling everything that is not Microsoft or Amazon. The longer-term structure is intact but the short-term conviction has evaporated. With VIX above 20 and a risk-off session, this is not the environment to be aggressive. Wait for the layers to align.
Bottom line: Apple is in watch mode. The framework does not have a clear edge and neither should you. The bigger picture is still bullish but today showed that Apple is not immune to broad selling. Let the evidence resolve before taking a position. The $259-261 support cluster is the zone to watch on any further weakness.
This is analysis, not financial advice. Always manage your risk.