
The Gold Framework Journal for May 2026, newest read at the top. Each dated entry is our read on the close, kept as a living record so the framework can be judged over time. This is analysis, not financial advice.
Saturday 30 May 2026
Gold (XAU/USD) — Daily Read | Saturday 30 May 2026
Gold (XAU/USD) | Post Close Setup Daily Read | Data basis: 2026-05-30 close
Where It Sits
Structure
Structurally Gold (XAU/USD) sits above its short-term moving averages with the daily trend firmly higher. The recent advance has been orderly with no signs of distribution or topping behaviour. The reference anchor at 4,589.20 acts as the bias line.
Momentum
Momentum is firm with the daily timeframe showing clear acceleration. Internal readings sit in the upper portion of the range. The risk is not that momentum fails but that it stalls at round-number resistance and triggers profit-taking.
Volume & Flow
Flow on the session close was measured. Positioning data suggests steady accumulation rather than aggressive directional commitment. The pattern supports continuation rather than reversal.
Key Levels
| Level | Type | Significance | Action Zone |
|---|---|---|---|
| 4,750 | Resistance | Upper range target, prior supply zone | Take profits / fade if rejected |
| 4,645 | Pivot | Mid-range continuation marker | Hold = constructive; lose = consolidation |
| 4,589 | Session close | Reference anchor for next session | Above = continuation; below = mean revert |
| 4,505 | Support | Recent range floor, demand zone | Buy zone with defined stop |
| 4,395 | Major support | Prior breakout retest level | Stop-out below for longs |
Three Scenarios
Continuation
Gold (XAU/USD) holds 4,589.20 and extends higher on supply tightness or safe-haven demand. The structural trend supports continuation. Watch for follow-through above the pivot.
Range
Gold (XAU/USD) opens flat and churns around 4,589.20. Digesting the recent move. Range trade with the trend as a tailwind.
Mean Reversion
Gold (XAU/USD) fades on dollar strength or demand concern, breaks below support. Mean reversion within the broader uptrend.
Risk Score
Risk sits at Around 55%
Risk sits around 55 per cent. Vix at 15.4 supports a measured risk posture. sentiment at 61 is in greed territory. Commodities carry supply-demand headline sensitivity. Standard sizing with defined stops — discipline beats conviction.
How to Walk It
Entry / Stop / Target structure:
- Long 4,505 pullback | Stop 4,395 | Target 4,645 | R:R 2:1
- Long 4,645 breakout | Stop 4,589 | Target 4,750 | R:R 1.5:1
- Fade 4,750 rejection | Stop above resistance | Target 4,589 | R:R 2:1
Experience-level guidance:
Beginner: Reduce size to half your standard. Trade only the cleanest setup from the entries above. If the tape opens against your bias, do nothing — wait for the second hour, when the institutional flow has tipped its hand.
Intermediate: Use the levels table to define the trading range. Fade the extremes with defined stops, take profits before the round-number resistance levels.
Advanced: The vol regime supports defined-risk structures around the key pivot levels. Keep notional small relative to your book — asymmetric speculation, not core positioning.
Continue Reading
The macro frame driving this read is unpacked in the session briefs:
Check the latest session briefs on the site.
This analysis is for educational and informational purposes only. It does not constitute financial advice. Always manage your risk independently and in accordance with your own financial circumstances.
Thursday 28 May 2026
Gold (XAU/USD) — Daily Framework Read | Thursday 28 May 2026
Gold (XAU/USD) | Post Close Setup Daily Read | Data basis: 2026-05-28 close
Where It Sits
Structure
Structurally Gold (XAU/USD) sits above its short-term moving averages with the daily trend firmly higher. The recent advance has been orderly with no signs of distribution or topping behaviour. The reference anchor at 4,530.20 acts as the bias line.
Momentum
Momentum is firm with the daily timeframe showing clear acceleration. Internal readings sit in the upper portion of the range. The risk is not that momentum fails but that it stalls at round-number resistance and triggers profit-taking.
Volume & Flow
Flow on the session close was measured. Positioning data suggests steady accumulation rather than aggressive directional commitment. The pattern supports continuation rather than reversal.
Key Levels
| Level | Type | Significance | Action Zone |
|---|---|---|---|
| 4,755 | Resistance | Upper range target, prior supply zone | Take profits / fade if rejected |
| 4,605 | Pivot | Mid-range continuation marker | Hold = constructive; lose = consolidation |
| 4,530 | Session close | Reference anchor for next session | Above = continuation; below = mean revert |
| 4,410 | Support | Recent range floor, demand zone | Buy zone with defined stop |
| 4,260 | Major support | Prior breakout retest level | Stop-out below for longs |
Three Scenarios
Continuation
Gold (XAU/USD) holds 4,530.20 and extends higher on supply tightness or safe-haven demand. The structural trend supports continuation. Watch for follow-through above the pivot.
Range
Gold (XAU/USD) opens flat and churns around 4,530.20. Digesting the recent move. Range trade with the trend as a tailwind.
Mean Reversion
Gold (XAU/USD) fades on dollar strength or demand concern, breaks below support. Mean reversion within the broader uptrend.
Risk Score
Risk sits at Around 55%
Risk sits around 55 per cent. Vix at 15.7 supports a measured risk posture. sentiment at 60 is in greed territory. Commodities carry supply-demand headline sensitivity. Standard sizing with defined stops — discipline beats conviction.
How to Walk It
Entry / Stop / Target structure:
- Long 4,410 pullback | Stop 4,260 | Target 4,605 | R:R 2:1
- Long 4,605 breakout | Stop 4,530 | Target 4,755 | R:R 1.5:1
- Fade 4,755 rejection | Stop above resistance | Target 4,530 | R:R 2:1
Experience-level guidance:
Beginner: Reduce size to half your standard. Trade only the cleanest setup from the entries above. If the tape opens against your bias, do nothing — wait for the second hour, when the institutional flow has tipped its hand.
Intermediate: Use the levels table to define the trading range. Fade the extremes with defined stops, take profits before the round-number resistance levels.
Advanced: The vol regime supports defined-risk structures around the key pivot levels. Keep notional small relative to your book — asymmetric speculation, not core positioning.
Continue Reading
The macro frame driving this read is unpacked in the session briefs:
Check the latest session briefs on the site.
This analysis is for educational and informational purposes only. It does not constitute financial advice. Always manage your risk independently and in accordance with your own financial circumstances.
Thursday 28 May 2026
Gold (XAU/USD) — Daily Framework Read | Thursday 28 May 2026
Gold (XAU/USD) | Pre Asia Setup Daily Read | Data basis: 2026-05-28 close
Where It Sits
Structure
Structurally Gold (XAU/USD) has pulled back into the session close. The broader trend remains intact on the daily timeframe but the shorter timeframe has softened. The structure is contested near the 4,487.60 level.
Momentum
Momentum is neutral with internal readings near the centre of the range. That is the signature of a market digesting the prior move. The tape needs a fresh catalyst to commit to direction.
Volume & Flow
Flow on the session close was measured. Positioning data suggests steady accumulation rather than aggressive directional commitment. The pattern supports continuation rather than reversal.
Key Levels
| Level | Type | Significance | Action Zone |
|---|---|---|---|
| 4,510 | Resistance | Upper range target, prior supply zone | Take profits / fade if rejected |
| 4,495 | Pivot | Mid-range continuation marker | Hold = constructive; lose = consolidation |
| 4,488 | Session close | Reference anchor for next session | Above = continuation; below = mean revert |
| 4,475 | Support | Recent range floor, demand zone | Buy zone with defined stop |
| 4,460 | Major support | Prior breakout retest level | Stop-out below for longs |
Three Scenarios
Continuation
Gold (XAU/USD) holds 4,487.60 and extends higher on supply tightness or safe-haven demand. The structural trend supports continuation. Watch for follow-through above the pivot.
Range
Gold (XAU/USD) opens flat and churns around 4,487.60. Digesting the recent move. Range trade with the trend as a tailwind.
Mean Reversion
Gold (XAU/USD) fades on dollar strength or demand concern, breaks below support. Mean reversion within the broader uptrend.
Risk Score
Risk sits at Around 55%
Risk sits around 55 per cent. Vix at 16.3 supports a measured risk posture. sentiment at 61 is in greed territory. Commodities carry supply-demand headline sensitivity. Standard sizing with defined stops — discipline beats conviction.
How to Walk It
Entry / Stop / Target structure:
- Long 4,475 pullback | Stop 4,460 | Target 4,495 | R:R 2:1
- Long 4,495 breakout | Stop 4,488 | Target 4,510 | R:R 1.5:1
- Fade 4,510 rejection | Stop above resistance | Target 4,488 | R:R 2:1
Experience-level guidance:
Beginner: Reduce size to half your standard. Trade only the cleanest setup from the entries above. If the tape opens against your bias, do nothing — wait for the second hour, when the institutional flow has tipped its hand.
Intermediate: Use the levels table to define the trading range. Fade the extremes with defined stops, take profits before the round-number resistance levels.
Advanced: The vol regime supports defined-risk structures around the key pivot levels. Keep notional small relative to your book — asymmetric speculation, not core positioning.
Continue Reading
The macro frame driving this read is unpacked in the session briefs:
Check the latest session briefs on the site.
This analysis is for educational and informational purposes only. It does not constitute financial advice. Always manage your risk independently and in accordance with your own financial circumstances.
Tuesday 26 May 2026
Gold (XAU/USD)
SELL PRESSURE
Friday Close · 25 May 2026 · 390-min
The Read
Gold is dealing with a structural correction after an extraordinary run to all-time highs. The current 390-minute picture shows price has broken through several key levels on the way down, with selling pressure appearing at every attempted bounce. What you are looking at is a market that ran too far, too fast, and is now digesting that move in a disorderly way. The immediate path of least resistance remains lower until structure rebuilds itself.
The two engines that drove Gold to its highs are still very much alive. Dollar weakness remains the primary structural tailwind — a weaker dollar makes Gold cheaper in every other currency, which lifts global demand. Add to that the geopolitical backdrop, where central banks from emerging markets continue accumulating physical, and you have a thesis that does not reverse overnight. This correction is a shakeout, not a trend change. The question is where the buyers re-emerge with conviction.
The key reference zone sits in the $3,280 to $3,305 range where price has previously found buyers and where the framework identifies a value area of significance. A clean hold and reclaim of $3,330 on a closing basis would shift the short-term picture back towards the bulls. Until that happens, any bounce into the $3,320 to $3,335 area should be treated with caution. The bigger opportunity for patient traders is a defined low forming at the value area, with a clear catalyst to re-enter the larger trend.
Key Levels
| Level | Price | Notes |
|---|---|---|
| Short Entry | $3,325 | Bounce into broken structure |
| Stop | $3,342 | Above key rejection zone |
| Target 1 | $3,285 | Value area low support |
| R:R | 2.4:1 | Minimum threshold met |
Risk
Around 55% — Gold is in a corrective phase within a larger bull trend, which means counter-trend shorts carry the risk of a sudden reversal if dollar sentiment shifts or a macro headline drops. Friday close volatility and thin weekend liquidity amplify this. Scaling size down relative to your normal position is appropriate here.
Experience Guidance
If you have been trading less than 18 months, leave this one alone this session. Corrections in strong uptrends are some of the most punishing environments for developing traders because the swings are wide and the fakeouts frequent. Wait for a clearly defined low, a structural break back above the correction zone, and then look for a trend continuation entry in the direction of the bigger picture. The trend is still your friend — just wait for the correction to finish before stepping back in.
Saturday 23 May 2026
Gold (GOLD / XAU/USD) — Weekend Daily Read
Framework Bias
LONG BIAS
Gold at $4,521 is trading at extraordinarily elevated levels by any historical standard. The metal has driven a relentless bull run through 2026, fuelled by central bank accumulation, dollar weakness, US fiscal concern following the Moody’s downgrade, and sustained demand from Asian investors who have pivoted away from US Treasuries as a safe store of value. All of those factors remain in place.
Friday’s 0.41% dip to $4,521 from $4,540 is entirely normal at these levels. This is not a reversal; it is a pause. The day’s range of only $11.20 ($4,519 to $4,530) is extremely tight for gold and indicates a market that is coiling rather than distributing. Coiling after a strong run more frequently resolves upward in a bull trend.
The framework is long gold on any dip. The $4,500 round number is the key support to watch. If gold can hold above $4,500 through the holiday weekend and open cleanly above it on Tuesday, the path to $4,600 and beyond remains open. The framework does not call the top on an instrument like this while all the macro drivers remain aligned.
Key Levels
| Level Type | Price | Note |
|---|---|---|
| Major Resistance | $4,700 | Extension target in uncharted territory |
| Near Resistance | $4,600 | Round number and next significant upside target |
| Near Resistance | $4,530 | Friday session high |
| Current Price | $4,521 | Friday close |
| Near Support | $4,500 | Round number — critical weekend watch level |
| Key Support | $4,400 | Prior breakout level and weekly demand |
| Major Support | $4,200 | Monthly structural demand and bull market base |
Trade Framework
| Scenario | Entry Zone | Stop | Target | R:R |
|---|---|---|---|---|
| Long on $4,500 support hold | $4,503 to $4,515 | $4,465 | $4,600 | approx 2.5:1 |
| Long on $4,530 break and hold | $4,535 | $4,490 | $4,620 | approx 2.0:1 |
| Short on dollar recovery / profit taking | $4,600 rejection | $4,650 | $4,450 | approx 3.0:1 |
Confidence level: around 70%. Gold is the highest-conviction long in the current framework given the multi-factor alignment (weak dollar, high real rates still supportive of gold as a hedge, central bank buying, geopolitical uncertainty). The 70% leaves room for the risk of a sharp short-covering dollar bounce that could temporarily depress the gold price.
Weekend Context
Gold at $4,521 is a statement about the world. It says that a significant portion of global capital is choosing to store value outside of government-issued debt instruments. The Moody’s US credit downgrade, the ongoing US-China tensions, and the European geopolitical backdrop all contribute to this preference. These are not short-term concerns that get resolved in a weekend.
The central bank buying story is the structural floor under gold. China, Russia, India, Poland, and a dozen other central banks have been accumulating gold reserves as a dollar-diversification strategy. This buying is essentially price-insensitive at current levels because it is a geopolitical decision, not a financial market decision. That persistent bid is why dips in gold have been shallow and bought aggressively throughout 2026.
Over the three-day weekend, watch for any geopolitical developments from the Middle East, Taiwan Strait, or Ukraine. Gold is the fastest-moving safe haven in response to geopolitical headlines. A significant event Saturday or Sunday could see gold gap meaningfully higher when Asian markets open Sunday evening. The downside risk from a full risk-on resolution is capped by the structural buyers; the upside risk from a geopolitical shock is open-ended.
Friday 22 May 2026
COMMODITIES | Friday 22 May 2026
Gold: $4,530 and Holding Despite the Shorts Lined Up Against It
Thursday close: $4,530 | Daily change: -0.21% | Bias: Structurally Bullish, Near-Term Extended
Current Read
Gold lost 21 basis points on Thursday and is still at $4,530. That is the remarkable part of this price action. The short thesis has been building for weeks. Positioning data shows speculative shorts accumulating. Every analyst note running a valuation model suggests gold is extended relative to its historical relationship with real rates. And yet the metal is sitting at $4,530 on a Thursday evening.
The reason gold keeps defying the short thesis is structural: central bank buying, particularly from emerging market central banks reducing dollar reserve exposure, has been absorbing selling pressure at levels that would have caused sharp corrections in earlier cycles. This is not speculative buying that will evaporate on a news headline. It is institutional rebalancing with a longer time horizon.
The three-basis-point Thursday dip is consistent with a market that is taking a breath rather than turning. Silver’s 0.63% gain on the same day, outperforming gold significantly, adds to the picture of a precious metals complex that still has buyers. When silver leads, it typically signals appetite rather than exhaustion.
Key Levels
What Changed Thursday
The slight dip on Thursday coincided with a marginal dollar bid and marginally firmer US data. Both of those factors are negative for gold in isolation: a stronger dollar makes dollar-denominated gold more expensive in foreign currency terms, and better US data reduces the immediate urgency for the Fed to cut rates. Gold’s ability to lose only 21 basis points in the face of those headwinds is evidence of the strength of the underlying bid.
Silver’s outperformance on the day is also worth noting in the context of gold. Silver typically moves more aggressively than gold in both directions, so its positive print while gold was negative indicates that the precious metals complex as a whole was not under meaningful selling pressure. The money went into the more speculative precious metal rather than out of the complex entirely.
Friday Scenarios
Bull Case
DXY fails at 99.50, equities show any sign of wobble, and gold recovers through $4,550 toward $4,560. A clean close above $4,560 keeps the path to $4,600 open for the following week. The geopolitical backdrop, which has not disappeared as a gold driver, remains supportive for any flight-to-safety trade.
Base Case
Gold consolidates between $4,510 and $4,550 through a quiet Friday. No major catalyst pulls it in either direction. The $4,500 level is defended, the week closes without a major swing, and the picture heading into next week remains constructive for bulls. Most likely outcome.
Bear Case
A break below $4,500 on a Friday close would be meaningful. It would represent a failure to hold the round number and would encourage the short thesis that has been building. Target in this scenario is $4,450, with $4,350 as the deeper level if selling accelerates. Requires a strong dollar catalyst or a broad risk-on rotation out of safe havens.
Sizing and Approach
Gold at $4,530 is not a level to be chasing with new long positions. The risk-reward for adding here, with $4,500 as your nearest meaningful support, is approximately 30 pips to downside support versus 70 pips to the $4,600 target. That is not terrible, but it is not the kind of setup that justifies full size when the structural short positioning is elevated.
Existing longs from lower levels should consider where their stops are. A move below $4,500 on a Friday close is a signal worth heeding, not a level to average into. Shorts against $4,560 resistance are a tactical play, but the structural trend is against the short side, so keep them small and respect the reversal risk.
Cross-References
- DXY: The most important input. Dollar below 100 is structurally supportive for gold. Watch the 99.50 level.
- Silver: Silver outperforming (+0.63% vs gold’s -0.21%) is a positive signal for the complex. Continued silver strength confirms demand, not just momentum.
- Crude Oil: Both are commodities with dollar-sensitivity. A broad commodity sell-off would weigh on gold. If crude holds near $97, commodity bulls remain in control.
- USD/JPY: Yen weakness and gold strength can coexist. An intervention that spikes the yen would typically be accompanied by risk-off flows that support gold.
Wednesday 20 May 2026
TITAN PROTECT — RAW MATERIALS RADAR · 20 MAY 2026
Gold Pulls Back, Crude Holds — Commodities Are Picking Their Battles
Gold was the star of yesterday’s session. Today it is correcting. That is healthy — the question is whether the structure that drove it higher is still intact. Across the commodity complex, the answer looks like yes.
Commodity Snapshot — 20 May 2026
| Commodity | Price | 24h Change | Range Today | Structure Signal |
|---|---|---|---|---|
| Gold (XAU) | $4,467 | -$39 (-0.87%) | $4,455 – $4,512 | Contango intact — dip, not break |
| Silver (XAG) | $73.89 | -$0.94 (-1.25%) | $73.39 – $75.23 | Underperforming gold |
| Crude WTI | $103.77 | -$0.40 (-0.38%) | Record jet demand | Physical demand solid |
| Crude Brent | $110.70 | -$0.55 (-0.49%) | $110+ floor test | Brent/WTI spread $6.93 |
| Copper (HG) | $6.17 | +0.11% (flat) | $6.15 – $6.22 | Holding after tariff relief |
| Natural Gas | $3.11 | -3.84% | Sharpest daily drop | Supply concern easing |
Gold: Yesterday’s Winner Taking a Breather
Gold closed as a standout yesterday while equities sold off — exactly the behaviour you want from a portfolio hedge. The $4,467 price today reflects a $39 overnight pullback that came on relatively low volume (24,076 contracts against a higher average). Low-volume pullbacks after a directional session are noise, not signal.
The forward market structure remains in contango — the market is still pricing a premium to own gold in the future. That structure only breaks when large institutional holders decide to exit in size. They have not done that. Asset managers held their largest net long book in months as of the last COT read. Dealers are also constructive.
What drove gold higher is still in place. G7 bond yields at 4.7% — levels not seen since 2004 — create a genuine fiscal credibility question. Japan’s 10-year bond at an all-time high above 2.80% adds to the anxiety about sovereign balance sheets. Gold benefits when institutional players lose confidence in government paper. That confidence has not recovered.
The Iran War Powers Resolution advancing through the US Senate is an additional geopolitical underpinning. Gold does not need multiple catalysts — but when it has them, the floor tends to be stickier than the bears expect.
Silver: Underperformance Is the Tell
Silver fell 1.25% today against gold’s 0.87% — that gap matters. In a genuine commodity bull run, silver tends to outperform gold once the move matures. The fact that silver is underperforming suggests this is still primarily a safe-haven, geopolitical gold trade rather than a broad industrial metals rally.
If you see silver begin to close the gap and outperform gold on a percentage basis, that is your signal that the move is broadening into industrial demand territory. Until then, prefer gold over silver as the primary exposure.
Gold/Silver ratio: Currently ~60.5x. A ratio above 80x historically favours silver as a catch-up trade. At 60x the ratio is not stretched enough to force the silver outperformance trade yet.
Crude: The Jet Fuel Story Is Real
US refineries are converting a record 12.7% of each barrel of crude into jet fuel — up 2.2 percentage points since the Iran War began. This is not a futures market story; it is a real economy demand story. Airlines are flying more, military logistics demand has risen, and refiners are responding by maximising jet output at the expense of other products.
WTI at $103.77 looks expensive in isolation. Against the backdrop of a refinery system running at record jet-fuel capacity, it looks like a supported price. The $100 level is likely a floor now, not a ceiling. Brent at $110.70 implies the global premium for crude is holding, which is consistent with ongoing geopolitical risk premium in Middle Eastern supply.
The Brent/WTI spread at $6.93 is slightly above its 12-month average. That spread widening typically precedes a WTI catch-up rally — physical buyers in the US are more insulated from the geopolitical premium, but as domestic jet demand rises, that insulation shrinks.
Copper: The Quiet Strength
Copper at $6.17 is essentially flat on the day after posting strong gains earlier in the week. The resilience of copper at these levels — when every other industrial input is softening — is notable. Copper tends to front-run economic activity. Flat copper in a risk-off day is constructive.
The China demand picture remains the biggest swing factor for copper. Any infrastructure stimulus announcement from Beijing would send copper significantly higher from this base. File that as a watch item rather than an active trade today.
Natural Gas: -3.84% Is the Outlier
NatGas at $3.11 dropped nearly 4% — the sharpest single-day move in the commodity complex today. This came as storage data suggested easing supply concerns. After a winter where cold weather expectations drove NatGas higher, the spring normalisation is hitting hard.
The $3.00–$3.10 zone is the next critical support. A break below $3.00 opens a move toward $2.70 — that would represent a full unwinding of the weather premium. Do not try to catch this falling knife without clear reversal structure.
Trade Setups by Experience
New Traders
Gold dip buy: Entry at $4,455 on a retest of today’s low with a bounce candle confirmation. Stop $4,420. Target $4,510. R:R 1.5:1.
Risk: Around 35%. The structure and forward market support the long. Bond yields are the main threat — if yields spike further, gold faces an additional flush before recovering.
Intermediate
WTI Crude long: Entry $102.50 on pullback. Stop $100.80. Target $107.00. R:R 2.6:1. Jet fuel demand underpins the trade; Iran geopolitical risk provides further upside optionality.
Risk: Around 40%. A global risk-off event that hits demand expectations could push crude below $100 quickly.
Advanced
Gold/Silver spread: Long gold / short silver as ratio approaches reversion. Target ratio narrowing from 60.5x toward 55x as the bull run matures. Pair trade — reduces outright commodity exposure.
NatGas: Wait for $3.00 support test. If it holds with a clean hourly reversal candle, the risk/reward for a long is compelling with stop $2.90, target $3.30. R:R 3.0:1. Risk: Around 50% — do not size aggressively.
Scenario Analysis
Bull case (40%): Dollar softens on fiscal concerns, gold recovers from today’s dip and tests $4,530. Crude holds above $103 on jet-fuel demand and geopolitical risk premium. Copper breaks $6.25, signalling industrial re-acceleration. Silver begins to narrow the gold gap — confirmation that the bull run is broadening.
Base case (40%): Gold grinds sideways $4,440–$4,510 for 3–5 sessions before the next leg. Crude holds $102–$106 range. Copper drifts lower to $6.00 support. NatGas continues slide to $3.00–$3.05 where buyers emerge.
Bear case (20%): 30Y yield breaks 5.25%, dollar spikes. Institutional commodity longs face margin calls. Gold drops to $4,380–$4,400 before reasserting. Crude breaks $100 on demand fears. Copper falls to $5.70. NatGas overshoots to $2.75. This scenario requires both bond yields and dollar to move in tandem — possible but requires a catalyst (Fed hawkish shock or deteriorating US fiscal news).
Dollar Impact Grid — Commodity Sensitivity
| Commodity | Dollar Up 1% | Dollar Down 1% | Other Key Driver |
|---|---|---|---|
| Gold | -0.8% to -1.2% | +0.8% to +1.2% | Sovereign bond yields, geopolitical risk |
| Silver | -1.0% to -1.5% | +1.0% to +1.5% | Industrial demand, solar panel demand |
| Crude WTI | -0.5% to -0.8% | +0.5% to +0.8% | Refinery demand, Iran geopolitics, OPEC |
| Copper | -0.6% to -1.0% | +0.6% to +1.0% | China demand, tariff policy, supply |
| Natural Gas | Minimal | Minimal | Storage levels, weather, LNG exports |
Position Sizing Guide
| Account | Max Risk/Trade | Gold CFD | Crude CFD |
|---|---|---|---|
| £2,000 | £40 (2%) | 0.01 oz equiv | 0.4 barrel equiv |
| £10,000 | £200 (2%) | 0.05 oz equiv | 1.2 barrel equiv |
| £50,000+ | £1,000 (2%) | 0.25 oz equiv | 6 barrel equiv |
Cross-References
- → COT positioning: Institutional long books intact across gold and energy; commercial shorts on DXY add to commodity bull case
- → Global grid: Iran War Powers Resolution, Japan bond yield all-time high — geopolitical and sovereign stress = gold positive
- → FX layer (Post 11): Dollar fragility at current levels is the primary tailwind for commodity longs. Monitor DXY vs 99.5 support
- → Basis layer (Post 10): Gold contango structure confirmed — roll buyers are present, not absent. Dip is a basis correction, not a reversal
Session Reference Times
| London Open (gold active) | 08:00 BST / 09:00 CEST / 03:00 ET |
| NYMEX Open (crude active) | 14:30 BST / 15:30 CEST / 09:30 ET |
| Asia Open (gold/copper) | 01:00 BST / 02:00 CEST / 20:00 ET (prior eve) |
For educational purposes only. Not financial advice. Trading commodities carries significant risk including leverage risk and physical delivery risk. Past performance is not indicative of future results.
Tuesday 19 May 2026
Gold Eyes $4,600 as Safe Haven Demand Holds Firm
Monday 18 May 2026 | Commodities | GOLD
Session Summary
Gold closed at $4,570.10 on Monday, up 0.31% on the session and extending its year-to-date run to fresh multi-decade highs. The metal opened at $4,547 and printed an intraday high of $4,588.60, confirming that buyers remain in control at current levels. Volume was solid at 149,177 contracts, and the close well above the opening print signals no distribution.
Daily Read
The macro environment is aligned squarely behind gold. The dollar index softened to 98.96, extending a multi-week weakening trend, which mechanically lifts dollar-denominated commodities. VIX closed at 17.82 after falling 3.31% on the day, which points to a measured risk-off posture rather than panic — precisely the environment where gold attracts both institutional flow and retail safe haven buying simultaneously.
The AAII sentiment survey for the week ending 13 May showed bulls at 39.3% against bears at 36.6%, a near-balanced reading. When retail opinion is this split, institutional players tend to use the uncertainty to position in hard assets. Gold’s advance today happened against a backdrop where equity indices were fractionally mixed, which is a meaningful divergence — gold did not need equity weakness to find buyers.
Key Levels
| Level | Price | Context |
|---|---|---|
| Resistance | $4,600 | Round number psychological barrier; market is now pressing against it |
| Entry (long) | $4,550 — $4,560 | Pullback into Monday’s open / intraday value area; buyers stepped in here today |
| Stop | $4,520 | Below Monday’s open and the prior intraday swing low; failure here invalidates the thesis |
| Target 1 | $4,590 | Just under today’s session high; partial profit zone |
| Target 2 | $4,620 | Extension above $4,600 breakout; R:R approximately 2:1 from entry |
R:R on the base setup: risk ~$35 for a target of ~$70 at T2. That is a workable 2:1 from a clean pullback entry.
Tomorrow’s Setup
Bias: Cautiously bullish. Gold is within striking distance of $4,600 and the conditions that drove today’s gain — a softer dollar, split retail sentiment, and quiet institutional accumulation — remain in place heading into Tuesday.
- Bull scenario: Pre-market holds above $4,550. Early London session continues to press $4,588 high. A clean break and close above $4,600 opens the $4,620 — $4,650 extension zone.
- Bear scenario: Any escalation de-escalation in geopolitical news (particularly Iran or Middle East) risks a sharp unwind. If gold gaps below $4,520 on Tuesday open, the safe haven premium has been partially priced out and the trade is off.
- Flat scenario: Consolidation between $4,540 and $4,590 as the market digests the move ahead of any US macro data mid-week.
Experience Guidance
New to gold trading: Do not chase a $23 up-day — wait for a pullback to the $4,550 area and let the level come to you before entering.
Developing trader: The $4,600 level is not a target, it is a decision point — watch how price behaves in the first 30 minutes if it tags that figure tomorrow before sizing up.
Experienced trader: With a weaker dollar and VIX still elevated above 17, the carry in holding gold long remains favourable — look to layer in on any intraday dip rather than fading the trend.
This content is for informational and educational purposes only and does not constitute financial advice. Past performance is not indicative of future results. All trading involves risk. Always conduct your own research before making any investment decisions.
Monday 18 May 2026
Gold Eyes $4,600 as Safe Haven Demand Holds Firm
Monday 18 May 2026 | Commodities | GOLD
Session Summary
Gold closed at $4,570.10 on Monday, up 0.31% on the session and extending its year-to-date run to fresh multi-decade highs. The metal opened at $4,547 and printed an intraday high of $4,588.60, confirming that buyers remain in control at current levels. Volume was solid at 149,177 contracts, and the close well above the opening print signals no distribution.
Daily Read
The macro environment is aligned squarely behind gold. The dollar index softened to 98.96, extending a multi-week weakening trend, which mechanically lifts dollar-denominated commodities. VIX closed at 17.82 after falling 3.31% on the day, which points to a measured risk-off posture rather than panic — precisely the environment where gold attracts both institutional flow and retail safe haven buying simultaneously.
The AAII sentiment survey for the week ending 13 May showed bulls at 39.3% against bears at 36.6%, a near-balanced reading. When retail opinion is this split, institutional players tend to use the uncertainty to position in hard assets. Gold’s advance today happened against a backdrop where equity indices were fractionally mixed, which is a meaningful divergence — gold did not need equity weakness to find buyers.
Key Levels
| Level | Price | Context |
|---|---|---|
| Resistance | $4,600 | Round number psychological barrier; market is now pressing against it |
| Entry (long) | $4,550 — $4,560 | Pullback into Monday’s open / intraday value area; buyers stepped in here today |
| Stop | $4,520 | Below Monday’s open and the prior intraday swing low; failure here invalidates the thesis |
| Target 1 | $4,590 | Just under today’s session high; partial profit zone |
| Target 2 | $4,620 | Extension above $4,600 breakout; R:R approximately 2:1 from entry |
R:R on the base setup: risk ~$35 for a target of ~$70 at T2. That is a workable 2:1 from a clean pullback entry.
Tomorrow’s Setup
Bias: Cautiously bullish. Gold is within striking distance of $4,600 and the conditions that drove today’s gain — a softer dollar, split retail sentiment, and quiet institutional accumulation — remain in place heading into Tuesday.
- Bull scenario: Pre-market holds above $4,550. Early London session continues to press $4,588 high. A clean break and close above $4,600 opens the $4,620 — $4,650 extension zone.
- Bear scenario: Any escalation de-escalation in geopolitical news (particularly Iran or Middle East) risks a sharp unwind. If gold gaps below $4,520 on Tuesday open, the safe haven premium has been partially priced out and the trade is off.
- Flat scenario: Consolidation between $4,540 and $4,590 as the market digests the move ahead of any US macro data mid-week.
Experience Guidance
New to gold trading: Do not chase a $23 up-day — wait for a pullback to the $4,550 area and let the level come to you before entering.
Developing trader: The $4,600 level is not a target, it is a decision point — watch how price behaves in the first 30 minutes if it tags that figure tomorrow before sizing up.
Experienced trader: With a weaker dollar and VIX still elevated above 17, the carry in holding gold long remains favourable — look to layer in on any intraday dip rather than fading the trend.
This content is for informational and educational purposes only and does not constitute financial advice. Past performance is not indicative of future results. All trading involves risk. Always conduct your own research before making any investment decisions.
Sunday 17 May 2026
GOLD : Friday 16 May 2026
Ticker Review | Commodities | Alpha Insights
Week at a Glance
What Happened
Gold dropped $122 on Friday. That is not noise. Three separate forces hit at the same time, all pointing the same direction.
Hot retail sales landed above consensus. The bond market read it instantly. Rate-cut expectations collapsed. The 10-year yield broke above 4.50% for the first time since June 2025. The dollar bid. DXY hit 99.27. Gold has no yield. When real yields rise and the dollar strengthens simultaneously, gold suffers on both fronts at once. Friday was both.
The COT data confirmed this was not a surprise to anyone who matters. Institutions had already cut 14,600 contracts the week of 12 May. Active distribution. Not a reaction to Friday’s data. Pre-built. They saw this coming and positioned before the print landed.
The options market confirmed the same read. Directional put flow of $34.1M hit GLD. That is not portfolio hedging. That is a directional bet. GLD’s negative gamma exposure sits at -$118M, meaning any decline below the $224 GLD level accelerates, not slows. Max pain sits at $225 on GLD. Approximately $4,480 spot gold. Two percent below Friday’s close. The structure pulls the price lower.
What the Alpha Insights Said
Institutional Flow Read : GLD Absent from Dark Pool
$11.88 billion moved through dark pools on Friday. Not a single dollar went into gold. Institutions bought NVDA, SPX, and energy. They sold metals. That absence is louder than any number in the dataset. When $11.88B is moving and none of it touches your asset, you have your answer.
Options Watch : Maximum Structural Pressure
GLD has the largest max pain gap of any tracked instrument: 2% below Friday’s close. The put-to-call OI ratio of 0.61 is the most put-skewed reading in the entire Friday options dataset. Negative GEX of -$118M means dealer selling amplifies every move lower. Three independent derivatives layers confirming the same direction.
Global Grid : Gold Fully Exposed to the Dollar Script
DXY is the conductor. Crude oil broke the dollar script because of physical supply disruption. Gold has no equivalent exception. When DXY bids, gold pays. Every 1% dollar rally tightens conditions for USD-denominated non-yielding assets. Gold faces both the currency headwind and the real yield headwind simultaneously. There is no offset mechanism here.
Basis Edge : Compression Signals Sustained Distribution
Gold’s basis is compressing below theoretical carry. That signals distribution pressure exceeds normal mechanics. If DXY holds above 98.80, backwardation risk builds. That would be rare : historically it precedes a corrective bounce. But the underlying cause of the compression is institutional selling, not physical demand stress. Watch the basis spread carefully next week.
Raw Materials Radar : Seasonal Headwind Adds to Macro
May and June are historically weak months for gold. Physical jewellery demand from India and China peaks later in the year. There is no seasonal tailwind to push back against the macro pressure. Gold is fighting uphill without the usual physical demand support underneath it. This is not an isolated bad week : it fits the seasonal pattern.
Key Levels
| Level | Price | Significance |
|---|---|---|
| Hard Resistance | $4,600 | Short entry zone top. Any rally here is the opportunity. |
| Short Entry Zone | $4,560-$4,600 | Only valid entry. Wait for the bounce. Never short into support. |
| Friday Close | $4,556 | Just below the entry zone. Watch for Monday bounce to set up the trade. |
| Options Max Pain | ~$4,480 | Speed bump not floor. GEX amplifies any break below here. |
| Extension Target | $4,440 | Secondary target on acceleration. Scenario C territory. |
| DXY Invalidation | 98.80 | Dollar closes below this : close all gold positions, no debate. |
Bias: Bearish. $4,480 is a speed bump. The structure below it gets worse, not better.
Signal + Bias
Condition: DXY must remain above 98.80. If it closes below there, every confirming layer reverses simultaneously. Exit without hesitation.
Nine layers confirm this trade. COT pre-built. Dark pool absent. $34.1M directional puts. Negative GEX. Max pain gap 2% below. Rising real yields. Dollar bid. Seasonal headwind. Basis compressing.
One condition overrides all nine. DXY 98.80. If that breaks, you close. No argument.
Entry at resistance only. Shorting into support in elevated vol is how you get stopped out and then proved right. Wait for $4,560-$4,600.
Next Week Setup
Wednesday 21 May is the decision day. Two critical events land within four hours of each other.
10:30 ET : EIA crude supply data. Primarily a crude event. But risk appetite reads through to metals. If crude supply is confirmed tight, the broader supply-disruption narrative gets another layer. Gold unaffected directly but the macro tone matters.
14:00 ET : FOMC minutes. This is the primary resolution event. Hawkish minutes extend the DXY bid and push gold toward $4,480 and further. A dovish surprise reverses DXY below 98.80 and your short is invalidated in real time. Do not enter new positions in the 90 minutes before this release.
Fed speakers run Monday through Friday. Track the language around the 4.50% threshold. That level forced the April 2025 tariff pause. If yields break higher toward 4.65%, gold faces accelerating pressure. That same level has institutional muscle memory attached to it.
Friday afternoon brings the next COT data release. If gold distribution extends beyond -14,600 in the new data, the short thesis has a second wind confirmed by institutional positioning.
Three Scenarios for Gold Next Week
DXY holds below 99.80. Gold stabilises near $4,480. Distribution pauses but does not reverse. Short thesis intact above 98.80. Range entries valid at resistance.
Gold oscillates $4,480-$4,560. Options structure limits rallies. Short entries at resistance valid throughout the week. No directional clarity until Wednesday FOMC.
10Y breaks 4.65%. FOMC hawkish. DXY toward 100.20. Gold breaks $4,480. Negative GEX amplifies toward $4,440 and below. Scenario C is the best outcome if you are already short at resistance.
Risk Score
Why around 60%: Nine confirming layers are clear. The structural setup is bearish across positioning, options, basis, and macro. But the single invalidation point : DXY below 98.80 : reverses all nine simultaneously. One Fed comment can flip the trade. VIX at 18.43 adds wider intraday ranges on top. That concentration of risk around one external variable is what pushes the score to 60.
Non-Negotiable Rules
- Entry at resistance only. $4,560-$4,600. Never into support.
- Stop at $4,620. No exceptions.
- DXY closes below 98.80 : close immediately, every position.
- Size down 30-40% from normal. VIX 18.43 means wider swings than your usual stops assume.
- No new entries 12:00-13:45 ET Wednesday. FOMC binary risk.
Alpha Insights : Friday 16 May 2026. For informational purposes only. Not financial advice. All trading involves risk of loss.
Saturday 16 May 2026
Gold (XAU/USD) — Daily Read | Friday 15 May 2026
Friday close | Gold $4,544 (-2.88%) | Inflation-exit sell-off on Retail Sales disappointment | Not financial advice
WHAT CHANGED FROM YESTERDAY
Yesterday gold was running a long that the CPI print had extended. The read was a sustained bull bias — soft inflation confirms the macro environment for gold ownership as a portfolio hedge. Today gold closed at $4,544, down 2.88%. This is a meaningful single-session reversal. The Overwatch’s silver inflation-exit signal is the explanation: when inflation fear exits quickly after a data point, gold and silver reprice lower together. CPI confirmed lower inflation yesterday. Lower inflation removes the urgency of inflation hedging. That is why gold is down on the back of good inflation news. The paradox is real, and the read called it.
HEADLINE STATE: INFLATION-EXIT SELL — Gold -2.88%, Soft CPI Removed Inflation Hedge Premium
Gold’s -2.88% is the largest single-day loss in the portfolio on Friday. But context matters: gold has been running a significant rally on inflation fear and institutional diversification. A 2.88% pullback from what has been a sustained bull run is not a breakdown. It is a positioning flush after an event resolved. The $4,544 close is still elevated on a multi-week view. The question is whether this is a one-day correction or the start of a deeper reversal. The dollar extending to DXY 99.27 is the secondary pressure — gold and the dollar move inversely.
| Metric | Thu 14 May | Fri 15 May | Move |
|---|---|---|---|
| Gold spot | ~$4,680-4,700 (running long) | $4,544 (-2.88%) | -$136-156 |
| Silver (companion) | $85.45 (already breaking down) | $76.30 (-10.15%) | Silver led the collapse |
| DXY | 98.79 | 99.27 (+0.39%) | Inverse pressure on gold |
| Gold reason | Inflation hedge + soft CPI | Inflation-exit flush | Paradox resolved lower |
KEY LEVELS INTO NEXT WEEK
- $4,544 — Friday close. First reference for Monday. Does Asia bid the dip or extend the flush?
- $4,500 — round number and psychological support. A Monday hold above $4,500 is the first sign the sell-off is contained.
- $4,600 — the level gold needs to reclaim to signal the bull thesis is intact. Resistance next week.
- $4,450 — deeper structural support. Only in play if dollar extends above 100 and risk-off persists into next week.
OVERWATCH CONTEXT
The Overwatch named the silver inflation-exit signal as one of the week’s key reads. Silver -10.15% is an extreme single-day move — that kind of sell-off happens when leveraged inflation positions unwind rapidly. Gold at -2.88% is the more orderly companion. The relationship between the two is telling: silver moved much harder, which says the inflation-hedge premium in silver was more extended than in gold. Gold’s -2.88% is a correction. Silver’s -10.15% is a flush. The structural bid in gold from central bank diversification and geopolitical uncertainty has not disappeared. The inflation-hedge premium has partially exited. Those are different things.
WHAT TO WATCH NEXT WEEK
- $4,500 hold on Monday open — this is the first test of whether the sell-off is a flush or the start of a trend reversal.
- DXY direction — if the dollar softens next week, gold gets immediate support from the inverse relationship.
- Silver stabilisation — if silver recovers from -10.15%, it pulls gold back up with it. If silver extends lower, gold follows.
- Central bank demand data — any large buyer announcement supports the structural floor regardless of inflation narrative.
Friday 15 May 2026 | Not financial advice. For informational purposes only.
Friday 15 May 2026
Gold (XAUUSD) — Daily Read | Friday 15 May 2026
Post-CPI close | $4,654 — coil broke lower, long thesis tested, dip within the trend | Not financial advice
WHAT CHANGED FROM YESTERDAY
Yesterday the read described gold coiling at $4,710 — 78% long read but with a 32% short signal present. The analysis said compression precedes a move and asked which direction. The close answered: down. Gold finished Thursday at $4,654 (-0.92%). The dollar bid from CPI short-covering pushed gold lower in a classic mechanics move: dollar up, gold down. The 78% long thesis is now being tested at the lower level. What matters is whether $4,654 is a dip within the confirmed rate-cut bull thesis, or the beginning of a more meaningful correction. The Overwatch did not flag gold as a concern — the silver story was the focus. Gold’s small decline (-0.92%) versus silver’s rout (-5.72%) is the signal that gold’s structural buyers are still present. They are absorbing the dollar bid rather than panicking out.
HEADLINE STATE: DIP WITHIN THE TREND — Long Thesis Intact, Dollar Headwind Temporary
Gold at $4,654 after a CPI-driven dollar bid is not a broken thesis. It is the exact scenario the coil analysis was warning about: a potential near-term breakdown before the longer structural bid reasserts. The rate-cut path confirmed by Thursday’s CPI is gold-positive in the medium term: lower real yields (nominal rates cut but inflation confirmed soft) reduce the opportunity cost of holding gold. That dynamic plays out over weeks, not days. The dollar short-covering headwind is the short-term noise. The rate-cut path is the medium-term signal. Gold is currently in the transition between the two.
Key Levels
| Level | Price | Significance |
|---|---|---|
| Thursday close | $4,654 | -0.92% — coil broke lower, dollar bid absorbed by structural buyers |
| Prior coil level | $4,710 | Wednesday close — now overhead resistance |
| Dollar squaring target | $4,680–$4,720 | Weak RS or dollar fade — gold recovers toward prior coil centre |
| Strong RS downside | $4,600–$4,625 | Dollar extends — gold tests next support level |
| Structural long bias | 78% | Rate-cut path confirmed = lower real yields = gold-positive medium-term |
| vs Silver | Gold -0.92% vs Silver -5.72% | Gold held 6x better — strategic buyers present, speculators exited silver |
Structure · Momentum · Flow
Structure
Long-term rising structure intact. The $4,654 level is a pullback within the trend, not a structural break. The comparison with silver’s 5.72% decline confirms gold’s structural buyers are doing their job.
Momentum
Short-term negative. The coil broke lower. Near-term momentum is with the sellers. But gold has not shown the explosive selling that silver showed — the decline is measured, not panicked. Measured declines recover more easily.
Flow
Two competing flows. Dollar short-covering is selling gold. Strategic central bank and institutional buyers (the reason gold is at $4,654, not $3,500) are absorbing. Medium-term flow returns to gold when the rate-cut path is fully priced into real yields.
| Bias | LONG MEDIUM-TERM — near-term dip, dollar-gated |
| Risk estimate | Around 35% — dollar mechanics vs rate-cut thesis in balance today |
| Key distinction | Gold -0.92% vs Silver -5.72% — gold is the quality hold; silver is the speculation exit |
| Entry watch | $4,600–$4,625 on dollar extension = higher conviction re-entry level |
| Week carry | Bullish medium-term — rate-cut = lower real yields = gold bid returns |
This content is for educational and informational purposes only and does not constitute financial advice. Past analysis does not guarantee future results. Always conduct your own research before making any trading decisions.
Thursday 14 May 2026
Gold (XAUUSD) — Daily Read | Thursday 14 May 2026
Post-CPI mid-session | Sold on dollar bid, coil breaks lower near-term | Not financial advice
WHAT CHANGED FROM YESTERDAY
Yesterday gold was described as COILING — 78% long read but with a meaningful 32% short signal still present. The analysis said “compression precedes a move” and asked which direction. The coil has broken — but to the downside. Gold is at $4,686 (-0.24%). The CPI catalyst that pushed equities higher and bid the dollar also sold gold. The 78% long structural read is now being tested. The coil resolved bearishly on the CPI day, even as the long thesis was the higher-probability read.
HEADLINE STATE: SOLD ON DOLLAR BID — Coil Broke Lower, Long Thesis Tested
Gold selling on a good CPI print is the expected trade: lower inflation = less need for inflation hedges = sell gold. The dollar bid makes gold more expensive in non-dollar terms, adding pressure. The move is not dramatic (-0.24%) which tells you the long-term structural buyers are still present — they are not panicking. A 0.24% drop when the dollar is up 0.31% and equities are up 0.80% is gold holding its ground reasonably well. The bigger concern is whether the coil breakdown leads to further selling or whether the 78% long thesis reasserts from a better level.
Key Levels
| Level | Price | Significance |
|---|---|---|
| Current price | $4,686 | -0.24% — sold on dollar bid post-CPI |
| Prior close | $4,710 | Wednesday close — coil was centred here |
| Coil break direction | Lower | CPI resolved the compression bearishly near-term |
| Macro long bias | 78% | Still intact — this is a dip within the long thesis |
| Silver comparison | -3.87% | Gold vastly outperforming silver — defensive bid still present |
| DXY headwind | 98.79 (+0.31%) | Dollar up = gold denominated at higher cost for buyers |
Structure · Momentum · Flow
Structure
The coil from yesterday resolved lower. Structure is now testing the 78% long thesis. A modest -0.24% is not a structural breakdown — it is a pullback. The structural long thesis for gold requires holding above key support. Watch where the daily candle closes.
Momentum
Short-term momentum flipped bearish on the CPI print. Inflation fear = gold demand. Lower inflation = reduced urgency for gold. The momentum selling is logical and temporary unless dollar strength becomes sustained and meaningful.
Flow
Gold is outperforming silver dramatically today. Silver down 3.87%, gold down 0.24%. That relative strength in gold vs silver tells you the safe-haven buyers are still supporting gold — they are not selling the inflation hedge, just reducing the speculative premium. Flow is supportive at the structural level.
TODAY’S BIAS: LONG THESIS DEFERRED — Wait for Dollar to Peak
The 78% long thesis for gold has not been destroyed — it has been deferred by the dollar bid. Gold at $4,686 from $4,710 is a small pullback on a significant event day. The long thesis reactivates when the dollar bid fades. Watch DXY 98.5 as the key level — if DXY fades back below it, that is the gold re-entry signal. If DXY holds above 98.5, gold faces continued pressure.
Risk: Around 40%
Gold’s modest decline vs silver’s 3.87% collapse shows gold is not in a selling panic — it is in an orderly pullback. Risk is moderate. The danger is if the dollar strengthens further and gold closes below key structural support. That would shift the read from “pullback in an uptrend” to “something more significant.”
By Experience Level
New to this
Gold going down when inflation drops seems backwards at first. But gold is priced as an inflation hedge and a safe haven. Lower inflation reduces the need for the inflation hedge. The safe-haven buyers remain — which is why gold is only down 0.24% while silver (a more speculative metals trade) is down 3.87%.
Developing
The gold/silver ratio is widening today. Gold holding while silver sells is a de-risking pattern — speculators leaving the metals complex via silver while strategic buyers hold gold. When this ratio compresses again (gold and silver both rising), it signals speculative interest returning to metals. That is usually a stronger environment for both.
Experienced
$4,686 is the level to watch on the close. A close above $4,700 with the dollar holding higher suggests gold’s structural buyers are absorbing the CPI selling. A close below $4,680 with further DXY strength suggests the pullback has more to go. The 78% long thesis only gets challenged meaningfully below $4,600 — there is a lot of cushion for the structural long view even on today’s dip.
This is a daily analysis read for educational and informational purposes only. Nothing here is financial advice. Past performance is not a guide to future results. Trading carries significant risk of loss. Always apply your own risk management.
Wednesday 13 May 2026
Gold (XAUUSD) — Daily Framework Read | Wednesday 13 May 2026
analysis as of pre-market | CPI 3.8% shock context | Not financial advice
HEADLINE STATE: COILING — Wait for the Break
Gold is in compression. The long side holds a 78% read, but the short side is still registering 32% — that split tells you the market has not made up its mind yet. Price closed at $4,710 with a 0.69% gain, recovering from the CPI open. The key insight: compression precedes a move. The framework is not asking you to sit on your hands indefinitely — it is asking you to wait for price to show its hand before committing capital. A breakout from this coil will carry momentum.
Key Levels
| Level | Price | Significance |
|---|---|---|
| Current close | $4,710 | Inside compression zone |
| Session high | $4,735 | Break above = long trigger |
| Session low | $4,696 | Break below = short confirmation |
| Prior close | $4,678 | Support reference if price pulls back |
| Coil range top | $4,735+ | Breakout zone — long momentum target |
| Coil range base | $4,696 | Floor — breakdown opens larger downside |
Structure · Momentum · Flow
Structure
Coiling tightly. The range from session low to high is only $39 — that is narrow for gold. Compression structures like this typically resolve with a fast, directional move. The longer the coil, the sharper the exit.
Momentum
Long bias at 78% is meaningful — the majority lean is upward. But the 32% short signal is too significant to ignore. Momentum has not committed. CPI 3.8% is goldpositive medium-term (inflation hedge), but equity resilience reduces the safe-haven urgency short-term.
Long Case vs Short Case
LONG CASE (if break above $4,735)
- 78% long read — majority lean is upward
- CPI 3.8% keeps inflation hedge narrative alive
- Silver and copper leading — gold to follow
- Breakout from compression = momentum continuation
- DXY weakness supports metals broadly
SHORT CASE (if break below $4,696)
- 32% short signal — not a clean long-only read
- Equity markets resilient reduces safe-haven demand
- Risk-on regime is gold-neutral to negative
- Break below $4,696 opens a swift move lower
- No framework support for pre-break entries either way
Sizing Guidance
Do not trade the compression. Wait for confirmation above $4,735 or below $4,696. The framework is explicitly in a watch state. Pre-emptive entries in a coiling structure are the fastest way to get stopped out repeatedly. When the break comes, it will be decisive — size normally on confirmation, not in anticipation.
Gold is a patience trade today. The setup becomes actionable at the breakout level, not before.
Tuesday 12 May 2026
Daily Framework Read · Tuesday 12 May 2026
Gold (XAUUSD) — Daily Framework Read | Tuesday 12 May 2026
Published pre-market · Time-gated member content
Current State
CONTESTED — 50% Confidence
Bias split: 55% long / 57% short — both sides pressing. Cloud coiling bullish but sellers are active at current levels.
Key Levels
| Level | Price | Notes |
|---|---|---|
| Entry | 4,718 | Conditional — only on level agreement |
| Stop Loss | 4,676 | Below cloud base |
| Target 1 | 4,803 | Next resistance cluster |
| Risk:Reward | 2R | Only valid with clear level confirmation |
Structure Read
Gold’s structural cloud is coiling with a bullish tilt, suggesting that the underlying bias leans toward higher prices over time. However, price is currently caught between two competing structural levels with no clean resolution — neither side has forced the other’s hand. This coiling behaviour tends to precede a sharp move, but the direction needs to confirm before committing capital.
Momentum Read
The short-term momentum picture is mixed at best. Sellers have been pressing price at the current zone and there is no clean read in either direction — both camps are applying pressure and neither has broken the stalemate. In this environment, momentum is not a reliable guide, which is exactly why patience is the edge.
Volume & Flow Read
Active selling is visible at the current price zone — sellers are not passive. The flow picture matches the structural ambiguity: no dominant side is establishing clear control. Until the flow resolves in favour of one direction, the cleanest trade is no trade.
The Verdict
Gold is the most contested instrument on the board today. The longer-term structural cloud is bullish, which gives the long case a marginal edge — but 50% confidence is not a reason to put on a trade. Conditions here favour waiting; the opportunity becomes clearer when both sides of the framework reach the same conclusion. Watch for sellers to exhaust at the current zone and momentum to flip before committing. The levels exist, but the trigger hasn’t arrived yet.
Long Case vs Short Case
55%
Cloud coiling bullish. Macro structure leans long over time.
57%
Active sellers pressing current zone. Near-term flow tilts short.
Position Sizing Guidance
At 50% confidence, no trade is the position. If you already hold a gold position from a prior entry at better levels, review your stop and consider whether current conditions justify holding or locking in partial profit. For new entries, wait for either the sellers to exhaust and price to reclaim the 4,718 zone cleanly, or for a decisive break lower that invalidates the bullish cloud thesis entirely before positioning short.
This content is for educational and informational purposes only. Nothing here constitutes financial advice or a recommendation to buy or sell any instrument. Trading involves substantial risk of loss. Past performance is not indicative of future results. Always conduct your own due diligence and manage risk appropriately.
Tuesday 5 May 2026
Gold (XAU/USD) — Daily Framework Read | Tuesday 5 May 2026
Gold (XAU/USD) | Tuesday Open Daily Read | Data basis: Monday 4 May 2026 close
Where It Sits
Structure
Structurally the higher-timeframe uptrend is still intact, but Monday’s session has redrawn the short-term map. The 4,560 support that was framed as a defined buy zone last week has been broken on the gap lower, and 4,527 is the new pivot the tape is settling around. The 4-hour frame shows compression rather than capitulation — buyers stepped in below 4,525 in the Asia hand-over and the overnight has held a tight 12-dollar band. The structural decision points become 4,490 below (the multi-week range floor that has been respected for weeks) and 4,580 above (the prior support, now first resistance).
Momentum
Daily momentum has rolled into the lower third of its range after the Monday gap, but 4-hour readings are already building back from oversold as the overnight bid has held. This is the signature of a hedge-flow re-entry rather than a trend reversal — momentum exhaustion in one direction meeting fresh buyers in the other. The momentum profile favours stabilisation and probe of the 4,580 zone before the next directional decision is forced.
Volume and Flow
Asia volumes were modest but the overnight tape has shown price respect at the lows — every probe under 4,525 has been bought, none have extended. Futures positioning data into Friday’s COT showed non-commercial longs trimmed but still elevated, so the Monday move was likely closer to broad portfolio rebalancing than dedicated metals selling. The pattern reads as repositioning into the new range, not distribution out of the asset class.
Key Levels
| Level | Type | Significance | Action Zone |
|---|---|---|---|
| 4,660 | Resistance | Prior pivot, supply cluster from last week | Take profits if reached |
| 4,580 | Resistance | Old support flipped, first reclaim target | Reclaim = bias resets bullish |
| 4,527 | Reference | Tuesday Asia anchor, overnight pivot | Bias line |
| 4,490 | Major support | Multi-week range floor | Defined buy zone with stop below |
| 4,440 | Major risk | Below the multi-week floor, structural break | Stop-out below for longs |
Three Scenarios Into Tuesday Open
Reclaim and Run
Gold holds 4,525 through Asia, presses 4,540 into London, reclaims 4,580 cleanly during NY as the safe-haven bid extends. Run targets 4,620 then 4,660. The continuation read is the higher-timeframe trend simply absorbing Monday’s gap.
Range Digestion
Gold churns 4,510 to 4,560 through the day. Magnet near 4,527 with shallow probes either side. The tape waits for Wednesday data and Thursday FOMC tone before committing — Tuesday becomes a positioning day rather than a directional day.
Continuation Lower
Gold loses 4,510 on a fresh USD bid or a clean equity bounce that retires the safe-haven trade. Runs to test 4,490 multi-week floor. A close below opens 4,440 and forces the structural bias question.
Risk Score
Risk sits at Around 60% heading into Tuesday open.
Risk is moderate-elevated. Monday’s gap lower from 4,614 to 4,527 reset the short-term picture and the bid has not yet re-established 4,580 as support. The higher-timeframe uptrend is intact and the multi-week floor at 4,490 remains the defining structural level, but the proof has not been delivered yet. Position-sized longs on tested support pullbacks only. No aggressive entries until 4,580 prints back as support on a closing basis. If the tape loses 4,490 cleanly, the read changes and the bullish thesis goes on hold.
How to Walk It
Entry, stop and target structure:
- Long 4,510-4,530 reclaim | Stop 4,485 | Target 4,580 | R:R 2:1
- Long 4,495 multi-week floor test | Stop 4,470 | Target 4,560 | R:R 2.6:1
- Short 4,580 first-touch rejection | Stop 4,605 | Target 4,510 | R:R 2.8:1
Experience-level guidance:
Beginner: A Tuesday open after a risk-off Monday is exactly the moment where over-trading costs money. Reduce size to half of standard. Trade only the cleanest reclaim setup from above and walk away from the screen if the tape opens against you. Wait for the second London hour before committing — the institutional flow tips its hand by then and the noise has cleared.
Intermediate: Use the levels table to define the working range. Fade the extremes with defined stops, take profits at the round-number resistance levels rather than holding for an extended target. Do not carry directional positions through the day if you cannot watch the tape. Tuesday opens after a Monday gap are prone to whipsaws as the order book refills.
Advanced: The vol regime has firmed back up, which favours defined-risk options structures around 4,490 and 4,580 over directional spot exposure. Calendar-roll the implied vol expansion if it persists. Keep notional small relative to your book. Tuesday after a Monday risk-off is asymmetric speculation, not core positioning, and the asymmetry only pays if the structure is sized correctly.
Continue Reading
The macro frame driving this read is unpacked in the sequenced briefs:
Pre-Asia Tuesday Open — VIX Firms Back Above 18, Equities Give Back Monday Gains
Sunday Setup — Reading The Tape Into Monday Open
This analysis is for educational and informational purposes only. It does not constitute financial advice. Always manage your risk independently and in accordance with your own financial circumstances.
Continue with Titan Protect
Twenty-plus instruments. One framework.
We read more than twenty instruments daily across four sessions. The framework’s sunrise call landed across the day — the Pre-NY case study shows what the lines drew, what New York did, and where the read stands.
Core
£59/mo
Indicator suite plus daily framework reads.
Edge Popular
£109/mo
Core plus Shield dashboard and member-only briefs.
Elite
£179/mo
Edge plus weekly 1:1 call and early access to new tools.
Save 15% on annual billing
Want to see the framework in action? Free Explorer tier — no card required.
Join the live community: Discord channel · Shield dashboard
Education, not financial advice. Trade your own analysis.
Sunday 3 May 2026
Gold (XAU/USD) — Daily Framework Read | Sunday 3 May 2026
Gold (XAU/USD) | Monday Open Framework Read | Data basis: Friday 1 May 2026 close
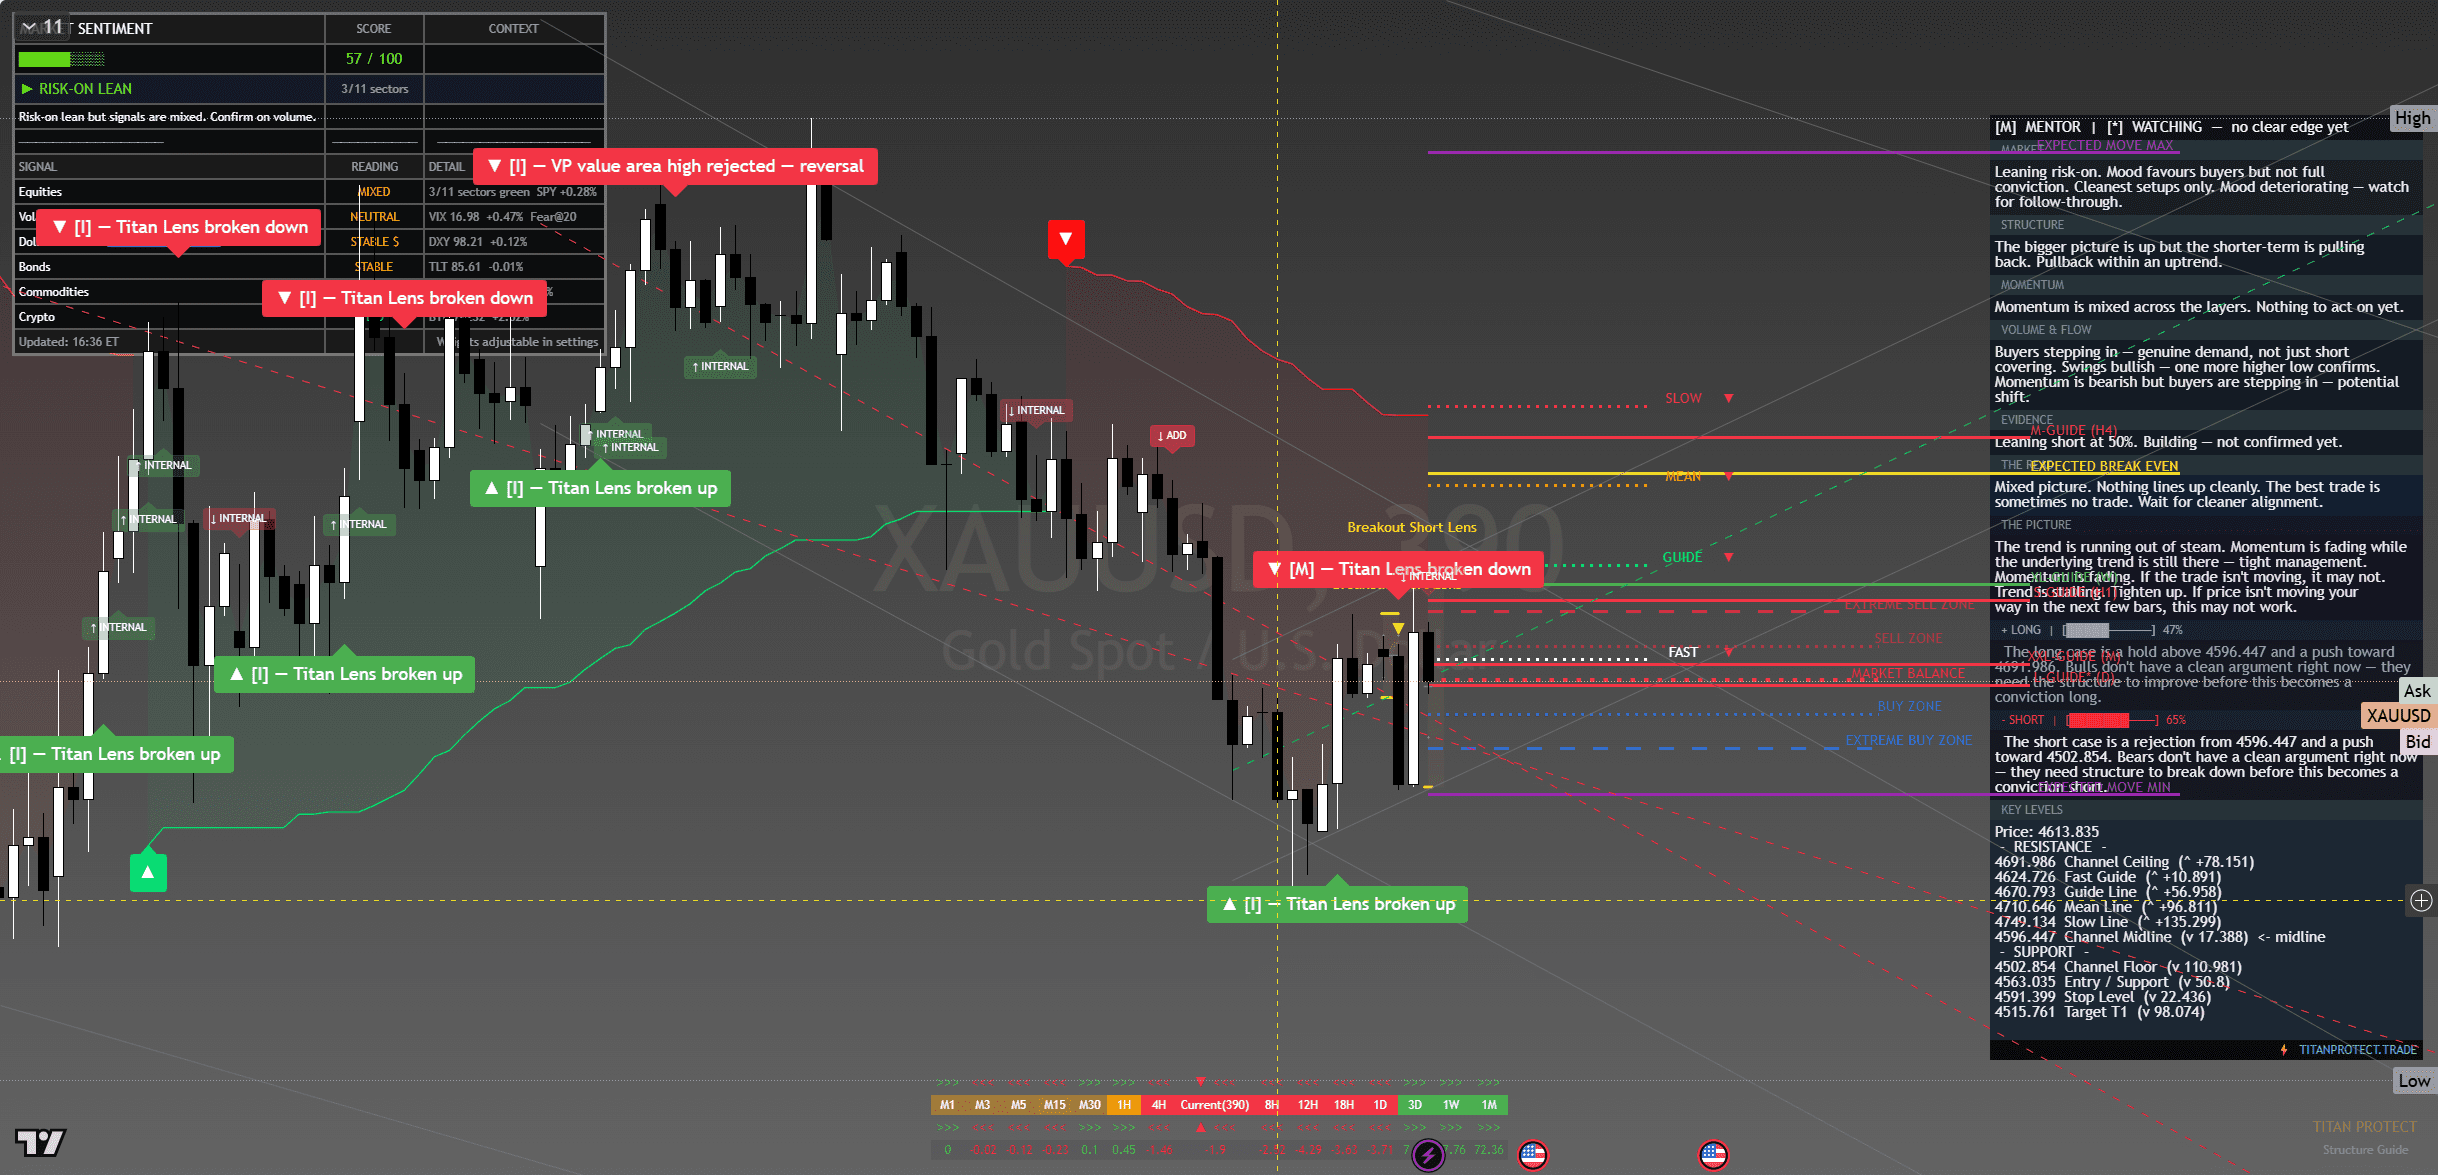
Gold (XAU/USD) — chart with framework overlay. The Lens annotations show structural breaks, reversal triggers and confluence zones at the levels referenced below.
1. Where It Sits — The Composite Read
The framework’s read on gold heading into Monday is the cleanest example of “leaning risk-on but only the cleanest setups.” Higher timeframes still print the structural uptrend that has carried gold from below 4,400 to current levels. Daily trend remains intact. But the past three sessions have rolled the slope from accelerating to flattening — Friday’s 0.34 percent decline on a day when every other major asset class advanced is not the action of a market in continuation mode.
The Mentor frame coming into Monday is direct: mood favours buyers but not with full conviction. Structure is meeting against the trade. Momentum is mixed across the buyers — nothing to act on yet, until either the 4,660 pivot reclaims cleanly or the 4,560 support tests with a defended bounce.
2. Structure
Structurally the picture has TWO timeframes telling different stories — and Monday’s trade is in the gap between them.
Higher timeframe (daily/weekly): Gold remains in a clear multi-week uptrend. Higher highs and higher lows since the early-April low at 4,400. The 20-day moving average is rising and price has not threatened it for three weeks. The structural case for gold-as-inflation-hedge has not broken — it has just paused.
Lower timeframe (4-hour/intraday): The past three sessions show compression and rejection at the upper bound. Friday’s session printed a clean rejection candle at the 4,660 level — what was previously the structural floor for the prior week’s range now acts as overhead resistance. The 4-hour timeframe is in a corrective leg within the larger uptrend.
This is the textbook pullback-within-an-uptrend setup. The risk is that what looks like a healthy correction extends into a structural break if the 4,560 support fails. The opportunity is that the structural uptrend on the higher timeframe creates an asymmetric entry on tested support — a long here that holds 4,560 has 4,720 as a natural target with defined risk to 4,545.
3. Momentum
Momentum has cooled from accelerating to neutral. Internal momentum readings sat in the upper third of their range two weeks ago — the kind of conviction that drove the original push above 4,500. They sit in the middle of the range now. Not yet exhaustion, not yet reversal, but clearly digesting. The momentum profile favours range trading over continuation in the immediate term.
The cross-asset momentum read adds nuance: silver outperformed gold by a wide margin this week (+1.55% vs -1.34% — a 290 basis-point spread). When silver leads gold to the upside, the precious-metals trade is industrial-demand-driven rather than safety-bid-driven. That is a different macro story than gold-as-inflation-hedge — and it explains why gold gave back ground on a week where the dollar weakened (DXY -1.13%). Normally a weak dollar is gold-positive. The fact that gold sold off anyway tells you the inflation-hedge premium that drove the prior leg is being unwound post-PCE.
4. Volume & Flow
The flow data through the week showed a clear pivot. Mon-Wed: sustained ETF inflows and non-commercial long buildup confirming the structural bid. Thu-Fri: the inflow stopped, then reversed mildly. The non-commercial long positioning is still elevated relative to the 90-day average but the marginal buyer has stepped back. That is consistent with the post-PCE rotation OUT of safety-hedge demand and INTO risk-on equity exposure (where SPX printed records and the Mag 7 absorbed flows).
The flow pattern is one of digestion rather than distribution — there is no evidence yet of structural selling. But the pivot from accumulation to neutral is the kind of behaviour that precedes range-bound consolidation rather than continuation higher.
5. Key Levels
| Level | Type | Significance | Action Zone |
|---|---|---|---|
| 4,720 | Resistance | Recent swing high cluster, supply zone from prior week’s range | Take profits / fade if rejected |
| 4,660 | Pivot | Friday’s rejection level — was prior support, now overhead resistance | Reclaim above = bullish bias resumes |
| 4,614 | Friday close | Reference anchor for Monday open | Bias line — above = constructive, below = continued pullback |
| 4,560 | Support | The structural decision point — defended bounce here keeps the setup alive | Buy zone with defined stop on tested hold |
| 4,490 | Major support | Multi-week range floor that has held the entire post-April-9 recovery | Stop-out below for longs — break invalidates the structural read |
6. Three Scenarios Into Monday Open
Continuation
Gold opens firm in Asia, holds 4,614, takes 4,660 cleanly during London session as inflation-hedge bid resumes. Runs to 4,720 zone by NY. The sweep-bullish setup confirms with one defended higher low above 4,580. Recovery of the late-week pullback. Trade with the trend.
Range
Gold opens flat, churns 4,580-4,680 through the session. Magnet near Friday close. Range trade as the inflation-hedge premium digests post-PCE. Most probable scenario given the ISM Services Tuesday catalyst — markets wait for fresh data before committing.
Mean Reversion
Gold opens weak on continued USD strength or risk-on flush of safe-haven demand, breaks 4,560 support, runs to 4,490. Continuation of the late-week give-back. Watch for capitulation candle at 4,500 — that becomes the long entry rather than the stop.
7. Risk Score
Risk sits at Around 55% heading into Monday open.
Three factors drive this elevated reading. First, the cross-asset rotation OUT of safety into risk has been the week’s largest theme — gold is on the wrong side of that rotation in the near term. Second, the three-session pullback signals momentum has shifted from accelerating to neutral, which historically extends rather than reverses immediately. Third, the structural support at 4,560 has not been tested yet — until it holds with conviction, the long thesis is unproven on the lower timeframe.
The 45 percent relief from maximum risk reflects the higher-timeframe uptrend remaining intact, the multi-week structural floor at 4,490 having held since early April, and the geopolitical hedge bid persisting in the background. Standard size on tested-support pullbacks. No aggressive entries until either 4,660 reclaims or 4,560 holds with a defended bounce.
8. How To Walk It
Entry / Stop / Target structure:
- Long 4,580-4,610 pullback | Stop 4,545 | Target 4,680 | R:R 2.5:1
- Long 4,665 breakout reclaim | Stop 4,620 | Target 4,720 | R:R 1.2:1
- Short 4,730+ rejection | Stop 4,755 | Target 4,640 | R:R 3:1
- Long 4,490-4,510 capitulation bounce | Stop 4,470 | Target 4,580 | R:R 4:1 (asymmetric — only if support holds with volume)
Experience-level guidance:
Beginner. Gold this week is a textbook example of why “trend is your friend” needs nuance. The trend on the daily is up. The trend on the 4-hour is down. Trading the daily on a 4-hour signal is what blows accounts. If you trade gold this week, use the daily for direction (long bias) and the 4-hour for entry timing (wait for the 4,560 hold or the 4,660 reclaim). Skip the random middle of the range. Trade the edges.
Intermediate. The asymmetric setup is the long at 4,580-4,610 with stop 4,545 and target 4,680. R:R 2.5:1 with confluence between the daily uptrend and the 4-hour pullback. Take half off at 4,640 and trail the rest to 4,680. Do not chase if 4,660 breaks before you have the entry — once that level reclaims, the asymmetry of the next leg is much tighter.
Advanced. The vol structure on gold options has compressed alongside the spot pullback. Defined-risk option structures around the 4,560 / 4,720 levels capture the range-trading scenario cleanly. Sized to 0.5% of book per leg. The week’s most asymmetric trade is the gold-vs-silver pair: silver outperformed gold by 290bps this week — long gold / short silver as a mean-reversion play if the precious-metals complex re-aligns.
9. The One Sentence
The Sunday Composite — How This Read Sits Inside The Cross-Asset View
This single-instrument framework read is one slice of the larger Sunday weekend synthesis. The composite takes positioning, macro, sentiment, volatility, sector dispersion and trade structure as separate analytical layers and arrives at a unified composite verdict for Monday open. Each layer is unpacked in full.
Read the full composite for the cross-asset context driving this instrument:
The institutional positioning split — Asset Managers vs Leveraged Funds in size
PCE clearance and the macro case for Monday’s carry
The three-layer sentiment disagreement
The vol curve term structure and what VVIX is signalling
Sector dispersion and the breadth problem behind the record close
The Monday position-management playbook — sizing tiers and trade plans
Sunday Overwatch — the unified composite verdict
This analysis is for educational and informational purposes only. It does not constitute financial advice. Always manage your risk independently and in accordance with your own financial circumstances.



