
The Gold Framework Journal for April 2026, newest read at the top. Each dated entry is our read on the close, kept as a living record so the framework can be judged over time. This is analysis, not financial advice.
Thursday 30 Apr 2026
Gold Flushed 4,615, Reloaded 4,536, Then Ripped 4,650 Inside One Session — PCE Friday Decides Whether the Floor Holds
Gold (XAU/USD) | Daily Framework Read | Thursday 30 April 2026
Gold’s week tells a specific story if you read the sequence correctly. Wednesday’s Powell press broke the 4,615 structural floor on a hawkish-symmetric Fed reset and dollar repricing, closing at 4,536. Asia re-opened flat, printed 4,566, then faded. By London open Thursday, the floor had absorbed a round of fresh buying and gold began climbing. By mid-session it was at 4,650 — a 114-dollar, 2.5 percent recovery from the Wednesday low, fuelled by dollar fatigue at the DXY 99 ceiling, active central bank buying, and two-directional hedging into AAPL tonight plus PCE tomorrow. The structural damage from Wednesday’s floor break has been repaired on price, but not yet confirmed. One clean close above 4,650 on the daily chart changes the character of the move entirely. Without it, the risk of a second test of the 4,536 low is live through Friday’s PCE window.
Thursday thesis. The floor break was absorbed in 18 hours. The question is whether the recovery has conviction or is a pre-event hedge that gets unwound after PCE. Central bank buying and DXY fatigue at 99 are structural supports. A cool PCE print tomorrow sends gold toward 4,740 and repairs the weekly chart structure. A hot PCE print reopens 4,490 and the 4,450 level below. The risk is asymmetric: the bull continuation is cleaner technically, but the event calendar tonight and tomorrow means the trade size must reflect both paths.
Where It Sits Today
Current Price
4,650.20
+2.31% on session
Session Range
4,550.80 – 4,658.80
108-dollar intraday swing
Prior Close
4,545.20
Wed cash: 4,536.21
Key Catalyst
PCE Friday
13:30 BST tomorrow
The five-day picture is instructive. Gold opened the week near 4,615, the structural floor that the Raw Materials Radar had been flagging since Monday. Tuesday held, Wednesday broke it on the Powell press and dollar repricing, and Thursday snapped back. The Asia session Thursday opened at 4,560 and spent the morning building rather than probing lower, which is the first sign that sellers are not in control of this price. The 2.31 percent session gain is the largest single-day percentage recovery in the current bull run and puts gold within 35 dollars of the all-time intraday high printed two weeks ago at 4,685.
The context that matters: gold closed Wednesday at 4,536 while the US Dollar Index (DXY) sat at 99.04. Thursday DXY traded 98.45 to 99.09 before settling near 98.50. Dollar fatigue at the psychological 99 ceiling is doing some of the work. The rest is being done by central banks — a buyer class that does not care about the day-to-day print and which has been accumulating on every dip of 50 dollars or more for the better part of eight months. AAPL’s print tonight adds event-risk hedging premium to the mix: when the single largest market-cap name in the world prints after the bell and there is genuine uncertainty about the guidance tone, institutions add gold as a clean hedge rather than options on a single name.
What the Framework Reads
The structural read on gold is bullish on the macro timeframe, with a specific condition. The trend centre has been pulling price toward the channel ceiling consistently since October 2025 and the current pullback from the 4,685 intraday all-time high did not break below the quarterly structural support zone, which sits between 4,450 and 4,498. Wednesday’s close at 4,536 was inside this zone temporarily, but the speed of the recovery says the zone held. That is the most important piece of structural information from the session.
On the shorter timeframe, the framework reads the Thursday recovery as a legitimate reload. The move from 4,550 to 4,650 has the character of institutional accumulation rather than retail FOMO: it is steady, it absorbed the 4,600 level rather than stalling on it, and the volume pattern on the data (51,477 contracts versus a normal 25–30K session) confirms that real money moved through that level. The gold-silver ratio moved from 63.5 (Wednesday) toward approximately 62.7 intraday Thursday, which says silver is outperforming on the recovery — a constructive sign for the precious complex.
The macro framework link is via Powell’s Wednesday press. The Federal Reserve chair explicitly flagged that higher energy prices will push up near-term inflation. As you will find in our Macro Pulse brief from Wednesday, that sentence has two consequences for gold. First, it says the Fed is aware of the energy-led inflation pass-through and is not moving to cut rates to offset it. That is a real-rate story: if nominal rates stay flat and inflation expectations tick up, real rates fall and gold wins. Second, it says the risk of a policy error is elevated — the Fed holds, energy pushes CPI higher, PCE tomorrow confirms it, and the market reassesses the growth outlook. In a policy-error scenario, gold is the first beneficiary.
Structural read: constructive
The macro framework reads gold as structurally higher. The trend centre is pulling price toward the channel ceiling, central bank demand provides a demand floor on every 50-dollar correction, and the real-rate environment created by a Fed on hold with rising energy inflation is the fundamental engine. The condition: a daily close above 4,650 tonight confirms the floor break recovery and opens 4,740 as a target. A close below 4,620 says Thursday’s move was a pre-event hedge and the floor test is not yet resolved.
Key Levels
| Level | Price | Role | What It Means |
|---|---|---|---|
| All-time intraday high | 4,685 | Resistance | Last print two weeks ago. A close above here puts the bull run on new territory with no supply overhead. |
| Channel ceiling / first target | 4,740 | Bull target 1 | The measured move target if 4,650 daily close confirms the recovery. Profit-taking zone for swing positions. |
| Recovery confirmation | 4,650 | Decision level — current price | A daily close above here repairs the weekly chart structure and confirms Thursday’s move was accumulation, not hedging. |
| Structural floor — reclaimed | 4,615 | Support | The level that broke Wednesday and was reclaimed Thursday. Must hold on any pullback or the floor is not repaired. |
| Structural floor reload 1 | 4,536 | Wednesday close / reload zone | Where the market found demand twice in 18 hours. A return here with buying volume would be a second accumulation signal. |
| Structural support cluster | 4,498 / 4,450 | Bear target zone | Quarterly structural support zone. If PCE is hot and 4,536 breaks, these are the levels that buy the structural bull case. |
Three Scenarios into PCE Friday
Bull — 40%
PCE prints cool (below 3.4% core). Gold confirms close above 4,650 tonight. AAPL guidance is neutral-to-positive. Gold rallies to 4,740 by Friday close, potentially tests 4,785 over the weekend.
Sideways — 35%
PCE in-line with expectations. AAPL neutral. Gold consolidates between 4,615 and 4,680, digesting Thursday’s move. No trend extension, no structural damage. Base-building for next leg.
Correction — 25%
PCE hot (above 3.6% core). Dollar bids DXY above 99.50. Gold’s 4,650 close fails, gives back to 4,536 Friday. Sustained hot PCE opens 4,498 and 4,450 over the following week.
Risk Score
Risk: around 55%
The macro structural case for gold is intact and the fundamental drivers are aligned. The 55% risk score reflects three specific factors. First, the PCE binary tomorrow can move gold 60–80 dollars in either direction within the first 30 minutes — that is a position-sizer, not a trend-killer. Second, speculative long positioning is near cycle highs, which means when the consensus holds the same trade, a data surprise causes an outsized move as everyone exits at once. Third, AAPL tonight introduces index vol that can temporarily lift the dollar safe-haven bid and weigh on gold, even if the macro case is constructive. Size to accommodate the binary, not to capture every dollar of the move.
How to Walk It
STANDARD SIZE — Active positions
Entry: pullback to 4,620–4,640 after confirmation close
Stop: below 4,590
Target 1: 4,740 (trim 50%)
Target 2: 4,785
R:R approx 3.2:1
REDUCED SIZE — Into PCE
Hold existing longs at half-size through PCE. Do not add before the print. The range 4,620–4,650 is the hold zone. Let PCE give you direction before adding back to full.
AVOID — Chasing the top
Do not buy gold at 4,650–4,660 with a PCE binary 18 hours away. The risk of a 60-dollar gap lower on a hot print is not compensated by the 30-dollar continuation to 4,685. Wait for the data.
For scalpers (1–5 min): The 4,615–4,650 band is the intraday range anchor. Short the test of 4,660 with a 10-dollar stop if gold has been running for more than 90 minutes without a pullback. Long the test of 4,625 on volume if the first pullback holds there. Both setups require confirmation, not anticipation.
For swing traders (1–5 days): The weekly chart is the guide. Wednesday’s 4,536 low printed inside the quarterly support zone and snapped back. That is the structure of a failed breakdown. Hold existing swing longs with a stop below 4,490. The PCE print is the only legitimate reason to take profit before 4,740.
For positional traders (weeks–months): Nothing about this week changes the macro case for gold. The trend is intact. The structural support zone held. If you are already long from below 4,400, hold it. The hawkish Fed and rising energy inflation is gold’s fundamental engine, not a headwind.
Beginners: The most important thing you can do with gold right now is nothing. If you do not have a position, do not open one into the PCE binary. Wait for Friday afternoon when the data has printed and the market has given you a directional read. A 40-dollar move after a data event is a normal day for gold — do not let the price action pressure you into a decision before the information is available.
Hedging note: If you are long equities into AAPL and hold no gold, consider a small gold allocation as a portfolio hedge. Gold’s inverse correlation to the dollar and its PCE-sensitive nature means it can offset some of the drawdown if AAPL disappoints and the dollar bids.
Continue Reading
Wednesday’s full commodity picture — Crude’s eight-percent move, the Brent-WTI spread, and the energy-precious split — is covered in our Raw Materials Radar brief Wednesday 29 April 2026.
The Powell press conference context, the symmetric hold, and the real-rate consequences for gold are in our Macro Pulse brief Wednesday 29 April 2026.
The Brent-WTI spread analysis and what it signals for the geopolitical premium is in our Basis Edge brief Wednesday 29 April 2026.
Today’s full session context, AAPL binary, and the cross-asset setup is covered in our Pre-NY Brief Thursday 30 April 2026.
This analysis is for educational purposes only and does not constitute financial advice. Markets involve risk and capital can be lost. Always manage your risk appropriately.
Sunday 26 Apr 2026
Gold Daily Ticker Read: Four-Seven-Oh-Nine, Record Territory, Three Independent Reasons To Stay Long
Daily Ticker Read | Sunday 26 April 2026
Spot gold closed Friday at $4,709.75. No overhead memory because there is no overhead. Three drivers stack underneath: the Powell handover Wednesday, the Hormuz blockade with traffic still halted, and a dollar that refuses to weaken yet cannot stop the metal printing higher. Gold rallying with DXY at 98.51 means the bid is not coming from the dollar leg. It is coming from elsewhere, and elsewhere does not stop on Wednesday.
Where The Metal Sits
Gold $4,709.75. Silver $75.69. Gold-to-silver at 62.2, the band that says capital wants protection without panic. DXY closed 98.51. Spec long in gold futures sits near a twelve-month high with commercials net short. The speculator side is crowded but the move still extends because the bid carries non-spec sponsorship.
Twenty-day, fifty-day, and two-hundred-day ranges all show price at or above the upper bound. Triple-confirmation high. No resistance memory because the metal has never been here. Every ceiling is measured by extension and round-number magnets.
Three Levels That Decide The Week
Support: $4,650. The long-bias pivot. Sits above the rising structure that has carried price since the start of the month. Holds on a daily-close basis and the long thesis is intact. Below it, the geopolitical premium starts to unwind.
Decision: $4,780. First measured-move target above the breakout. Magnet for any continuation impulse, place where spec-long crowding becomes uncomfortable enough to trim. Through it on a clean daily close and the next leg opens.
Extension: $4,850. Upper band of the structural extension. No historical resistance here. Line where institutional profit-taking starts to be visible. A close above $4,850 puts $5,000 in play within the same swing window.
Long Bias Setup
High-Conviction Long: Continue The Breakout Above $4,650
Risk score: around 55 percent
Entry: $4,690 to $4,710 on pullback or fresh-high continuation. Stop: $4,610 (close below $4,650 is the soft kill). Target one: $4,780. Target two: $4,850. Risk to reward: roughly 1:1 then 1:1.5 on the wider stop, 1:1.8 and 1:2.7 on a tighter $4,650 close-stop.
Why it works: Three drivers stack the trade. Dovish Powell adds a discount-rate tailwind. Hormuz keeps the safe-haven bid live. A weaker dollar (DXY losing 98.00) detaches the cap. Pays on any one, harder if two land. Kill condition: Close below $4,650 with DXY breaking 99.20 cancels both legs.
Alternative Short Setup
Tactical Short: Fade The Failed Push Above $4,850
Risk score: around 50 percent
Entry: $4,840 to $4,860 on a wick rejection candle paired with confirmed Hormuz reopening or hawkish Powell. Stop: $4,905. Target one: $4,720. Target two: $4,650. Risk to reward: roughly 1:2.6 then 1:4.
Why it works: Spec at twelve-month highs is the textbook late-cycle exhaustion signature. Push into $4,850 and reject on volume and the unwind is mechanical. Kill condition: Two clean daily closes above $4,860. Anticipating the rejection is how this fade kills accounts.
Time Horizons
Intraday: The $4,690 to $4,720 band is the working range. Above it, momentum carries into the $4,750 magnet. Below it, the metal hunts back to $4,650 before sellers run out of paper.
Swing (two to ten days): Powell Wednesday is the binary catalyst. Dovish tilt sends the metal into $4,780 to $4,850 by Friday’s close. Hawkish hold pulls it back to test $4,650.
Positional (two to eight weeks): Where the conviction sits. The Fed transition introduces uncertainty about the next chair’s reaction function. The Hormuz supply-fear premium is now embedded in 2026 inflation expectations. Dollar refusing to weaken while gold prints higher is a divergence that historically resolves through the dollar weakening, not the metal selling. Constructive into the $5,000 magnet over four to eight weeks, with $4,850 the line where size starts coming off.
Risk Score
Gold risk score: around 55 percent.
- Plus 20 percent for spec long near twelve-month high (crowded positioning can flush)
- Plus 15 percent for Powell as binary mid-week catalyst
- Plus 10 percent for the dollar refusing to roll over despite records on the metal
- Plus 10 percent for Hormuz being headline-driven and reversible overnight
- Minus 15 percent because three drivers all point long and the trade pays even if one turns
Size for the binary nature of Wednesday, not the strength of the structural read.
The Catalyst Stack
Wednesday: Powell’s final Fed press conference. Gold prices the discount rate. A dovish tilt sends the metal into the $4,780 to $4,850 band on the same session. A hawkish defence pulls it back to $4,650.
Live: Hormuz blockade. Bloomberg confirmed traffic halted with blockades firmly in place at 06:47 London Sunday. Iran’s energy minister warned the BBC of eight months of higher prices. While the strait stays shut, the safe-haven bid has a continuous catalyst. A confirmed reopening is the cleanest single reason the metal could give back $50 to $80 in a session.
Cross-asset: dollar direction. DXY at 98.51 with gold at $4,709 is a divergence the macro book wants resolved. Dollar through 98.00 and the metal extends to $4,850. Dollar breaks 99.20 and the metal compresses sideways while it digests the spec long. The dollar is the slowest driver and decides which week the metal extends.
Long bias is the base case. Structure is behind price, macro stack supports the bid, the dollar is the only friction and it is already losing the argument. The short activates only on confluence of a clean rejection and confirmed news against the metal. The job is not to predict Wednesday. The job is to be sized correctly going in and let the levels decide.
What We Called vs What Happened
| Call (22 Apr) | Outcome (by 26 Apr) | Verdict |
|---|---|---|
| Stay long, structural demand thesis intact. | Spot held the regime and closed Friday at $4,709, off the $4,757 print but well inside the swing range with no structural break. | Partially |
| Use dips into the $4,680 to $4,710 zone for entries. | The Friday close at $4,709 dropped straight into the upper band of the entry zone. | Confirmed |
| Pullbacks stay shallow, $4,620 structural support holds. | Lowest print across the four sessions never tagged $4,620. Floor held cleanly. | Confirmed |
| Target one $4,850, target two $5,000 on continuation. | Neither extension printed inside the window. The metal consolidated rather than extended. | Open |
| Stop below $4,550 questions the trend. | Never threatened. Lows held more than $100 above the stop. | Confirmed |
Track record: three of five calls confirmed over the four-session window, with the upside extension still open and the regime call partially graded because the metal held but did not extend.
This is analysis, not financial advice. Always manage your risk.
Thursday 23 Apr 2026
Daily Framework Read | Thursday 23 April 2026 | Published 22:00 London / 17:00 New York / 07:00 Tokyo
EURUSD
1.1696 -0.41%
The euro weakened against a recovering dollar. After yesterday’s USD weakness on the risk-on rally, the greenback found its footing today as equities pulled back. EUR/USD slipped below 1.17 on the session. The move aligns with a broader risk-off rotation where the dollar tends to catch a bid.
Framework Read
| Layer | Reading | Interpretation |
|---|---|---|
| Direction | LONG (medium-term) | Broader EUR uptrend intact despite today’s pullback |
| Structure | Pullback within uptrend | Higher lows pattern holds above 1.1600 |
| Momentum | Cooling | Short-term overbought condition unwinding |
| Flow | Dollar bid | Safe-haven dollar demand on equity pullback |
| Evidence | Bullish pullback | Dip within the broader EUR uptrend |
Yesterday vs Today
Yesterday EUR/USD pushed higher as risk-on weakened the dollar. Today the move reversed with equities pulling back. This is textbook FX behaviour: dollar weakens on risk-on, strengthens on risk-off. The pair is still well above its April lows, suggesting the pullback is correction, not reversal.
The Read
ECB rate expectations remain dovish relative to the Fed, which limits EUR upside. But the broader dollar weakness trend driven by US fiscal concerns continues to support the pair on dips. The 1.1600 level is the line to watch. As long as it holds, the medium-term bias stays bullish for the euro.
The call: buy dips toward 1.1620-1.1650. Stop below 1.1580. Target 1.1800-1.1850 on the next leg.
Key Levels
| Level | Price | Significance |
|---|---|---|
| Target 2 | 1.1850 | Swing high extension |
| Target 1 | 1.1800 | Psychological resistance |
| Entry Zone | 1.1620-1.1650 | Pullback entry area |
| Support 1 | 1.1600 | Key structural support |
| Stop Zone | 1.1580 | Below here the uptrend is questioned |
| Support 2 | 1.1500 | Deep pullback level |
What We Called vs What Happened
Yesterday the framework flagged EUR/USD as bullish with support at 1.1650. Today the pair pulled back to 1.1696, still above that support zone. The medium-term bullish thesis remains intact. The pullback provides an entry opportunity rather than a reason to flip bearish.
Risk Assessment
Domain risk: Around 35% (moderate)
FX risk is contained while the range holds. ECB dovishness is priced in. Dollar strength on risk-off is temporary unless equity weakness deepens materially. The main risk is a surprise hawkish Fed shift or geopolitical escalation that drives sustained dollar demand.
Bottom line: EURUSD pulled back on dollar strength but the medium-term uptrend holds above 1.1600. Buy dips toward 1.1620-1.1650. Target 1.1800. The broader USD weakness narrative supports the euro on pullbacks.
Cross-reference: Today’s FX Report for cross-pair analysis and flow data.
This is analysis, not financial advice. Always manage your risk.
Thursday 23 Apr 2026
Daily Framework Read | Wednesday 22 April 2026 | Published 22:00 London / 17:00 New York / 07:00 Tokyo
1.1710 -0.63%
EUR/USD slipped 63 pips as the dollar firmed on equity inflows. When US equities rally this hard, capital flows into dollar-denominated assets and the greenback strengthens. The framework says WATCHING. This is not a euro collapse. It is a dollar bid driven by equity demand. The distinction matters because it tells you the move is conditional, not structural.
Framework Read
| Layer | Reading | Interpretation |
|---|---|---|
| Direction | WATCHING | Dollar firming on equity flows, not on rate expectations. Conditional move |
| Structure | Pulling back within range | Still within the larger range. Not a breakdown. A pullback |
| Momentum | Mild bearish | Short-term momentum favours the dollar but medium-term is flat |
| Flow | Dollar bid | Equity inflows driving dollar demand. Not a fundamental shift in rate expectations |
| Evidence | Inconclusive | The move is real but the driver is conditional. If equities stall, this reverses |
Yesterday vs Today
Yesterday EUR/USD held relatively steady as markets drifted. Today the US equity rally pulled capital into dollar assets and the euro paid the price. The move was orderly, not panicked. No flash crash, no capitulation. Just steady dollar demand as equity flows dominated the session.
The Read
The driver here is equity flows, not fundamentals. The ECB and Fed positioning has not changed materially. What changed is that US equities rallied hard and that pulls capital into dollars. If the equity rally stalls or reverses, this EUR/USD move reverses too. That is why the framework says watch, not short.
The call: no trade. The move is conditional and the evidence is inconclusive. Trading EUR/USD right now is essentially taking a view on whether the US equity rally continues. If you are already positioned in equities, you do not need to double up the exposure through FX.
Key Levels
| Level | Price | Significance |
|---|---|---|
| Resistance | 1.1800 | Prior range ceiling. Reclaim here negates the dollar bid |
| Pivot | 1.1750 | Session pivot. Near-term decision point |
| Support 1 | 1.1680 | First support cluster. Tested today |
| Support 2 | 1.1600 | Deeper structural support. Break here signals a trend change |
What We Called vs What Happened
The framework was watching EUR/USD and that was the right call. The dollar firmed on equity inflows as expected. No trade was the best trade here because the move was driven by a secondary catalyst, not a direct EUR/USD setup.
Risk Assessment
Domain risk: Around 55% (moderate-elevated)
The risk is elevated because the move is conditional on equity flows. If equities reverse, EUR/USD bounces. If equities continue, EUR/USD drops further. You are essentially making two bets in one trade. That doubles your risk surface.
Bottom line: EUR/USD is a watch. The dollar bid is real but conditional on equity flows. No clean edge exists in this pair right now. Better to express your view through equities directly than through the currency proxy.
Cross-reference: Today’s FX Report for dollar index context and flow analysis.
This is analysis, not financial advice. Always manage your risk.
Tuesday 21 Apr 2026
Daily Framework Read | Tuesday 22 April 2026
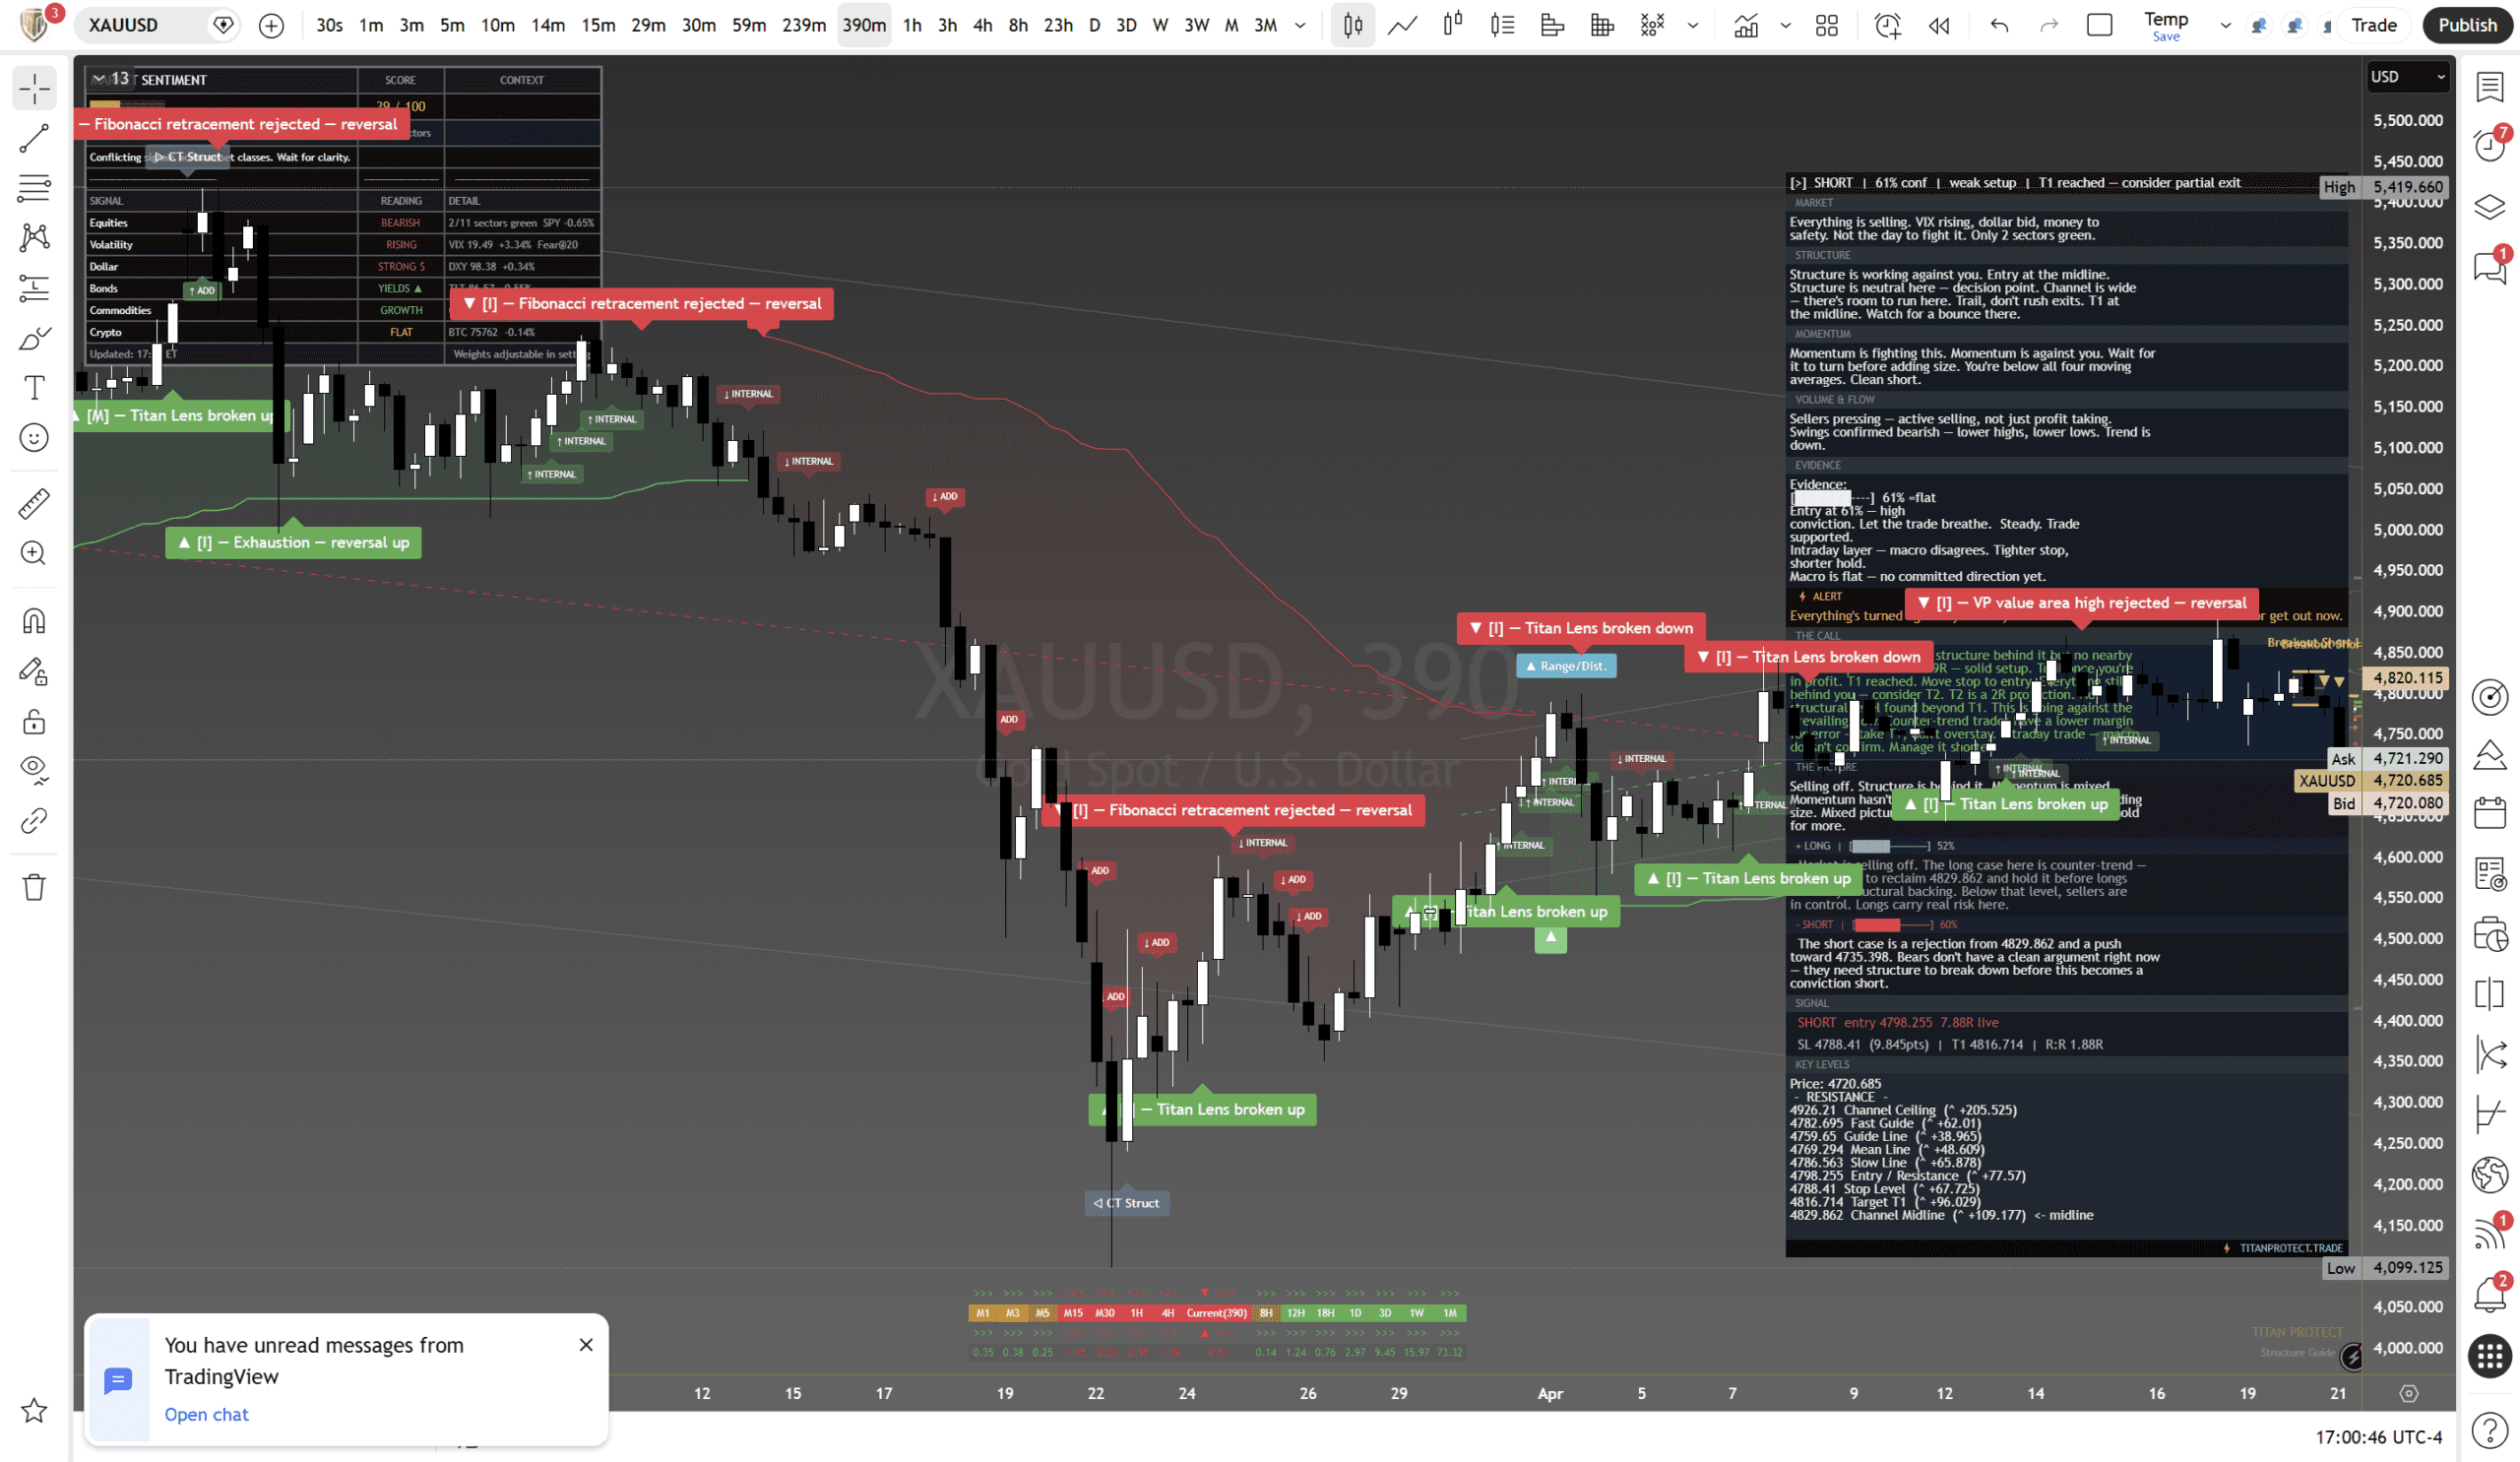
Gold dropped over 2% — the biggest single-day pullback in weeks. After hitting highs near $4,820, sellers took control. The dollar bid and rising VIX triggered profit-taking across the metals complex. Structure has broken down on the short timeframe, but the macro trend remains up. This is a pullback within a trend, not a reversal — unless $4,600 breaks.
Structure
Structure is working against longs. Entry at the midline — decision point. Channel is wide with room to run. Below all four moving averages. Clean short on the intraday, but the macro trend remains up.
Momentum and Flow
Momentum is fully aligned with the short case on the intraday. Below all four moving averages. Clean short. But the macro layer has not flipped — this is still a pullback within a larger uptrend.
Sellers pressing with active distribution. Swings confirmed bearish — lower highs, lower lows. The trend is down on the short timeframe. Volume confirms the sellers are committed.
The Two Cases
The long case here is counter-trend — looking to reclaim 4,829.86 and hold it before longs get structural backing. Below that level, sellers are in control. Longs carry real risk here.
Rejection from 4,829.86 and a push toward 4,735.40. Bears have momentum, structure, and volume on the intraday. The risk is this resolves back into the macro uptrend.
Key Levels
| Resistance | 4,962.21 | Channel Ceiling |
| Resistance | 4,829.86 | Channel Midline |
| Pivot | 4,786.27 | Entry / Resistance |
| Support | 4,735.40 | Target 1 |
| Support | 4,709.30 | Mean Line |
| Support | 4,600.00 | Major Support |
Market Context
Gold -2.29% ($4,696 close). Silver -5.39% following. DXY +0.51%. VIX at 20.29. Dollar bid and risk-off are headwinds. Safe haven flows split between cash and metals.
Analysis from our institutional research desk. Educational content only — not financial advice. Market data as of 21 April 2026. Past performance is not indicative of future results. All trading involves risk — manage yours. Independent analysis — no affiliation with any broker. Always do your own research before trading.


