Price Action and Distribution Signals
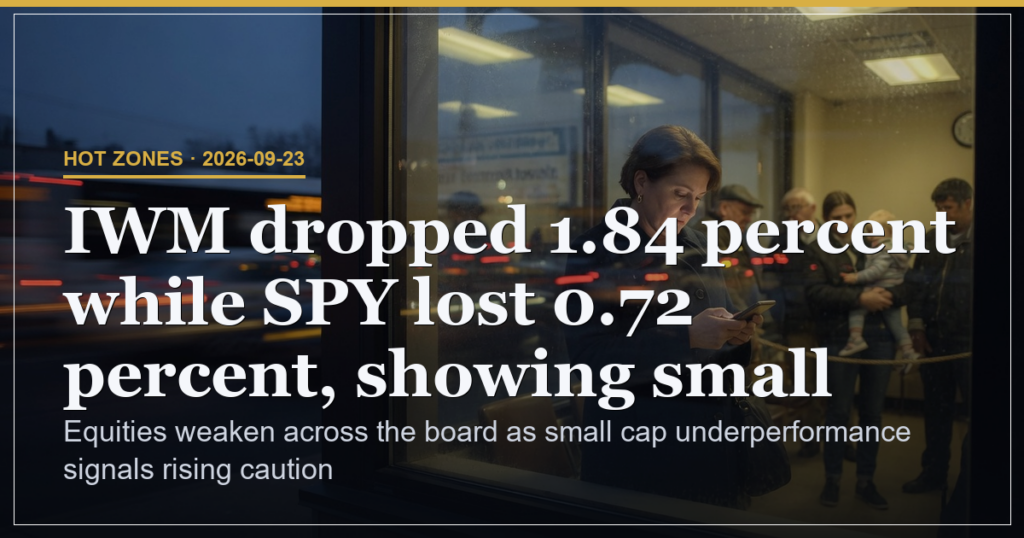
Broad indices closed lower with small caps leading the selloff at 1.84 percent, increasing downside pressure on risk assets. SPY finished at 767.81 after losing 0.72 percent while QQQ slipped 0.84 percent to 741.21. Volume picked up across both benchmarks, confirming distribution rather than consolidation as sellers absorbed the earlier call-driven bid. IWM dropped 1.84 percent to 281.92 against SPY’s milder decline, showing small caps bear the brunt of the move and widening the leadership gap first flagged in yesterday’s Hot Zones post.
Evolution from Yesterday’s Rotation View
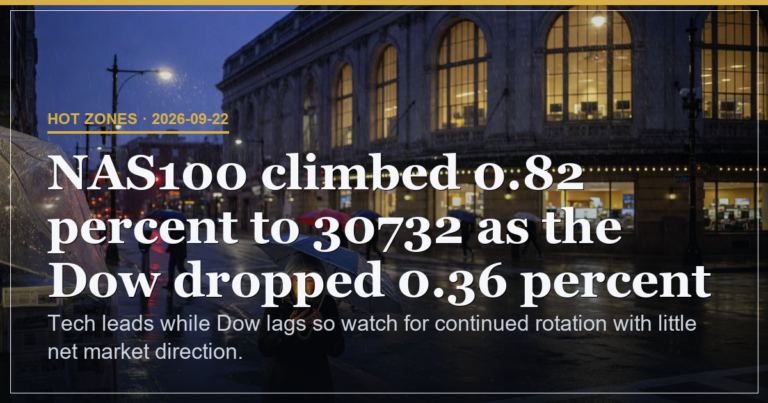
Building on yesterday’s view from the Hot Zones post, the pattern has evolved from a steadier tilt into growth leaders toward outright downside follow-through. Nasdaq had climbed 0.82 percent while the Dow fell 0.36 percent, yet today’s session erased those gains and left the tape vulnerable. As our Positioning Pressure read notes, bullish options positioning with a put call ratio at 0.79 and concentrated call flow in AAPL, TSLA, META, MSFT and AMZN still sits against the price breakdown, leaving institutional delta hedging unable to offset the volume-driven selling.
Key Levels and Tactical Pressure Points
SPY support sits at 766.50 with resistance at 772.80. QQQ tested a low of 738.19 and opened at 746.99, so any close back above the open would require fresh upside delta that the current options flow has not yet supplied. These levels now act as the immediate battleground where the next session’s direction will be decided.
| Index | Close | Change | Tactical Insight |
|---|---|---|---|
| SPY | 767.81 | -0.72% | Failure to hold 766.50 opens room for a test of 760 and raises follow-through selling odds. |
| QQQ | 741.21 | -0.84% | Break below 738.19 would accelerate gamma hedging in the mega-cap names that still dominate call prints. |
| IWM | 281.92 | -1.84% | Underperformance signals risk-off rotation that can drag broader indices even if options flow stays net long. |
Options Flow versus Price Reality
Bullish options positioning dominates with zero bearish names on the screen and call buying still pinned to the same five mega-cap names. This leaves the options channel as the sole active institutional signal, yet the absence of dark pool prints removes any counter-evidence of accumulation. Every fresh call print adds incremental upside delta that dealers must hedge, but the small-cap breakdown overrides that support and keeps the tape exposed to further distribution.
| Name | Flow Type | Tactical Insight |
|---|---|---|
| AAPL | Call buying | Reinforces support near 760 yet invites follow-through above 780 only if volume reverses. |
| TSLA | Call buying | High gamma name that can accelerate index moves on any volume spike or further downside breach. |
| META | Call buying | Keeps QQQ bid while broader small caps lag per Setup Radar, limiting diffusion of support. |
| MSFT | Call buying | Steady delta absorption limits downside in the near term but cannot offset IWM weakness alone. |
Scenario Probabilities and Risk Assessment
Three scenarios frame the next session: further downside pressure at 45 percent probability, range-bound consolidation at 35 percent, and relief rebound at 20 percent. Risk sits at 55 percent driven by the small-cap underperformance factor that continues to widen leadership divergence and invites additional selling into any volume spike.
Experience-Level Guidance
Beginner traders should focus on the 766.50 and 738.19 levels and avoid new long exposure until a clear reclaim of opening prints occurs. Intermediate participants can monitor the put call ratio for any jump above 1.0 as an early warning of hedging demand. Advanced desks will watch the gamma profile in the five mega-cap names for signs that dealer hedging flips from supportive to amplifying on any further IWM breakdown.
Bias: small-cap leadership of the selloff keeps the near-term tone defensive until breadth improves. This is analysis, not financial advice. Always manage your risk.