The USDJPY Framework Journal for May 2026, newest read at the top. Each dated entry is our read on the close, kept as a living record so the framework can be judged over time. This is analysis, not financial advice.
Saturday 30 May 2026
USD/JPY — Daily Read | Saturday 30 May 2026
USD/JPY | Post Close Setup Daily Read | Data basis: 2026-05-30 close
Where It Sits
Structure
Structurally USD/JPY has pulled back into the session close. The broader trend remains intact on the daily timeframe but the shorter timeframe has softened. The structure is contested near the 159.25 level.
Momentum
Momentum is neutral with internal readings near the centre of the range. That is the signature of a market digesting the prior move. The tape needs a fresh catalyst to commit to direction.
Volume & Flow
Volume data is limited for this session. The positioning read is neutral — no obvious skew in either direction. Watch for flow confirmation on the next session.
Key Levels
| Level | Type | Significance | Action Zone |
|---|---|---|---|
| 159.69 | Resistance | Upper range target, prior supply zone | Take profits / fade if rejected |
| 159.40 | Pivot | Mid-range continuation marker | Hold = constructive; lose = consolidation |
| 159.25 | Session close | Reference anchor for next session | Above = continuation; below = mean revert |
| 159.02 | Support | Recent range floor, demand zone | Buy zone with defined stop |
| 158.73 | Major support | Prior breakout retest level | Stop-out below for longs |
Three Scenarios
Continuation
USD/JPY holds the session close at 159.25 and pushes lower on continued positioning flow. The broader trend remains intact. Watch the dollar tape for confirmation.
Range
USD/JPY opens flat and ranges around 159.25. Neither side has conviction without a fresh data catalyst. Range trade dominates.
Mean Reversion
USD/JPY breaks below support on a shift in dollar positioning. Mean reversion within the broader trend. Watch for a clean test of support before committing.
Risk Score
Risk sits at Around 50%
Risk sits around 50 per cent. Vix at 15.4 supports a measured risk posture. sentiment at 61 is in greed territory. Currency pairs carry intervention and data-release headline risk. Standard sizing with defined stops — discipline beats conviction.
How to Walk It
Entry / Stop / Target structure:
- Long 159.02 pullback | Stop 158.73 | Target 159.40 | R:R 2:1
- Long 159.40 breakout | Stop 159.25 | Target 159.69 | R:R 1.5:1
- Fade 159.69 rejection | Stop above resistance | Target 159.25 | R:R 2:1
Experience-level guidance:
Beginner: Reduce size to half your standard. Trade only the cleanest setup from the entries above. If the tape opens against your bias, do nothing — wait for the second hour, when the institutional flow has tipped its hand.
Intermediate: Use the levels table to define the trading range. Fade the extremes with defined stops, take profits before the round-number resistance levels.
Advanced: The vol regime supports defined-risk structures around the key pivot levels. Keep notional small relative to your book — asymmetric speculation, not core positioning.
Continue Reading
The macro frame driving this read is unpacked in the session briefs:
Check the latest session briefs on the site.
This analysis is for educational and informational purposes only. It does not constitute financial advice. Always manage your risk independently and in accordance with your own financial circumstances.
Thursday 28 May 2026
GBP/USD — Daily Framework Read | Thursday 28 May 2026
GBP/USD | Post Close Setup Daily Read | Data basis: 2026-05-28 close
Where It Sits
Structure
Structurally GBP/USD has pulled back into the session close. The broader trend remains intact on the daily timeframe but the shorter timeframe has softened. The structure is contested near the 1.3441 level.
Momentum
Momentum is neutral with internal readings near the centre of the range. That is the signature of a market digesting the prior move. The tape needs a fresh catalyst to commit to direction.
Volume & Flow
Volume data is limited for this session. The positioning read is neutral — no obvious skew in either direction. Watch for flow confirmation on the next session.
Key Levels
| Level | Type | Significance | Action Zone |
|---|---|---|---|
| 1.3559 | Resistance | Upper range target, prior supply zone | Take profits / fade if rejected |
| 1.3480 | Pivot | Mid-range continuation marker | Hold = constructive; lose = consolidation |
| 1.3441 | Session close | Reference anchor for next session | Above = continuation; below = mean revert |
| 1.3378 | Support | Recent range floor, demand zone | Buy zone with defined stop |
| 1.3299 | Major support | Prior breakout retest level | Stop-out below for longs |
Three Scenarios
Continuation
GBP/USD holds the session close at 1.3441 and pushes lower on continued positioning flow. The broader trend remains intact. Watch the dollar tape for confirmation.
Range
GBP/USD opens flat and ranges around 1.3441. Neither side has conviction without a fresh data catalyst. Range trade dominates.
Mean Reversion
GBP/USD breaks below support on a shift in dollar positioning. Mean reversion within the broader trend. Watch for a clean test of support before committing.
Risk Score
Risk sits at Around 50%
Risk sits around 50 per cent. Vix at 15.7 supports a measured risk posture. sentiment at 60 is in greed territory. Currency pairs carry intervention and data-release headline risk. Standard sizing with defined stops — discipline beats conviction.
How to Walk It
Entry / Stop / Target structure:
- Long 1.3378 pullback | Stop 1.3299 | Target 1.3480 | R:R 2:1
- Long 1.3480 breakout | Stop 1.3441 | Target 1.3559 | R:R 1.5:1
- Fade 1.3559 rejection | Stop above resistance | Target 1.3441 | R:R 2:1
Experience-level guidance:
Beginner: Reduce size to half your standard. Trade only the cleanest setup from the entries above. If the tape opens against your bias, do nothing — wait for the second hour, when the institutional flow has tipped its hand.
Intermediate: Use the levels table to define the trading range. Fade the extremes with defined stops, take profits before the round-number resistance levels.
Advanced: The vol regime supports defined-risk structures around the key pivot levels. Keep notional small relative to your book — asymmetric speculation, not core positioning.
Continue Reading
The macro frame driving this read is unpacked in the session briefs:
Check the latest session briefs on the site.
This analysis is for educational and informational purposes only. It does not constitute financial advice. Always manage your risk independently and in accordance with your own financial circumstances.
Thursday 28 May 2026
GBP/USD — Daily Framework Read | Thursday 28 May 2026
GBP/USD | Pre Asia Setup Daily Read | Data basis: 2026-05-28 close
Where It Sits
Structure
Structurally GBP/USD has pulled back into the session close. The broader trend remains intact on the daily timeframe but the shorter timeframe has softened. The structure is contested near the 1.3429 level.
Momentum
Momentum is neutral with internal readings near the centre of the range. That is the signature of a market digesting the prior move. The tape needs a fresh catalyst to commit to direction.
Volume & Flow
Volume data is limited for this session. The positioning read is neutral — no obvious skew in either direction. Watch for flow confirmation on the next session.
Key Levels
| Level | Type | Significance | Action Zone |
|---|---|---|---|
| 1.3435 | Resistance | Upper range target, prior supply zone | Take profits / fade if rejected |
| 1.3431 | Pivot | Mid-range continuation marker | Hold = constructive; lose = consolidation |
| 1.3429 | Session close | Reference anchor for next session | Above = continuation; below = mean revert |
| 1.3425 | Support | Recent range floor, demand zone | Buy zone with defined stop |
| 1.3420 | Major support | Prior breakout retest level | Stop-out below for longs |
Three Scenarios
Continuation
GBP/USD holds the session close at 1.3429 and pushes lower on continued positioning flow. The broader trend remains intact. Watch the dollar tape for confirmation.
Range
GBP/USD opens flat and ranges around 1.3429. Neither side has conviction without a fresh data catalyst. Range trade dominates.
Mean Reversion
GBP/USD breaks below support on a shift in dollar positioning. Mean reversion within the broader trend. Watch for a clean test of support before committing.
Risk Score
Risk sits at Around 50%
Risk sits around 50 per cent. Vix at 16.3 supports a measured risk posture. sentiment at 61 is in greed territory. Currency pairs carry intervention and data-release headline risk. Standard sizing with defined stops — discipline beats conviction.
How to Walk It
Entry / Stop / Target structure:
- Long 1.3425 pullback | Stop 1.3420 | Target 1.3431 | R:R 2:1
- Long 1.3431 breakout | Stop 1.3429 | Target 1.3435 | R:R 1.5:1
- Fade 1.3435 rejection | Stop above resistance | Target 1.3429 | R:R 2:1
Experience-level guidance:
Beginner: Reduce size to half your standard. Trade only the cleanest setup from the entries above. If the tape opens against your bias, do nothing — wait for the second hour, when the institutional flow has tipped its hand.
Intermediate: Use the levels table to define the trading range. Fade the extremes with defined stops, take profits before the round-number resistance levels.
Advanced: The vol regime supports defined-risk structures around the key pivot levels. Keep notional small relative to your book — asymmetric speculation, not core positioning.
Continue Reading
The macro frame driving this read is unpacked in the session briefs:
Check the latest session briefs on the site.
This analysis is for educational and informational purposes only. It does not constitute financial advice. Always manage your risk independently and in accordance with your own financial circumstances.
Tuesday 26 May 2026
Dollar-Yen is telling a different story to the rest of the FX board. While EUR and GBP have been grinding higher against the Dollar, USD/JPY has been under sustained pressure as Yen strength reasserts itself. The pair put in a clear rejection at a supply zone earlier in the week. The analysis flagged it as a high-value area where the trend was working against buyers, and the subsequent decline has been orderly and purposeful. This is not a flash move driven by thin conditions. It has all the hallmarks of institutional repositioning.
The structural picture shows a sequence of lower highs developing on the 390-minute timeframe. Each attempt to reclaim lost ground has been met with selling. The key rejection this week came from a zone that had previously acted as major support before the breakdown — when support flips to resistance and price confirms it from the underside, that is the structure telling you the directional bias clearly. The reading throughout has been to sell rallies rather than buy dips.
The 143.80 to 144.20 zone is now the ceiling. Any bounce into that area into early next week would represent the short opportunity. The downside target sits at the 141.50 to 141.80 area, which is where the next significant demand zone comes in. A clean break and close below 141.50 on the daily would open the 139 handle, which is where the larger structural picture points longer term if the Dollar continues to weaken broadly.
| Level | Price | Notes |
|---|---|---|
| Entry Zone (Short) | 143.80 – 144.20 | Flipped resistance, supply zone, sell rally area |
| Stop | 145.10 | Above structural supply, short bias invalidated |
| Target 1 | 141.60 | Weekly demand, measured downside |
| Target 2 | 139.50 | Larger structure target if breakdown extends |
| R:R | 2.4 : 1 | To Target 1 from mid-entry |
The short bias is structurally sound, but USD/JPY carries a specific weekend risk that most pairs do not: Bank of Japan intervention. The BoJ has shown a willingness to act at weekends and on thin liquidity, particularly if the Yen appreciates sharply. There is also the standard bank holiday gap risk on the UK open Tuesday. On top of that, any risk-off event over the weekend could trigger safe-haven Yen buying that creates a gap lower in the pair. The risk score reflects a legitimate trade setup with material event risk attached to it.
USD/JPY is not a pair for holding oversized positions through weekends in the current environment. If you are short from higher levels, consider trimming into the close and holding only a portion with a stop above the supply zone. The ideal entry for new shorts is on a bounce into the 143.80 to 144.20 area early next week, where the structure gives you a defined level to trade against. Patience on this one is not optional; it is how you avoid getting caught in a gap that takes out your stop before the move even begins.
Saturday 23 May 2026
Dollar / Yen (USD/JPY) — Weekend Daily Read
Framework Bias
NEUTRAL/CAUTION
USD/JPY closed Friday at 159.155, gaining 0.17% to push back toward the 160 level that has historically triggered Bank of Japan intervention. This is the most important level in the pair right now. Above 160, the BoJ has demonstrated willingness to sell dollars and buy yen, which can produce sharp and fast moves lower in the pair.
The framework is neutral-to-cautious rather than directionally biased. The yield differential between US Treasuries and Japanese Government Bonds favours the dollar structurally, but this is a pair where central bank intervention risk creates an asymmetric downside. A 100-pip BoJ-induced drop can happen in minutes; a 100-pip organic dollar gain takes days.
If you are long USD/JPY above 158, you are playing a game of chicken with the BoJ. It can work. It has worked this cycle. But the risk-reward calculus changes above 160, and the framework reflects that caution. Neutral here means neither pressing long nor shorting aggressively; it means watching the 160 level and acting on what happens there.
Key Levels
| Level Type | Price | Note |
|---|---|---|
| Intervention Risk Zone | 160.00+ | BoJ has intervened repeatedly above this level |
| Near Resistance | 159.235 | Friday session high |
| Current Price | 159.155 | Friday close |
| Near Support | 158.918 | Friday session low |
| Key Support | 157.500 | Prior consolidation range and weekly demand |
| Major Support | 155.000 | Structural support and pre-rally base |
Trade Framework
| Scenario | Entry Zone | Stop | Target | R:R |
|---|---|---|---|---|
| Short at BoJ intervention zone | 159.80 to 160.20 | 160.70 | 158.50 | approx 2.6:1 |
| Long on confirmed BoJ absence | 158.00 hold with bounce | 157.20 | 159.50 | approx 1.9:1 |
| Short on BoJ action confirmation | 158.50 break after spike down | 159.20 | 156.50 | approx 2.9:1 |
Confidence level: around 50%. The 50% reflects genuine two-sided uncertainty at this level. The pair is technically positioned for further gains but the intervention overlay makes this a coin toss at 159 to 160. The cleanest trade is shorting the 160 zone and catching the BoJ reaction, but that requires discipline to hold through the initial push higher.
Weekend Context
USD/JPY is the bellwether for the entire yen carry trade complex. When USD/JPY rises, it typically means carry trades are being funded in yen and deployed into higher-yielding assets globally. The Nikkei’s 2.68% surge on Friday is partly the mirror image of this: cheap yen funding driving money into Japanese export stocks and global equities simultaneously.
The risk to this arrangement is a sudden risk-off event that forces carry trade unwinding. When that happens, yen strengthens sharply across the board and equities sell off simultaneously. This is the “yen unwind” risk that experienced traders watch carefully. It is not the base case right now, but it is the tail risk that matters most.
The BoJ’s communication over the weekend is worth watching. Any remarks about currency levels or the speed of yen depreciation from BoJ officials would be a signal that intervention is being considered. Set a news alert for BoJ governor comments through the weekend.
Friday 22 May 2026
FX | Friday 22 May 2026
USD/JPY: Approaching the 160 Line Where Tokyo Gets Uncomfortable
Thursday close: 159.04 | Daily change: +0.09% | Bias: High Alert Zone
Current Read
USD/JPY is sitting 96 pips away from 160. That gap matters more than the nine basis points it moved on Thursday. The 160 level is not just a round number, it is the point at which Japanese authorities have historically moved from verbal warning to direct market intervention. Trading through 160 without consequence would be unusual given the track record, but the pair has been grinding higher all week and momentum is on the dollar’s side.
The yen’s weakness is structural at this point. The Bank of Japan remains the outlier among major central banks, maintaining an accommodative stance while its counterparts have spent two years tightening. That divergence is what has driven the pair from 135 to 159 over the past year, and nothing in the near-term calendar changes that fundamental picture.
What changes the picture is Tokyo acting. Japanese officials have been escalating their language over the past week, moving from “monitoring closely” to statements that carry a more definitive tone. The risk of a surprise intervention on any given day is real, and it is highest when the pair is pushing toward a level that the Ministry of Finance has previously identified as disorderly.
Key Levels
What Changed Thursday
The pair added nine pips on Thursday, which sounds unremarkable until you consider what it represents: another step toward 160 with no pushback. The Bank of Japan made no market moves and offered no fresh commentary, which in itself is a form of permission from the market’s perspective. Every day that Tokyo stays silent as the pair climbs is a day that traders conclude the threshold for action has moved higher.
The US side added fractional dollar strength, consistent with the marginal bid seen in DXY. Nothing dramatic. The slow grind is actually the most dangerous pattern heading into 160 because it brings in momentum traders who are not positioned for the intervention risk. When Tokyo does act, those traders exit simultaneously, which is what creates the violent downside moves seen in previous intervention episodes.
Friday Scenarios
Bull Case (USD Strength)
Pair pushes toward 159.50 and tests the 160 psychological level. No intervention occurs. This outcome would represent a new multi-year high and potentially trigger momentum buying that carries the pair to 160.50 in the short term. However, this is the scenario where intervention risk is at its absolute highest.
Base Case
Pair consolidates between 158.50 and 159.50. Traders are cautious approaching 160 ahead of the weekend, knowing that intervention can happen at any time including after market hours. The pair drifts sideways without a directional catalyst. This is the most likely outcome for a Friday where the market has already run most of the week.
Bear Case (Intervention)
Tokyo intervenes, either directly in the market or via a hawkish BOJ statement that shifts rate expectations. The pair drops 200-400 pips rapidly. Previous interventions have seen moves of this magnitude within minutes. This scenario is low probability on any given day but elevated given the proximity to 160 and the week-long grind higher.
Sizing and Approach
This is not a pair to be long of going into the weekend with full size. The asymmetric risk is clear: you gain a handful of pips if the grind continues, but you face a 200-400 pip downside if intervention happens. That ratio is unfavourable even if the probability of intervention on any single day is low.
If you are already long from lower levels, consider banking partial profits ahead of the weekend. New longs above 159 require tight stops and an acceptance that you might be stopped out by a sudden spike. Shorts near 160 as a tactical fade carry high reward but require wide stops or they will be run in the approach. This is a pair to watch rather than to trade aggressively on Friday.
Cross-References
- DXY: Dollar strength at 99.23 is providing the bid. If DXY rolls over, USD/JPY follows.
- US Treasuries: Rising US 10-year yields are a primary driver of this pair. Any reversal in yields eases pressure on the yen.
- Gold: A sharp move higher in gold would signal risk-off conditions that typically strengthen the yen as a safe haven.
- GBP/USD and EUR/USD: If both majors are selling off simultaneously, it confirms broad dollar strength. If they are flat while USD/JPY rises, it is a Japan-specific story and intervention risk is even higher.
Sunday 17 May 2026
—
title: “USDJPY Weekly Review : 16 May 2026”
date: “2026-05-16”
instrument: “USDJPY”
type: ticker-review
—
Weekend Ticker Review | 16 May 2026
USDJPY : 345bps Gap. The Biggest Carry Trade in the World. The Biggest Tail Risk Too.
USDJPY | Spot FX | 12-16 May 2026
1. Week at a Glance
| BOJ Rate | 0.50% |
| US 10Y Yield | 4.50%+ : crossed this threshold Friday |
| Rate Differential | 345bps : largest in cycle, most active carry globally |
| USDJPY Support | 151.00 |
| USDJPY Resistance | 157.00 |
| Tail Risk Trigger | 10Y above 4.65% or BOJ surprise hike |
| Analogue Risk | August 2024 : carry unwind took days, not weeks |
| Signal | AVOID DIRECTIONAL : asymmetric tail risk outweighs edge |
2. What Happened
The US-Japan rate differential hit 345 basis points this week. That is the largest gap in this cycle. When you borrow in the lowest-yielding G10 currency and invest in the highest-yielding, you earn 345 basis points of carry. That is why the yen carry trade is the most active in the world right now.
Friday’s 10-year yield move above 4.50% widened that gap further. Every basis point the Fed’s rate rises relative to BOJ’s policy makes the carry trade more profitable : and more dangerous. The profitability attracts more participants. More participants means more forced sellers when the unwind comes.
August 2024 showed exactly how fast it goes. The BOJ raised rates by a small amount. The yen carry trade unwound in days. Nikkei dropped sharply. Everyone who was long USDJPY or short JPY against other currencies took concentrated losses in a very compressed timeframe. That event is the template for what happens when this trade breaks.
Right now the carry is intact and dollar strength is the backdrop. USDJPY should be biased higher in that environment. But the tail risk is so asymmetric that directional trading in USDJPY is not the right call. You cannot size it appropriately when the downside scenario is a regime-shift event.
3. What the Alpha Insights Said
FX Focus : Post 11
USDJPY explicitly rated AVOID directional. The language is clear: asymmetric risk makes sizing uncomfortable. Carry analysis: 475bps differential (policy rate basis), most active carry globally. Exit risk growing as BOJ gradually tightens. Tail risk: August 2024-style unwind if BOJ accelerates. Support 151.00, resistance 157.00. No trade entry identified : stated position is avoidance.
Overwatch : Post 18
10-year at 4.50% is the master variable. The danger zone is 4.55%-4.65%. Above 4.65% the thesis breaks : and for USDJPY specifically, breaking the thesis means a potentially disorderly carry unwind. That scenario would see yen strengthen rapidly, USDJPY fall sharply, and Nikkei sold aggressively. Tail risk is not a technical level : it is a regime shift.
Macro Pulse : Post 01
Dollar bidding on rate repricing is the macro backdrop for USDJPY. DXY at 99.27 confirms US exceptionalism trade intact. But crude +4.20% creates stagflationary undertone that no central bank controls : including the BOJ. Rising energy import costs for Japan on top of the rate differential creates a complex multi-factor picture that doesn’t support clean directional positioning.
Global Grid : Post 06
Japan stance: mixed. Flow: yen carry dynamics (not clean inbound or outbound). Stress: moderate : BOJ divergence. USDJPY rated dollar bid but BOJ tail risk limits upside conviction. CHF safe-haven muted on Friday confirms orderly session, but does not remove the structural carry risk that builds week after week at 345bps differential.
Volatility Lens : Post 03
VIX floor shift from 14-16 to 17-20 is relevant for USDJPY carry. Elevated vol regime means intraday ranges are wider across all instruments. In a pair with asymmetric tail risk like USDJPY, wider ranges mean bigger losses if you are on the wrong side of an unwind event. The vol regime directly increases the cost of being wrong in a tail scenario.
4. Key Levels
| Level | Price | Significance |
|---|---|---|
| Range Floor | 151.00 | Below here : carry unwind pressure building |
| Range Ceiling | 157.00 | BOJ intervention risk at extreme yen weakness |
| 10Y Danger Zone | 4.65% | Above this : carry unwind accelerates, scenario C active |
| 10Y Current | 4.50%+ | Already at critical threshold : 15bps from danger zone |
| Rate Gap | 345bps | Largest in cycle : proportional unwind risk |
| BOJ Hike Trigger | Any surprise | August 2024 analogue : happened in days after small hike |
5. Signal + Bias
Signal: AVOID DIRECTIONAL. Not a short. Not a long. An active decision to pass on this trade.
Why avoid: The dollar is bid. USDJPY should be biased higher. But the tail risk of a carry unwind is not quantifiable in R:R terms. When it goes, it goes fast and stops get gapped. You cannot size for that asymmetry.
What you can do: If you must have yen exposure, monitor within the 151.00-157.00 range. Do not add positions near the 157.00 extreme : BOJ intervention risk is real at extreme yen weakness. Do not short yen near 151.00 : the downside on a carry unwind is rapid.
Better uses of capital: GBP short, crude long, NVDA. All three carry better risk profiles with more identifiable invalidation levels. Pass on USDJPY this week.
6. Next Week Setup
FOMC minutes Wednesday 14:00 ET is critical. Hawkish language pushes 10-year toward 4.55-4.60% and widens the BOJ-Fed gap further. That extends the carry trade : but also brings the 4.65% danger zone closer. Every basis point higher from here increases the tail risk proportionally.
Any BOJ communication is the highest-priority watch for this pair. Even language suggesting a faster tightening path than expected can trigger disproportionate yen moves. The August 2024 template: small BOJ surprise, large yen move, rapid unwind. The trigger does not need to be dramatic to produce a dramatic result.
If 10-year stabilises in the 4.40%-4.55% range, USDJPY likely remains in the 151.00-157.00 box. That’s not a trading opportunity : that’s a range with no directional edge and meaningful tail risk on both sides. Patience is the position.
If conditions change : BOJ credibly signals pause on tightening, or 10-year falls back below 4.40% : revisit. Until then, USDJPY is the pair you watch, not the one you trade.
7. Risk Score
Around 75%
Highest risk score of any instrument reviewed this week. The 345bps carry gap is the largest in the cycle. The 10-year is 15 basis points from the danger zone that historically triggers unwind events. The August 2024 analogue shows the speed at which this can move. No directional position recommended. The risk score reflects what happens to anyone caught on the wrong side of a sudden BOJ action or 10-year spike : not the probability of a normal session.
Saturday 16 May 2026
—
title: “USDJPY Weekly Review : 16 May 2026”
date: “2026-05-16”
instrument: “USDJPY”
type: ticker-review
—
Weekend Ticker Review | 16 May 2026
USDJPY : 345bps Gap. The Biggest Carry Trade in the World. The Biggest Tail Risk Too.
USDJPY | Spot FX | 12-16 May 2026
1. Week at a Glance
| BOJ Rate | 0.50% |
| US 10Y Yield | 4.50%+ : crossed this threshold Friday |
| Rate Differential | 345bps : largest in cycle, most active carry globally |
| USDJPY Support | 151.00 |
| USDJPY Resistance | 157.00 |
| Tail Risk Trigger | 10Y above 4.65% or BOJ surprise hike |
| Analogue Risk | August 2024 : carry unwind took days, not weeks |
| Signal | AVOID DIRECTIONAL : asymmetric tail risk outweighs edge |
2. What Happened
The US-Japan rate differential hit 345 basis points this week. That is the largest gap in this cycle. When you borrow in the lowest-yielding G10 currency and invest in the highest-yielding, you earn 345 basis points of carry. That is why the yen carry trade is the most active in the world right now.
Friday’s 10-year yield move above 4.50% widened that gap further. Every basis point the Fed’s rate rises relative to BOJ’s policy makes the carry trade more profitable : and more dangerous. The profitability attracts more participants. More participants means more forced sellers when the unwind comes.
August 2024 showed exactly how fast it goes. The BOJ raised rates by a small amount. The yen carry trade unwound in days. Nikkei dropped sharply. Everyone who was long USDJPY or short JPY against other currencies took concentrated losses in a very compressed timeframe. That event is the template for what happens when this trade breaks.
Right now the carry is intact and dollar strength is the backdrop. USDJPY should be biased higher in that environment. But the tail risk is so asymmetric that directional trading in USDJPY is not the right call. You cannot size it appropriately when the downside scenario is a regime-shift event.
3. What the Alpha Insights Said
FX Focus : Post 11
USDJPY explicitly rated AVOID directional. The language is clear: asymmetric risk makes sizing uncomfortable. Carry analysis: 475bps differential (policy rate basis), most active carry globally. Exit risk growing as BOJ gradually tightens. Tail risk: August 2024-style unwind if BOJ accelerates. Support 151.00, resistance 157.00. No trade entry identified : stated position is avoidance.
Overwatch : Post 18
10-year at 4.50% is the master variable. The danger zone is 4.55%-4.65%. Above 4.65% the thesis breaks : and for USDJPY specifically, breaking the thesis means a potentially disorderly carry unwind. That scenario would see yen strengthen rapidly, USDJPY fall sharply, and Nikkei sold aggressively. Tail risk is not a technical level : it is a regime shift.
Macro Pulse : Post 01
Dollar bidding on rate repricing is the macro backdrop for USDJPY. DXY at 99.27 confirms US exceptionalism trade intact. But crude +4.20% creates stagflationary undertone that no central bank controls : including the BOJ. Rising energy import costs for Japan on top of the rate differential creates a complex multi-factor picture that doesn’t support clean directional positioning.
Global Grid : Post 06
Japan stance: mixed. Flow: yen carry dynamics (not clean inbound or outbound). Stress: moderate : BOJ divergence. USDJPY rated dollar bid but BOJ tail risk limits upside conviction. CHF safe-haven muted on Friday confirms orderly session, but does not remove the structural carry risk that builds week after week at 345bps differential.
Volatility Lens : Post 03
VIX floor shift from 14-16 to 17-20 is relevant for USDJPY carry. Elevated vol regime means intraday ranges are wider across all instruments. In a pair with asymmetric tail risk like USDJPY, wider ranges mean bigger losses if you are on the wrong side of an unwind event. The vol regime directly increases the cost of being wrong in a tail scenario.
4. Key Levels
| Level | Price | Significance |
|---|---|---|
| Range Floor | 151.00 | Below here : carry unwind pressure building |
| Range Ceiling | 157.00 | BOJ intervention risk at extreme yen weakness |
| 10Y Danger Zone | 4.65% | Above this : carry unwind accelerates, scenario C active |
| 10Y Current | 4.50%+ | Already at critical threshold : 15bps from danger zone |
| Rate Gap | 345bps | Largest in cycle : proportional unwind risk |
| BOJ Hike Trigger | Any surprise | August 2024 analogue : happened in days after small hike |
5. Signal + Bias
Signal: AVOID DIRECTIONAL. Not a short. Not a long. An active decision to pass on this trade.
Why avoid: The dollar is bid. USDJPY should be biased higher. But the tail risk of a carry unwind is not quantifiable in R:R terms. When it goes, it goes fast and stops get gapped. You cannot size for that asymmetry.
What you can do: If you must have yen exposure, monitor within the 151.00-157.00 range. Do not add positions near the 157.00 extreme : BOJ intervention risk is real at extreme yen weakness. Do not short yen near 151.00 : the downside on a carry unwind is rapid.
Better uses of capital: GBP short, crude long, NVDA. All three carry better risk profiles with more identifiable invalidation levels. Pass on USDJPY this week.
6. Next Week Setup
FOMC minutes Wednesday 14:00 ET is critical. Hawkish language pushes 10-year toward 4.55-4.60% and widens the BOJ-Fed gap further. That extends the carry trade : but also brings the 4.65% danger zone closer. Every basis point higher from here increases the tail risk proportionally.
Any BOJ communication is the highest-priority watch for this pair. Even language suggesting a faster tightening path than expected can trigger disproportionate yen moves. The August 2024 template: small BOJ surprise, large yen move, rapid unwind. The trigger does not need to be dramatic to produce a dramatic result.
If 10-year stabilises in the 4.40%-4.55% range, USDJPY likely remains in the 151.00-157.00 box. That’s not a trading opportunity : that’s a range with no directional edge and meaningful tail risk on both sides. Patience is the position.
If conditions change : BOJ credibly signals pause on tightening, or 10-year falls back below 4.40% : revisit. Until then, USDJPY is the pair you watch, not the one you trade.
7. Risk Score
Around 75%
Highest risk score of any instrument reviewed this week. The 345bps carry gap is the largest in the cycle. The 10-year is 15 basis points from the danger zone that historically triggers unwind events. The August 2024 analogue shows the speed at which this can move. No directional position recommended. The risk score reflects what happens to anyone caught on the wrong side of a sudden BOJ action or 10-year spike : not the probability of a normal session.
Friday 15 May 2026
USD/JPY — Daily Read | Friday 15 May 2026
Post-CPI close | 158.15 — intervention watch zone, Nikkei tailwind | Not financial advice
WHAT CHANGED FROM YESTERDAY
Yesterday USD/JPY was tracking the dollar bid from CPI confirmation, pushing toward 158 as DXY strengthened. The close at 158.15 represents a significant level: it is high enough to be a Nikkei tailwind (Japanese export earnings translated into more yen) but also close enough to 160 to raise Bank of Japan intervention risk. What changed from Thursday’s session is that the yen weakness is now a confirmed part of the post-CPI dollar narrative. The Bank of Japan’s policy divergence from the Fed — still holding rates near zero while the Fed considers cuts — is now more starkly expressed in the exchange rate. USD/JPY at 158 tells you exactly how wide that policy gap is at this moment.
HEADLINE STATE: ELEVATED — Dollar Bid Intact, Intervention Risk Grows Above 159
USD/JPY at 158.15 is doing two things simultaneously: it is providing Nikkei with a mechanical export tailwind (one of the reasons Nikkei is at 63,355 and part of the 8/3/1 global grid), and it is drawing attention from the Bank of Japan, which has previously intervened to defend yen levels. The 160 level is the widely-watched threshold. Friday’s US Retail Sales data could push USD/JPY in either direction: strong data extends the dollar bid (toward 159+, increasing intervention risk), weak data lets the dollar settle (159 becomes a ceiling, 157 becomes support). The key question is whether the yen weakness is a mechanical post-CPI move or a structural shift in the rate differential.
Key Levels
| Level | Price | Significance |
|---|---|---|
| Thursday close | 158.15 | Post-CPI dollar bid — near multi-month highs |
| Intervention threshold | 160.00 | BoJ verbal or actual intervention risk — Nikkei tail risk |
| Strong RS upside | 158.80–159.50 | Dollar extended further — intervention risk window opens |
| Weak RS / dollar fades | 157.00–157.80 | Short-covering completes — yen finds temporary floor |
| Nikkei tailwind floor | 155.00 | Below here Nikkei export tailwind weakens materially |
| Rate differential | Wide | Fed on cut path, BoJ on hold — structural yen weakness remains |
Structure · Momentum · Flow
Structure
Rising USD/JPY (weakening yen). The rate differential between Fed and BoJ is the structural driver. That differential widened this week as the Fed’s rate-cut path was confirmed. Structure remains yen-weak as long as BoJ stays on hold.
Momentum
Positive (USD/JPY higher) but approaching a ceiling near 160 where intervention risk dominates. Momentum above 159 becomes unstable. Below 158 it is steady.
Flow
Carry trade flows favour yen weakness. Global risk-on = borrow yen, buy higher-yielding assets. The 8/3/1 grid confirms the risk-on environment. As long as that holds, carry trade mechanics keep USD/JPY elevated.
| Bias | LONG USD/JPY — but 160 is the ceiling to respect |
| Risk estimate | Around 40% — intervention risk is asymmetric and sudden |
| Key watch | 160 — BoJ intervention threshold. Do not be long above this level. |
| Nikkei link | USD/JPY 155+ = Nikkei export tailwind remains active |
| Week carry | Rate differential remains wide — structural yen weakness continues |
This content is for educational and informational purposes only and does not constitute financial advice. Past analysis does not guarantee future results. Always conduct your own research before making any trading decisions.
Thursday 14 May 2026
USD/JPY — Daily Read | Thursday 14 May 2026
Post-CPI mid-session | Dollar bid extends the counter-trend long | Not financial advice
WHAT CHANGED FROM YESTERDAY
Yesterday USD/JPY was the most cautious setup in the book — counter-trend long in a macro short environment. The analysis was explicit: “any long here is a scalp inside a downtrend.” Today the CPI dollar bid has moved the pair to 158.15 (+0.30%). The counter-trend bounce has materialised — the setup that was described as “scalp only” delivered exactly what a scalp should deliver. The macro short read remains: USD/JPY is still operating within a bigger-picture declining structure. The bounce played. Now the question is whether to stay or step away.
HEADLINE STATE: COUNTER-TREND BOUNCE PLAYED — Still Macro Short
USD/JPY is at 158.15. The counter-trend bounce that was flagged as a short-lived scalp opportunity has run. The CPI dollar bid provided the catalyst. But nothing has changed about the bigger picture: the macro direction is weak short. 158.15 is not a breakout of the macro downtrend — it is a bounce within it. Scalp traders should be considering exits or stops. Macro traders who are short should see this as the classic “bounce to the short entry zone.”
Key Levels
| Level | Price | Significance |
|---|---|---|
| Current price | 158.15 | +0.30% — counter-trend bounce playing out |
| Macro direction | Weak short | Still intact — this bounce does not break the macro picture |
| DXY | 98.79 (+0.31%) | Dollar bid driving the USD/JPY move — external catalyst |
| Scalp trade status | Played — consider exits | Short hold time, the bounce target zone reached |
| Nikkei impact | Positive | Yen weakness is a tailwind for Japanese equities Friday |
Structure · Momentum · Flow
Structure
Macro structure is still declining. Today’s bounce is within the downtrend. Structure has not reversed — price has found a temporary level of support from the CPI dollar bid. When the dollar bid fades, the downtrend pressure resumes.
Momentum
Short-term momentum is positive — the bounce is real. But it is borrowed from the dollar bid, not from a structural change in the JPY demand picture. When the CPI reaction fades, so does this momentum.
Flow
DXY driving USD/JPY higher. This is not a Japan-specific story — it is a dollar story. The macro short thesis for USD/JPY (JPY strengthening into a BoJ policy shift environment) has not changed.
TODAY’S BIAS: EXITS ON SCALP LONGS — Macro Short Setup Building at Higher Levels
If you took the counter-trend scalp long from the setup described yesterday, 158.15 is the area to consider exits or at minimum to trail stops tight. The macro short read is unchanged. Higher prices from the CPI bounce are simply a better entry for the macro short, not a reason to hold longs further. Disciplined scalpers get out. Macro traders get interested in shorts at these levels.
Risk: Around 50%
This is not a clean trade in either direction right now. Longs are running out of road in the macro context. Shorts are fighting the dollar bid. The 50% risk score reflects genuine uncertainty about near-term direction. Clear signals come when the dollar bid either accelerates (extends the bounce) or fades (resumes the macro short).
By Experience Level
New to this
Yesterday’s analysis was explicit that any long in USD/JPY is a short-term trade only — counter-trend means you are swimming against the macro. Those who heeded that and kept their hold time tight are sitting on a profit. Those who treated it as a full position are now exposed to the macro short reasserting.
Developing
USD/JPY is the BoJ vs Fed story. The macro short thesis is: BoJ is tightening (slowly) while Fed is pausing or cutting. That differential compresses the interest rate advantage that drove USD/JPY up for years. CPI day bounces do not change that multi-month story.
Experienced
158.15 is worth watching as a potential short entry zone for the macro trade. If dollar strength fades into the NY afternoon and USD/JPY gives back the CPI bounce, that is the signal the macro short has resumed. A rejection at 158.5-159.0 with a sharp reversal is the clean macro short entry pattern.
This is a daily analysis read for educational and informational purposes only. Nothing here is financial advice. Past performance is not a guide to future results. Trading carries significant risk of loss. Always apply your own risk management.
Wednesday 13 May 2026
USD/JPY — Daily Framework Read | Wednesday 13 May 2026
analysis as of pre-market | CPI 3.8% shock context | Not financial advice
HEADLINE STATE: COUNTER-TREND LONG — Macro is Weak SHORT. Quick In, Quick Out.
This is the most cautious setup of the day. Any long in USD/JPY today is explicitly against the macro direction — the framework’s bigger picture read is weak short. If you take a long here, you are trading a short-term bounce inside a downtrend. That changes everything: target size is smaller, hold time is shorter, and you must be ruthless about stopping out. This is a scalp opportunity if the setup prints — not a trend position. DXY’s bearish bias adds headwind to any USD/JPY long.
Key Context
| Reference | Note |
|---|---|
| Macro direction | Weak SHORT — bigger picture bearish |
| Short-term opportunity | Counter-trend bounce potential only |
| DXY context | DXY 97.5–98.5, bearish — headwind for USDJPY longs |
| Trade type | Scalp only — not a trend position |
| Hold time | Short — exit before the macro reasserts |
Structure · Momentum · Flow
Structure
Macro structure is bearish for USD/JPY. The bigger picture has the pair in a downtrend. Any upward move is a counter-trend bounce — useful for scalps, dangerous to hold. Structure confirms the short direction as the dominant trend.
Momentum
Short-term momentum may be bouncing — that is the scalp opportunity. But macro momentum is weak short. Do not mistake a bounce in momentum for a reversal. The dominant direction needs time and evidence to change, not just one session of relief.
Flow
DXY in a 97.5–98.5 range with a downward bias means USD broadly weak. USD/JPY longs are directly fighting this flow. CPI 3.8% creates a short-term USD bounce narrative (hawkish Fed signal) — but structurally, the dollar’s trend is down. JPY carry unwind dynamics remain in play.
Long Case vs Short Case
LONG CASE (scalp only)
- CPI 3.8% — short-term hawkish Fed signal supports USD
- Counter-trend bounce can be sharp and fast
- Short-term setup may offer a quick intraday move
- Valid only as a scalp — take profits early and walk away
- Must exit before macro reasserts the downtrend
SHORT CASE (macro aligned)
- Macro direction is weak short — this is the primary trend
- DXY bearish bias = structural USD weakness
- Short is the macro-aligned trade — higher probability with patience
- Wait for the counter-trend bounce to exhaust, then short
- Better entry is after the bounce, not during
Sizing Guidance
If taking the counter-trend long: half position maximum, tight target, no holding overnight. This is a short-term play against the macro. The risk is not just your stop — the macro direction is working against you the entire time you hold. Get in, take your profit at the nearest resistance, and close.
Preferred approach for most traders: wait for the short setup to set up on the macro timeframe. The macro-aligned trade has far better risk management characteristics.
Tuesday 12 May 2026
Daily Framework Read · Tuesday 12 May 2026
Dollar-Yen (USDJPY) — Daily Framework Read | Tuesday 12 May 2026
Published pre-market · Time-gated member content
Current State
LONG — 50% Confidence (Counter-Trend)
62% long bias. Macro picture is bearish — this is a tactical pullback long inside a downtrend. Quick entry, quick exit mentality only.
Key Levels
| Level | Price | Notes |
|---|---|---|
| Entry | 156.575 | Pullback bounce level |
| Stop Loss | 156.990 | Above pullback high |
| Target 1 | 155.883 | Next short-term support |
| Risk:Reward | 1.67R | Reduced R:R reflects counter-trend risk |
Structure Read
USDJPY is in a macro downtrend — the bigger-picture structural sequence points lower. Within that downtrend, price has pulled back to a level where a short-term bounce is technically feasible. This is not a trend-following trade; it is an attempt to capture a temporary counter-move inside a larger bearish structure. Counter-trend trades carry higher failure rates by definition.
Momentum Read
Short-term momentum shows enough of a pause in the bearish pressure to justify watching for a tactical bounce. The macro momentum, however, remains weak in the direction that matters for the bigger picture. This is exactly the kind of setup where you cap your holding time — get in at the trigger, hit T1, and don’t overstay.
Volume & Flow Read
The macro flow picture is weak for the dollar against the yen — the structural positioning read confirms bearish bias at the larger level. The short-term bounce setup exists only because selling pressure has temporarily abated at the pullback zone. That’s a tactical window, not a trend reversal signal.
The Verdict
This is a counter-trend tactical trade and it needs to be treated like one. Macro is pointing down — you’re buying a pullback against that. The approach here is simple: quick in, quick out. Hit T1 at 155.883 and close the position. Do not hold through T1 hoping for more; the macro trend will reassert itself and overstaying a counter-trend bounce is how manageable losses become large ones. Size it smaller than a trend-following trade, respect the 1.67R, and don’t upgrade the narrative mid-trade.
Long Case vs Short Case
62%
Short-term pullback bounce. Selling pressure paused at this level.
38%
Macro structure pointing lower. Counter-trend bounce may fail quickly.
Position Sizing Guidance
Counter-trend trades warrant reduced size — 0.5% to 0.75% of account maximum. The 1.67R is less favourable than the typical 2R minimum, which already signals this is a lower-grade opportunity. Entry at 156.575, stop at 156.990 (0.415 points risk), T1 at 155.883. Close the full position at T1. This is not a scale-out trade.
This content is for educational and informational purposes only. Nothing here constitutes financial advice or a recommendation to buy or sell any instrument. Trading involves substantial risk of loss. Past performance is not indicative of future results. Always conduct your own due diligence and manage risk appropriately.
Tuesday 5 May 2026
USD/JPY — Daily Framework Read | Tuesday 5 May 2026
USD/JPY | Tuesday Open Daily Read | Data basis: Monday 4 May 2026 close
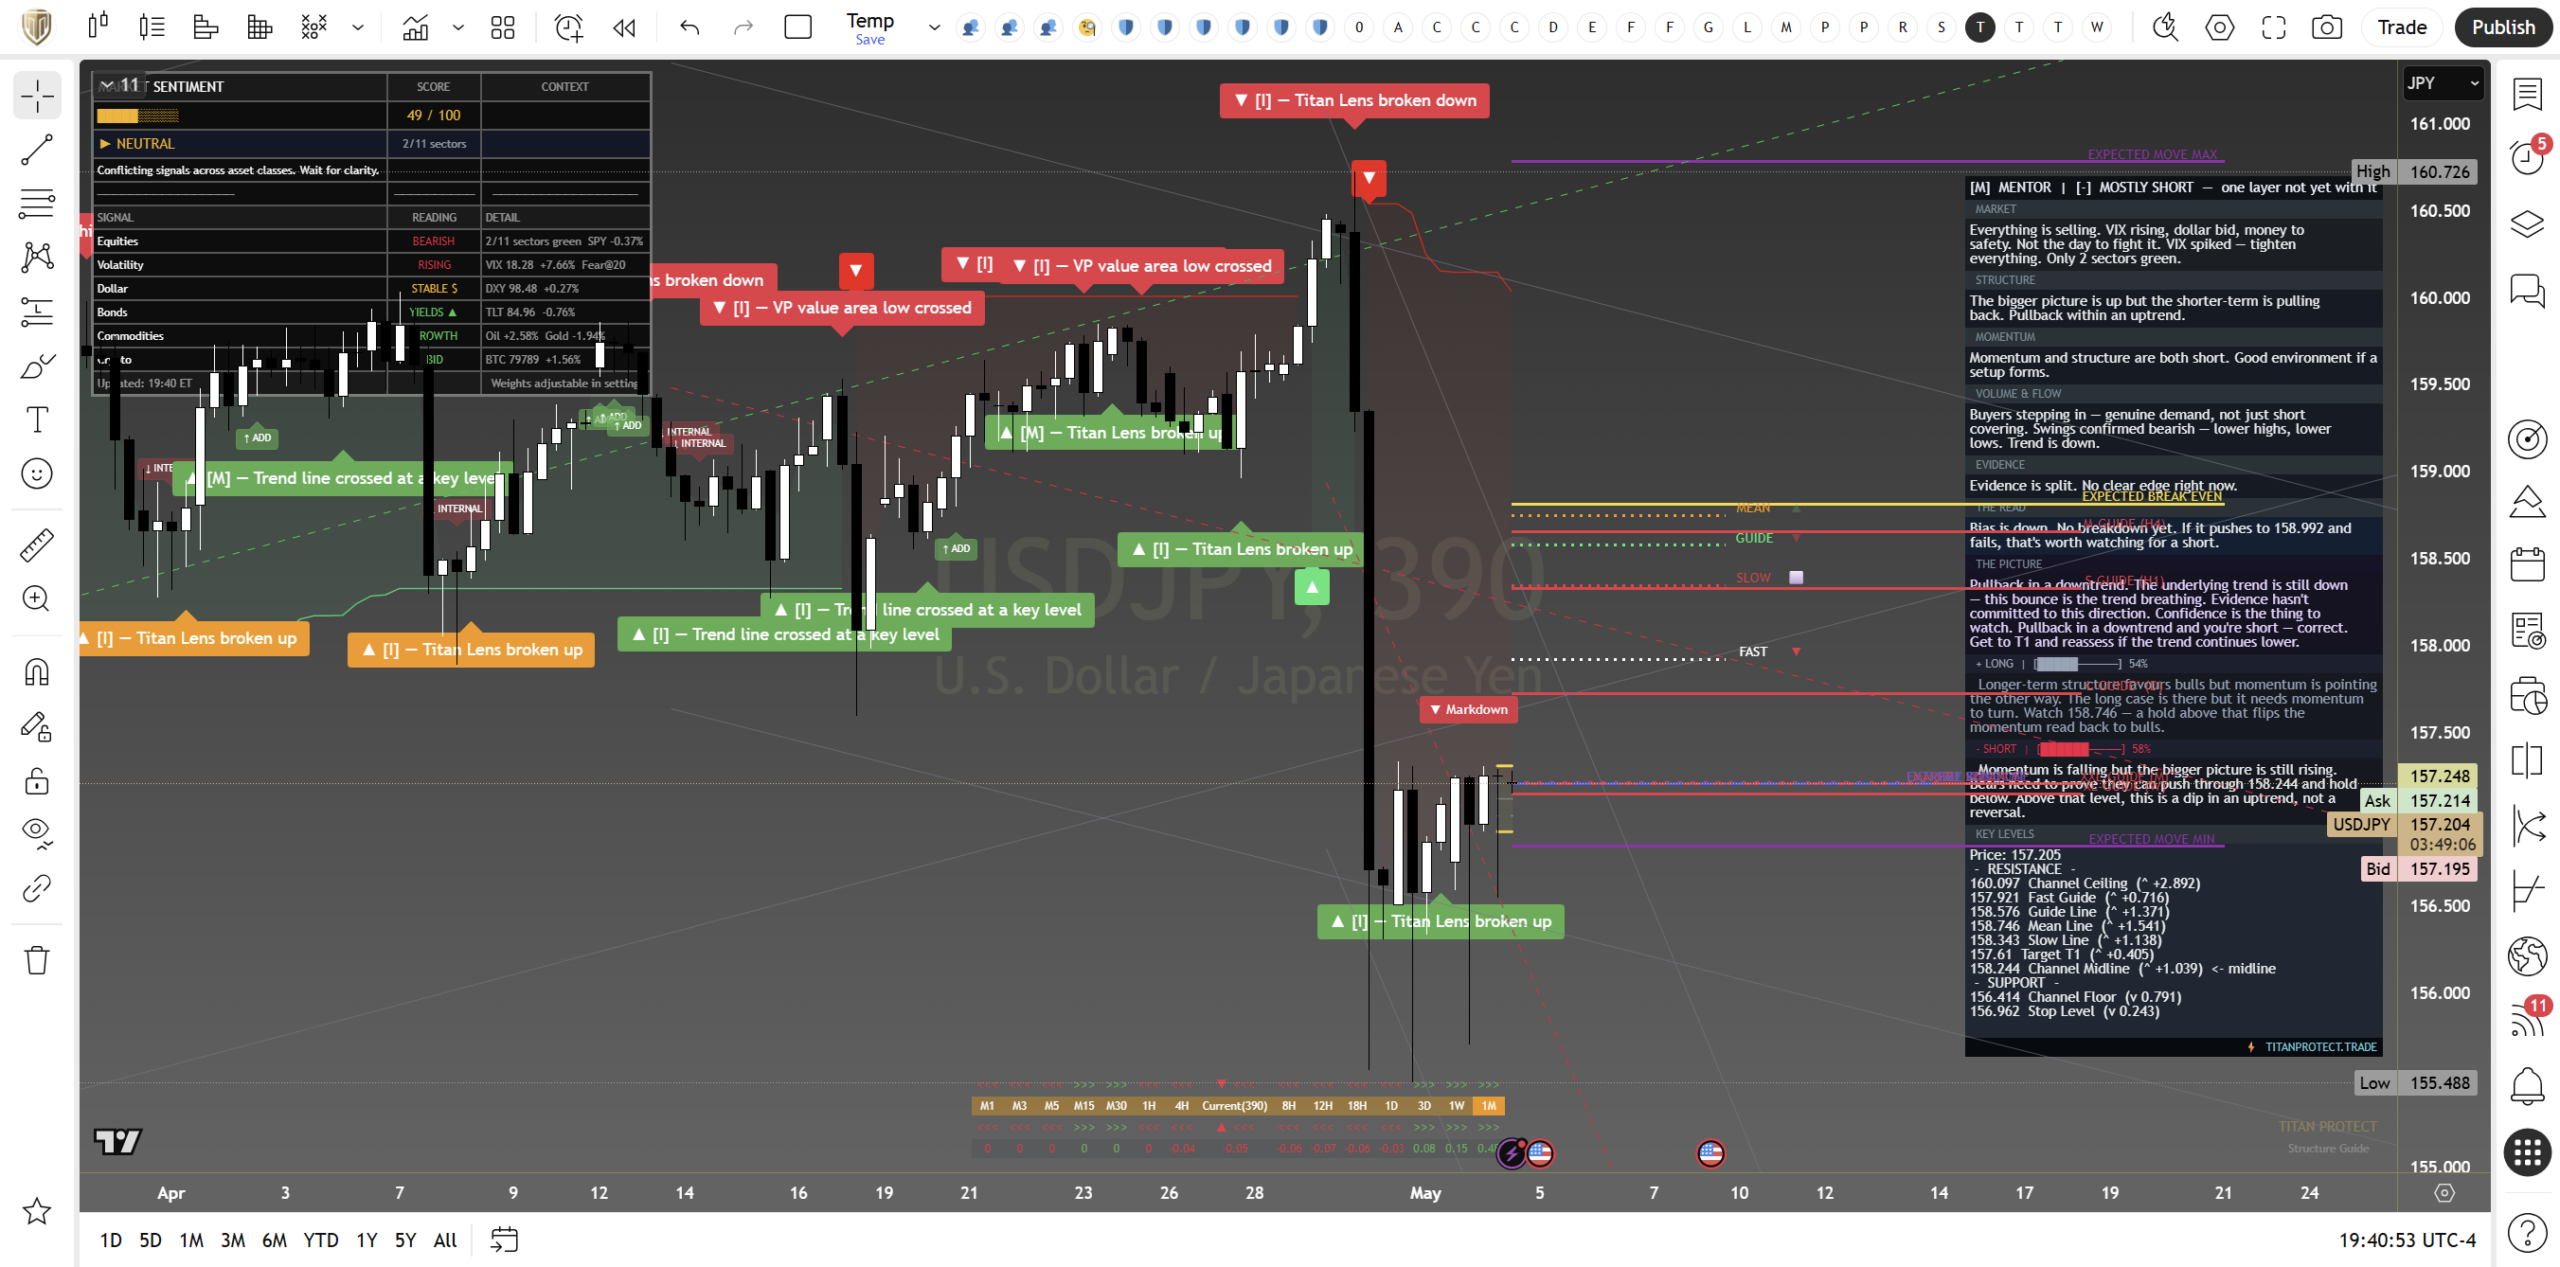
Where It Sits
Yesterday vs Today
| Metric | Monday open read | Tuesday open read | Change |
|---|---|---|---|
| Close | 157.03 | 157.20 | +0.17 (+0.11%) |
| Daily range | 155.67 – 157.30 (1.63 wide) | 157.10 – 157.27 (0.17 wide) | Compression |
| Structure | Recovered from intraday low, closed near highs | Inside day, held above prior close | Confirming higher |
| Conviction | Constructive but tested | Constructive with cleaner profile | Firming |
| Bias | Long with caution | Long with caution | Maintained |
Yesterday’s read was continuation only on the cleanest setups given the proximity to known intervention levels. Monday confirmed it. Price held above the prior close, the range compressed sharply from Sunday’s wide print, and the pair printed a quiet inside day. Confirmed in tone, not in scale. The kind of session that consolidates a trend rather than extends it.
Structure
The pair remains in a clear multi-week uptrend on daily and weekly timeframes, with higher highs and higher lows since the early-April pivot. The 20-day moving average is rising and price has not threatened it for fourteen sessions. Monday’s inside day printed entirely above Friday’s close, which compresses ahead of a directional resolution rather than reverses it.
The 4-hour adds nuance. Monday compressed into a seventeen pip range between 157.10 and 157.27, unusually narrow for this pair. Compression of this scale typically resolves directionally inside twenty-four to forty-eight hours. The structural lean favours upside but 158 caps how far that resolution can run before institutional supply enters.
Momentum
Momentum reads supportive but flattening. The advance from the early-April lows has been orderly, and the past five sessions have rolled the slope from accelerating to neutral. Internal readings sit in the upper half of their range, the profile that supports controlled continuation rather than vertical extension. The flattening is the tell. The trend is intact but the easy money has been priced in. The next leg needs a fresh catalyst, not inertia.
Volume and Flow
FX flow shows sustained dollar buying through the past two weeks with the yen-side quiet rather than distributed. No obvious yen accumulation on the demand side, which historically precedes intervention. The pattern is trend continuation in low ambient volatility, not exhaustion. The Bank of Japan has been verbally absent since late April. Each session of silence at these levels shortens the runway before officials feel compelled to speak.
Key Levels
| Level | Type | Significance | Action Zone |
|---|---|---|---|
| 158.00 | Resistance | Round number, historical verbal intervention zone | Take profits or fade if rejected with weight |
| 157.50 | Pivot | Recent swing high cluster, stop-run zone | Reclaim above with conviction confirms continuation |
| 157.20 | Monday close | Reference anchor for Tuesday open | Bias line for the session |
| 156.80 | Support | Inside-day low cluster, shallow pullback target | Buy zone with defined stop on tested hold |
| 156.20 | Major support | Two-week range floor, structural decision point | Stop-out below for longs, break invalidates the trend read |
Three Scenarios Into Tuesday Open
Continuation
Pair opens firm in Asia, holds 157.20, takes 157.50 cleanly into London, runs toward 158.00 round number by NY. USD strength persists into the new week. Watch for verbal headlines as price approaches 158. That is the line in the sand.
Range
Pair opens flat, churns 156.80 to 157.50 through the session. Magnet to Monday close. Range trade as the market waits for catalyst before committing toward intervention. Most probable given the inside-day compression.
Mean Reversion
Pair opens weak on overnight headlines or risk-off shift, fades to 156.80 support and tests 156.20. Sharp moves are typical of pairs near intervention zones. The tail risk lives here.
Risk Score
Risk sits at Around 60% heading into Tuesday open.
Risk is elevated by the proximity to the 158 zone, historically a level where Japanese officials begin verbal intervention. The trend is clearly higher but the asymmetry of new longs is shifting as the pair grinds toward institutional resistance. The 40 percent relief reflects the higher-timeframe uptrend remaining intact, the 156.20 floor holding, and Monday’s inside-day compression resolving constructively. Standard size with tight stops and the awareness that intervention can move the pair one hundred pips in a single session.
How to Walk It
Entry, stop and target structure:
- Long 156.80 to 157.00 pullback | Stop 156.50 | Target 157.80 | R:R 2.6:1
- Long 157.55 breakout reclaim | Stop 157.10 | Target 158.00 | R:R 1:1 (asymmetric, tight)
- Short 158.10 plus rejection at the intervention shelf | Stop 158.40 | Target 156.80 | R:R 4.3:1
Experience-level guidance:
Beginner. The trend is up, the range is tight, and the resistance is well-defined. That setup rewards patience over conviction. Trade only the cleanest entry above. If price opens against your bias, do nothing. Let the first hour print before committing.
Intermediate. The asymmetric trade is short 158.10 plus on rejection rather than long the breakout. The breakout has a one-to-one ceiling at 158, the rejection has 130 pips down to support. Take half off at 157.50 and trail the rest. On longs, scale out at 157.80 rather than chase the round number.
Advanced. Vol on yen pairs has compressed alongside the spot range. Defined-risk option structures around 158.00 capture the intervention asymmetry without the tail risk of holding spot through a headline. Sized at half a percent of book per leg.
This analysis is for educational and informational purposes only. It does not constitute financial advice. Always manage your risk independently and in accordance with your own financial circumstances.
Continue with Titan Protect
Twenty-plus instruments. One framework.
We read more than twenty instruments daily across four sessions. The framework’s sunrise call landed across the day — the Pre-NY case study shows what the lines drew, what New York did, and where the read stands.
Core
£59/mo
Indicator suite plus daily framework reads.
Edge Popular
£109/mo
Core plus Shield dashboard and member-only briefs.
Elite
£179/mo
Edge plus weekly 1:1 call and early access to new tools.
Save 15% on annual billing
Want to see the framework in action? Free Explorer tier — no card required.
Join the live community: Discord channel · Shield dashboard
Education, not financial advice. Trade your own analysis.
Sunday 3 May 2026
USD/JPY — Daily Framework Read | Sunday 3 May 2026
USD/JPY | Monday Open Framework Read | Data basis: Friday 1 May 2026 close
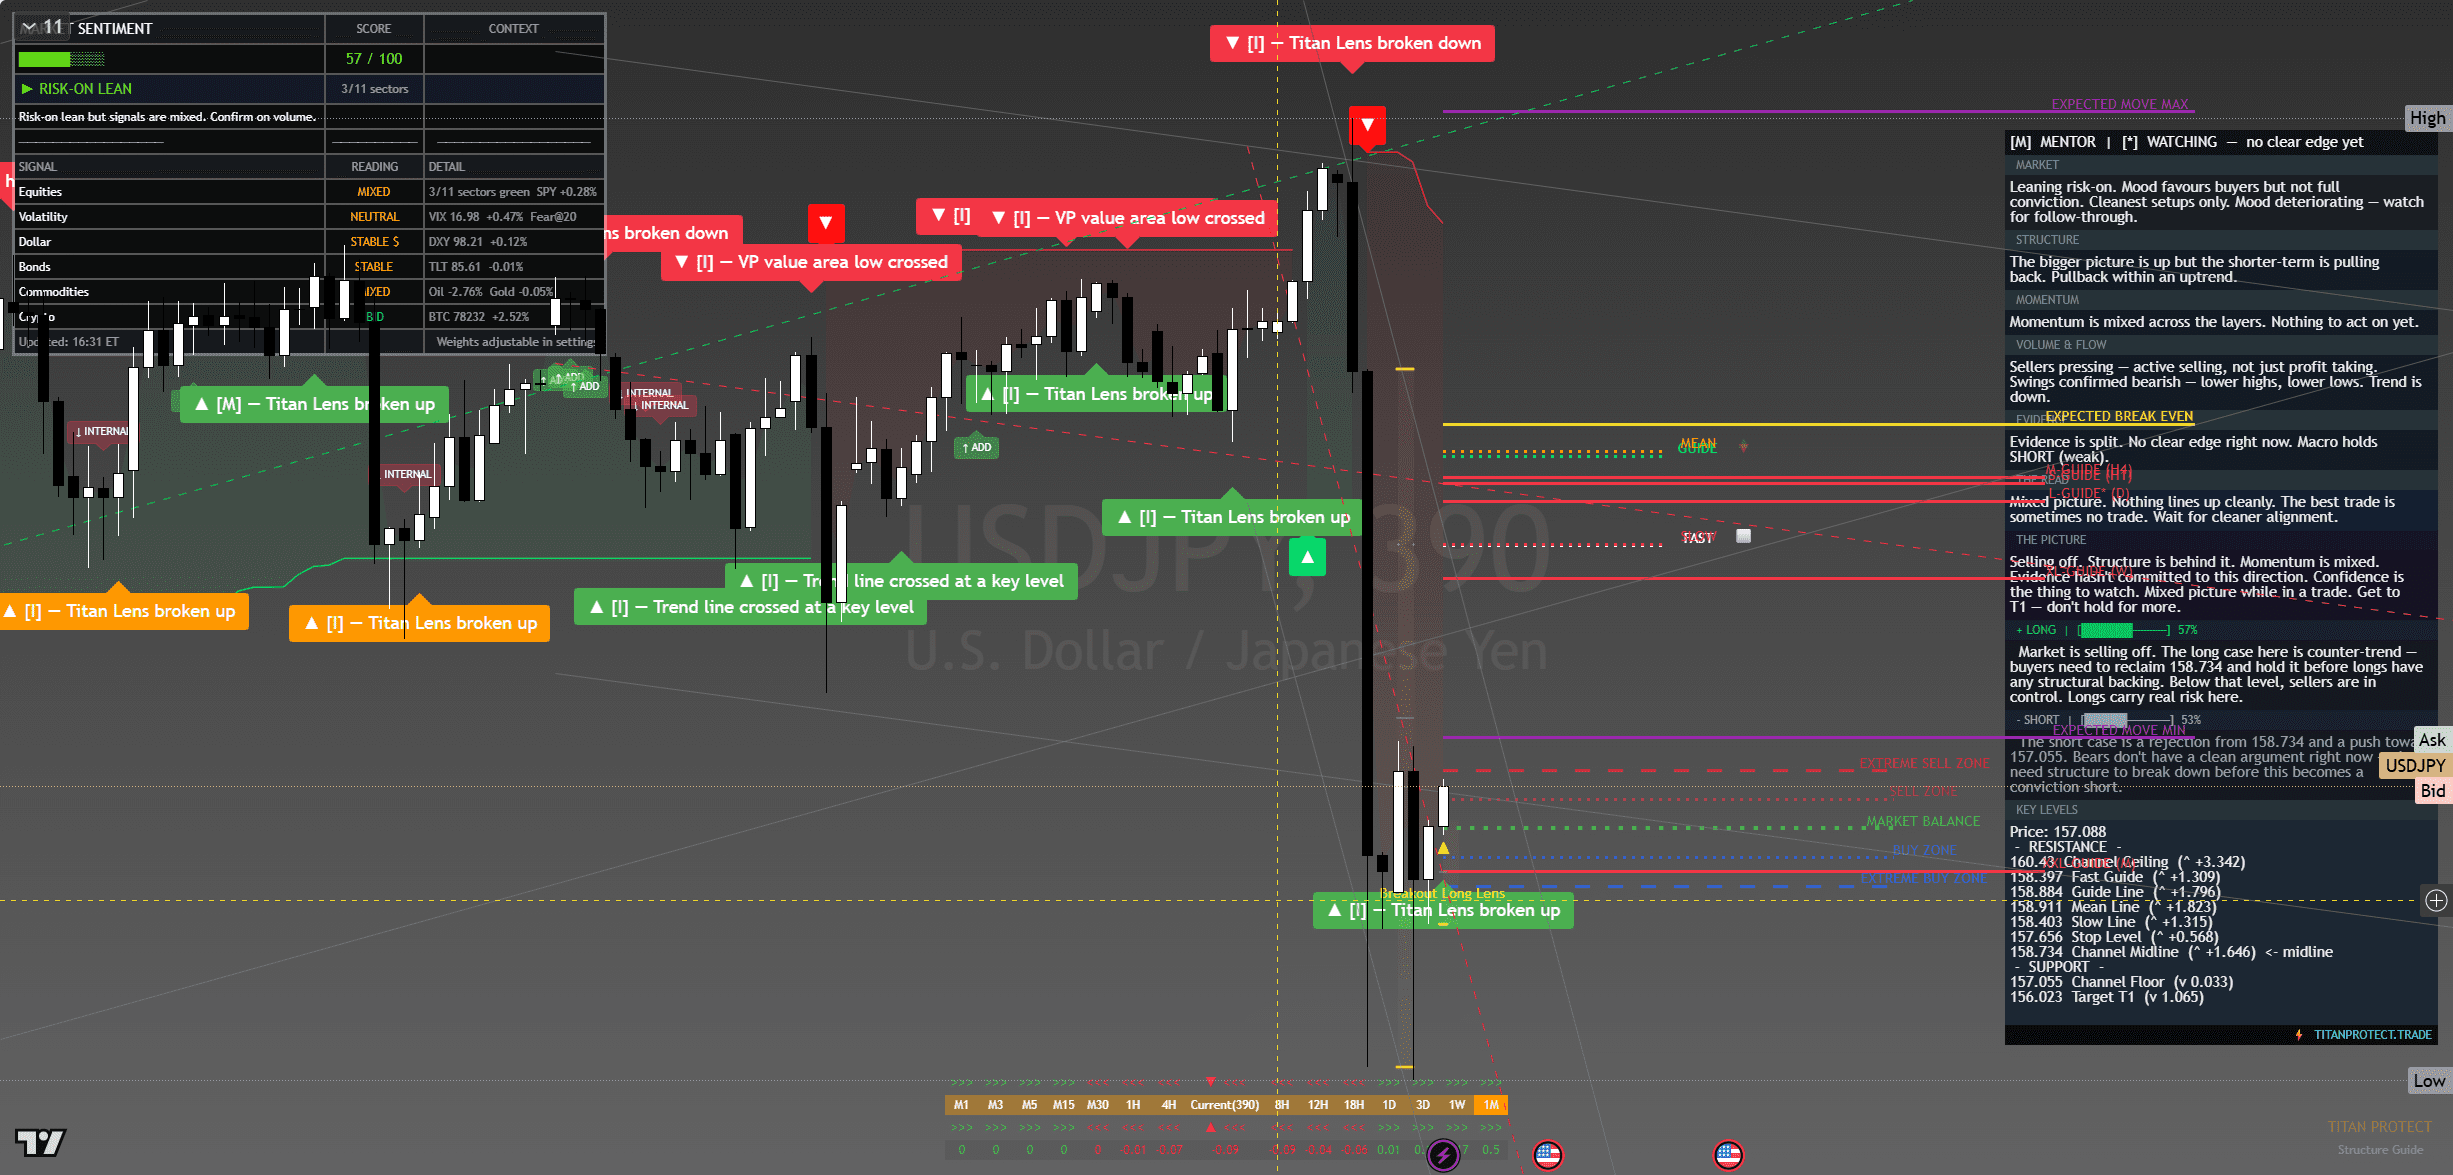
USD/JPY — chart with framework overlay. The Lens annotations show structural breaks, reversal triggers and confluence zones at the levels referenced below.
Where It Sits
Structure
Structurally the pair is in a clear uptrend on daily and 4-hour timeframes with higher highs and higher lows. Friday’s close sits in the upper third of the recent range, holding above the rising 20-day MA. The structure is firm but approaching a known resistance zone.
Momentum
Momentum is supportive but not extended. The advance has been orderly with no parabolic finish. Internal momentum readings sit in the upper half of their range — that is the kind of momentum profile that supports a controlled push toward 154 rather than a vertical run.
Volume & Flow
FX flow has shown sustained dollar buying through the past two weeks. The yen side has been quiet — no obvious distribution, just steady offer. The pattern is one of trend continuation, not exhaustion.
Key Levels
| Level | Type | Significance | Action Zone |
|---|---|---|---|
| 154.00 | Resistance | Round number, BoJ intervention zone | Take profits / fade if rejected |
| 153.50 | Pivot | Recent swing high cluster | Hold above = bullish bias |
| 153.20 | Friday close | Reference anchor | Bias line for Monday open |
| 152.50 | Support | Recent breakout retest level | Buy zone with defined stop |
| 151.80 | Major support | Prior congestion floor | Stop-out below for longs |
Three Scenarios Into Monday Open
Continuation
Pair opens firm in Asia, holds 153.20, takes 153.50 cleanly in London, runs to 154.00 round number by NY. USD strength persists. Watch BoJ rhetoric near 154 as the line in the sand.
Range
Pair opens flat, churns 152.80-153.50 through the session. Magnet to Friday close. Range trade on yen-side intervention risk.
Mean Reversion
Pair opens weak on BoJ jawbone or risk-off shift, fades to 152.50 support. Sharp moves typical of pairs near intervention zones.
Risk Score
Risk sits at Around 60% heading into Monday open.
Risk is elevated by the proximity to the 154 zone — historically a level where Japanese officials begin verbal intervention. The structural trend is up but the asymmetry of the trade is shifting against new longs as the pair approaches institutional resistance. Standard size with tight stops and an awareness that intervention can move the pair 100+ pips in a single session.
How to Walk It
Entry / Stop / Target structure:
- Long 152.70-152.90 pullback | Stop 152.40 | Target 153.50 | R:R 2:1
- Long 153.55 breakout | Stop 153.20 | Target 154.00 | R:R 1.3:1
- Short 154.20+ rejection | Stop 154.50 | Target 153.20 | R:R 3:1
Experience-level guidance:
Beginner: The Monday open after a Friday record close is exactly the situation where over-confidence costs money. Reduce size to half your standard. Trade only the cleanest setup from the entries above. If the tape opens against your bias, do nothing — wait for the second hour, when the institutional flow has tipped its hand.
Intermediate: Use the levels table to define the trading range. Fade the extremes with defined stops, take profits before the round-number resistance levels. Do not carry directional positions through the day if you cannot watch the tape — Monday opens are prone to fast reversals.
Advanced: The vol regime is supportive of trending moves. Defined-risk options structures around the key pivot levels capture the asymmetry cleanly. Keep notional small relative to your book — Monday after a record-close week is asymmetric speculation, not core positioning.
The Sunday Composite — How This Read Sits Inside The Cross-Asset View
This single-instrument framework read is one slice of the larger Sunday weekend synthesis. The composite takes positioning, macro, sentiment, volatility, sector dispersion and trade structure as separate analytical layers and arrives at a unified composite verdict for Monday open. Each layer below is unpacked in full.
Read the full composite for the cross-asset context driving this instrument:
The institutional positioning split — Asset Managers vs Leveraged Funds in size
PCE clearance and the macro case for Monday’s carry
The three-layer sentiment disagreement — surface greed, retail neutral, professionals hedged
The vol curve term structure and what VVIX is signalling
Sector dispersion and the breadth problem behind the record close
The Monday position-management playbook — sizing tiers and trade plans
Sunday Overwatch — the unified composite verdict
Continue Reading
The macro frame driving this read is unpacked in the weekend briefs:
Sunday Setup — Reading The Tape Into Monday Open
PCE Cleared, VIX Crushed, SPY Closed 720 — Friday Post-Close Recap
This analysis is for educational and informational purposes only. It does not constitute financial advice. Always manage your risk independently and in accordance with your own financial circumstances.