The Nikkei225 Framework Journal for May 2026, newest read at the top. Each dated entry is our read on the close, kept as a living record so the framework can be judged over time. This is analysis, not financial advice.
Saturday 30 May 2026
Nikkei 225 — Daily Read | Saturday 30 May 2026
Nikkei 225 | Post Close Setup Daily Read | Data basis: 2026-05-30 close
Where It Sits
Structure
Structurally Nikkei 225 sits above its short-term moving averages with the daily trend firmly higher. The recent advance has been orderly with no signs of distribution or topping behaviour. The reference anchor at 64,693 acts as the bias line.
Momentum
Momentum is neutral with internal readings near the centre of the range. That is the signature of a market digesting the prior move. The tape needs a fresh catalyst to commit to direction.
Volume & Flow
Flow on the session close was measured. Positioning data suggests steady accumulation rather than aggressive directional commitment. The pattern supports continuation rather than reversal.
Key Levels
| Level | Type | Significance | Action Zone |
|---|---|---|---|
| 66,630 | Resistance | Upper range target, prior supply zone | Take profits / fade if rejected |
| 65,340 | Pivot | Mid-range continuation marker | Hold = constructive; lose = consolidation |
| 64,693 | Session close | Reference anchor for next session | Above = continuation; below = mean revert |
| 63,660 | Support | Recent range floor, demand zone | Buy zone with defined stop |
| 62,370 | Major support | Prior breakout retest level | Stop-out below for longs |
Three Scenarios
Continuation
Nikkei 225 holds above the session close at 64,693 and extends higher on continued institutional flow. The vol regime supports trending moves and the path of least resistance remains up. Watch for a clean hold above the pivot level to confirm.
Range
Nikkei 225 opens flat and churns around the 64,693 level. Magnet to the prior close. The tape needs a fresh catalyst to commit. Range trade with defined stops.
Mean Reversion
Nikkei 225 opens firm but meets supply at the pivot, fades back below 64,693. Failed breakout pattern. Not the base case but worth size discipline if volatility expands.
Risk Score
Risk sits at Around 55%
Risk sits around 55 per cent. Vix at 15.4 supports a measured risk posture. sentiment at 61 is in greed territory. Index-level positions carry concentration risk in the leading names. Standard sizing with defined stops — discipline beats conviction.
How to Walk It
Entry / Stop / Target structure:
- Long 63,660 pullback | Stop 62,370 | Target 65,340 | R:R 2:1
- Long 65,340 breakout | Stop 64,693 | Target 66,630 | R:R 1.5:1
- Fade 66,630 rejection | Stop above resistance | Target 64,693 | R:R 2:1
Experience-level guidance:
Beginner: Reduce size to half your standard. Trade only the cleanest setup from the entries above. If the tape opens against your bias, do nothing — wait for the second hour, when the institutional flow has tipped its hand.
Intermediate: Use the levels table to define the trading range. Fade the extremes with defined stops, take profits before the round-number resistance levels.
Advanced: The vol regime supports defined-risk structures around the key pivot levels. Keep notional small relative to your book — asymmetric speculation, not core positioning.
Continue Reading
The macro frame driving this read is unpacked in the session briefs:
Check the latest session briefs on the site.
This analysis is for educational and informational purposes only. It does not constitute financial advice. Always manage your risk independently and in accordance with your own financial circumstances.
Thursday 28 May 2026
Nikkei 225 — Daily Framework Read | Thursday 28 May 2026
Nikkei 225 | Post Close Setup Daily Read | Data basis: 2026-05-28 close
Where It Sits
Structure
Structurally Nikkei 225 sits above its short-term moving averages with the daily trend firmly higher. The recent advance has been orderly with no signs of distribution or topping behaviour. The reference anchor at 64,999 acts as the bias line.
Momentum
Momentum is neutral with internal readings near the centre of the range. That is the signature of a market digesting the prior move. The tape needs a fresh catalyst to commit to direction.
Volume & Flow
Flow on the session close was measured. Positioning data suggests steady accumulation rather than aggressive directional commitment. The pattern supports continuation rather than reversal.
Key Levels
| Level | Type | Significance | Action Zone |
|---|---|---|---|
| 67,140 | Resistance | Upper range target, prior supply zone | Take profits / fade if rejected |
| 65,710 | Pivot | Mid-range continuation marker | Hold = constructive; lose = consolidation |
| 64,999 | Session close | Reference anchor for next session | Above = continuation; below = mean revert |
| 63,860 | Support | Recent range floor, demand zone | Buy zone with defined stop |
| 62,430 | Major support | Prior breakout retest level | Stop-out below for longs |
Three Scenarios
Continuation
Nikkei 225 holds above the session close at 64,999 and extends higher on continued institutional flow. The vol regime supports trending moves and the path of least resistance remains up. Watch for a clean hold above the pivot level to confirm.
Range
Nikkei 225 opens flat and churns around the 64,999 level. Magnet to the prior close. The tape needs a fresh catalyst to commit. Range trade with defined stops.
Mean Reversion
Nikkei 225 opens firm but meets supply at the pivot, fades back below 64,999. Failed breakout pattern. Not the base case but worth size discipline if volatility expands.
Risk Score
Risk sits at Around 55%
Risk sits around 55 per cent. Vix at 15.7 supports a measured risk posture. sentiment at 60 is in greed territory. Index-level positions carry concentration risk in the leading names. Standard sizing with defined stops — discipline beats conviction.
How to Walk It
Entry / Stop / Target structure:
- Long 63,860 pullback | Stop 62,430 | Target 65,710 | R:R 2:1
- Long 65,710 breakout | Stop 64,999 | Target 67,140 | R:R 1.5:1
- Fade 67,140 rejection | Stop above resistance | Target 64,999 | R:R 2:1
Experience-level guidance:
Beginner: Reduce size to half your standard. Trade only the cleanest setup from the entries above. If the tape opens against your bias, do nothing — wait for the second hour, when the institutional flow has tipped its hand.
Intermediate: Use the levels table to define the trading range. Fade the extremes with defined stops, take profits before the round-number resistance levels.
Advanced: The vol regime supports defined-risk structures around the key pivot levels. Keep notional small relative to your book — asymmetric speculation, not core positioning.
Continue Reading
The macro frame driving this read is unpacked in the session briefs:
Check the latest session briefs on the site.
This analysis is for educational and informational purposes only. It does not constitute financial advice. Always manage your risk independently and in accordance with your own financial circumstances.
Thursday 28 May 2026
Nikkei 225 — Daily Framework Read | Thursday 28 May 2026
Nikkei 225 | Pre Asia Setup Daily Read | Data basis: 2026-05-28 close
Where It Sits
Structure
Structurally Nikkei 225 sits above its short-term moving averages with the daily trend firmly higher. The recent advance has been orderly with no signs of distribution or topping behaviour. The reference anchor at 64,996 acts as the bias line.
Momentum
Momentum is neutral with internal readings near the centre of the range. That is the signature of a market digesting the prior move. The tape needs a fresh catalyst to commit to direction.
Volume & Flow
Flow on the session close was measured. Positioning data suggests steady accumulation rather than aggressive directional commitment. The pattern supports continuation rather than reversal.
Key Levels
| Level | Type | Significance | Action Zone |
|---|---|---|---|
| 66,060 | Resistance | Upper range target, prior supply zone | Take profits / fade if rejected |
| 65,350 | Pivot | Mid-range continuation marker | Hold = constructive; lose = consolidation |
| 64,996 | Session close | Reference anchor for next session | Above = continuation; below = mean revert |
| 64,430 | Support | Recent range floor, demand zone | Buy zone with defined stop |
| 63,710 | Major support | Prior breakout retest level | Stop-out below for longs |
Three Scenarios
Continuation
Nikkei 225 holds above the session close at 64,996 and extends higher on continued institutional flow. The vol regime supports trending moves and the path of least resistance remains up. Watch for a clean hold above the pivot level to confirm.
Range
Nikkei 225 opens flat and churns around the 64,996 level. Magnet to the prior close. The tape needs a fresh catalyst to commit. Range trade with defined stops.
Mean Reversion
Nikkei 225 opens firm but meets supply at the pivot, fades back below 64,996. Failed breakout pattern. Not the base case but worth size discipline if volatility expands.
Risk Score
Risk sits at Around 55%
Risk sits around 55 per cent. Vix at 16.3 supports a measured risk posture. sentiment at 61 is in greed territory. Index-level positions carry concentration risk in the leading names. Standard sizing with defined stops — discipline beats conviction.
How to Walk It
Entry / Stop / Target structure:
- Long 64,430 pullback | Stop 63,710 | Target 65,350 | R:R 2:1
- Long 65,350 breakout | Stop 64,996 | Target 66,060 | R:R 1.5:1
- Fade 66,060 rejection | Stop above resistance | Target 64,996 | R:R 2:1
Experience-level guidance:
Beginner: Reduce size to half your standard. Trade only the cleanest setup from the entries above. If the tape opens against your bias, do nothing — wait for the second hour, when the institutional flow has tipped its hand.
Intermediate: Use the levels table to define the trading range. Fade the extremes with defined stops, take profits before the round-number resistance levels.
Advanced: The vol regime supports defined-risk structures around the key pivot levels. Keep notional small relative to your book — asymmetric speculation, not core positioning.
Continue Reading
The macro frame driving this read is unpacked in the session briefs:
Check the latest session briefs on the site.
This analysis is for educational and informational purposes only. It does not constitute financial advice. Always manage your risk independently and in accordance with your own financial circumstances.
Tuesday 26 May 2026
The Nikkei 225 has been fighting a difficult battle this week. After a sharp sell-off broke through key support zones, a recovery attempt developed but ran into an exhaustion signal at the upper range of the bounce. That is a significant read. When the analysis flags exhaustion on a recovery, it typically means the buyers who drove the bounce are running out of energy before reaching meaningful resistance levels, and the sellers are likely to regain control on the next attempt.
The structural picture shows a market that is not yet ready to resume any prior uptrend. The repeated trend line breaks to the downside earlier in the week established a new directional bias that has not been fully reversed. The recovery has been a counter-move within a broader distribution, and the exhaustion signal at the top of that counter-move is the analysis flagging the most likely next direction. The momentum assessment is not supportive of sustained further upside from current levels without a clear structural reset.
Japan-specific factors add to the complexity. The yen relationship with Japanese equities is ever-present, and any movement in the yen through the weekend will directly impact where the Nikkei opens on Monday Asian session. UK traders do not get the benefit of a Monday bank holiday cushion here — the Nikkei trades on Monday regardless. That means the gap risk is asymmetric: you could wake up Tuesday to find the Asian session has already moved considerably. This requires appropriate caution over the weekend.
| Level | Price | Notes |
|---|---|---|
| Exhaustion Zone | 37,200 – 37,400 | Bounce resistance, structural ceiling |
| Support Base | 36,400 – 36,600 | Prior consolidation, demand interest |
| Target (Short) | 36,500 | If exhaustion at ceiling leads to renewed selling |
| Target (Long) | 37,800 | Only with clean weekly close above 37,400 |
| R:R | 1.7 : 1 | Short from exhaustion zone, stop above 37,450 |
The Nikkei carries the highest risk score of the Asian markets this week. The combination of an exhaustion signal on the bounce, ongoing structural damage from the earlier sell-off, and the yen exposure creates a genuinely uncertain environment. The market is actively resolving a conflict between buyers and sellers and that resolution may not become clear until after the weekend. Reduced exposure and firm stops are essential. This is not a market to press hard in either direction right now.
The Nikkei has a habit of inflicting sharp pain on traders who enter on bounces without waiting for confirmation. The exhaustion signal is a warning to respect, not ignore. If you were short through the earlier weakness, now is the time to protect profits, not to hold for the absolute low. If you are looking to go long on the recovery, wait for the exhaustion zone to be broken convincingly on strong volume before committing. Patience on a market showing this kind of structural confusion is always the right call.
Saturday 23 May 2026
Nikkei 225 (NIKKEI) — Weekend Daily Read
Framework Bias
LONG BIAS
The Nikkei delivered the biggest single-day gain of any major index on Friday, surging 2.68% and adding over 1,650 points to close at 63,339. This is a significant move that demands respect. The index opened at 61,913 and closed near the session high at 63,432, meaning buyers controlled the tape from start to finish. That kind of full-day buying pressure is an institutional signal, not retail noise.
The key driver is the yen. USD/JPY at 159.16 is keeping the yen weak, which is directly beneficial for Japanese exporters. Toyota, Sony, and the other multinational heavyweights earn most of their revenues in dollars and euros. When yen is weak, those overseas earnings translate back to more yen, which boosts reported profits and attracts foreign capital into Japanese equities.
The Nikkei is now approaching territory not seen in decades. The 65,000 level represents the next significant psychological round number, and Friday’s momentum suggests it is within reach. A weekend of positive global sentiment could see the Tokyo session press toward that level early next week.
Key Levels
| Level Type | Price | Note |
|---|---|---|
| Major Resistance | 65,000 | Round number and key upside target |
| Near Resistance | 63,432 | Friday session high |
| Current Price | 63,339 | Friday close |
| Near Support | 62,500 | Prior session cluster and natural retracement |
| Key Support | 61,684 | Thursday close and recent structural base |
| Major Support | 60,000 | Psychological level and monthly demand zone |
Trade Framework
| Scenario | Entry Zone | Stop | Target | R:R |
|---|---|---|---|---|
| Long on Monday open pullback | 63,000 to 63,150 | 62,500 | 64,200 | approx 2.2:1 |
| Long on continuation above Friday high | 63,450 hold | 62,800 | 65,000 | approx 2.4:1 |
| Short on exhaustion rejection | 64,800 to 65,000 failure | 65,200 | 63,200 | approx 8.0:1 |
Confidence level: around 67%. The Friday move is high-conviction and yen dynamics remain supportive. The 67% reflects the extended single-day move and the risk of Monday profit-taking in thin US-off conditions. A 63,000 retest that holds clean on Monday would push confidence to around 75%.
Weekend Context
USD/JPY is the number to watch over the weekend. At 159.16, the yen is weak but still within the range that the Bank of Japan has tacitly accepted. If the yen weakens further toward 160, that adds another tailwind for the index but also increases intervention risk from the BoJ. Above 160 is where Japanese authorities have previously acted to defend the currency.
The Nikkei’s 2.68% Friday gain will attract attention globally. Global macro funds that were underweight Japan may use Monday’s thin market to add exposure. That flow dynamic is typically price-insensitive, which can accelerate moves in already-moving markets.
The risk to the long bias is a sharp yen strengthening move, which can arrive without warning if the BoJ speaks or if safe-haven flows surge. A move back below 157 in USD/JPY would materially change the Nikkei picture. Keep that on your weekend watchlist.
Friday 22 May 2026
Daily Ticker Read • Friday 22 May 2026
Nikkei 225: USD/JPY at 159 Is the Story, Not the Index
Members preview — public access 23 May 2026
What the Framework Is Saying
The Nikkei is around 39,500. The index has recovered impressively from its April lows when global risk sentiment collapsed and Yen strength was threatening to reverse two years of structural gains. That threat has, for now, faded. USD/JPY sitting at 159 means Japanese exporters are still in a sweet spot, and the Nikkei is reflecting that.
The read is neutral to cautiously bullish, but with a major caveat. The Bank of Japan is the wildcard in this story. The BoJ has been signalling more willingness to normalise rates, and every speech from BoJ Governor Ueda carries the potential to move USD/JPY by two to three figures. A Yen move back toward 155 would hurt the Nikkei directly.
At 39,500, the Nikkei is approaching a level that has acted as resistance before. The index needs a clean push through 40,000 to signal a new leg higher. That has not happened yet. The current position is a hold zone, not a clear launch pad.
Key Levels for Friday
| Level | Price | Significance |
|---|---|---|
| Support 1 | 39,100 | Recent breakout point |
| Support 2 | 38,600 | Weekly structural floor |
| Resistance 1 | 39,800 | Immediate ceiling |
| Resistance 2 | 40,000 | Psychological + prior high |
| Long entry | 39,120 area | Dip to S1 if USD/JPY holds |
| Stop | 38,750 | Below S1 with BoJ buffer |
| Target | 39,750 | Into R1, partial close |
Note: All Nikkei levels expressed in index points. Check USD/JPY before entry. If USD/JPY breaks below 157.50, reduce conviction on any long.
What Changed Since Yesterday
USD/JPY has been holding in the 158.50 to 159.50 range this week. That has been stable enough for the Nikkei to maintain altitude. The absence of BoJ intervention threat rhetoric has been the key permissive factor. When the BoJ is quiet, the Yen drifts, and when the Yen drifts toward 160, the Nikkei tends to drift higher.
Thursday saw solid performance from Japanese auto exporters. Toyota, Honda, and Subaru all performed well in the Tokyo session, which helped keep the index bid. However, the semiconductor names were softer, mirroring the NVDA-led weakness in the US. That sector drag is worth watching because it could amplify any negative move if US tech sell-off continues overnight into the Tokyo open.
Friday Scenarios
Bull — 35%
USD/JPY holds above 158.50, US futures point higher at Asia open, auto sector continues to lead. Nikkei makes a run at 39,800 and tests the approach to 40,000 by end of week.
Sideways — 35%
USD/JPY stable, mixed US session overnight. Nikkei oscillates between 39,200 and 39,700. No clear catalyst to break either way. Typical end-of-week risk management session for Tokyo desks.
Bear — 30%
BoJ communication sparks Yen strength, USD/JPY breaks below 157.50. Nikkei drops sharply toward 38,600 as exporters reprice. This is a non-trivial risk given how far USD/JPY has moved without a correction.
Position Sizing
The BoJ risk is real and the bear scenario is assigned a higher probability than usual because of how extended USD/JPY is. Reduced sizing protects you if the Yen snaps. If USD/JPY is clearly holding and the Tokyo open is calm, you can build back toward standard. Do not lead with full size into an unknown Asia session.
Related Reading
- Pre-Asia Brief: USD/JPY overnight range and BoJ communication watch
- Alpha Insight: Japanese exporter earnings sensitivity to Yen levels
- FX Ticker: USD/JPY daily read and 160 ceiling dynamics
This analysis is for educational and informational purposes only. It does not constitute financial advice or a recommendation to buy or sell any instrument. Markets can move against any position. Always manage your risk, use appropriate position sizing for your account, and consult a qualified financial adviser if you are unsure whether trading is suitable for you. Past read accuracy does not guarantee future results. Capital is at risk.
Sunday 17 May 2026
—
title: “NIKKEI225 Weekly Review : 16 May 2026”
subtitle: “NIKKEI225 | Tokyo Stock Exchange | Weekly Timeframe”
date: “2026-05-16”
instrument: “NIKKEI225”
—
Weekend Ticker Review | 16 May 2026
NIKKEI225 : BOJ Divergence, Carry Unwind Tail Risk, Crude Headwind
NIKKEI225 | Tokyo Stock Exchange | 12-16 May 2026
1. Week at a Glance
| BOJ Policy Rate | 0.50% |
| US-Japan Rate Gap | 345bps : BOJ 345bps below US 10Y at 4.50%+ |
| JPY Carry Dynamic | Most active carry trade globally : unwind tail risk building |
| Crude Impact | +4.20% crude = input cost headwind for energy-importing Japan |
| Tail Risk Event | 10Y above 4.65% could trigger August 2024-style carry unwind |
| BOJ Trajectory | Gradual tightening : each hike narrows carry and builds unwind risk |
| USDJPY Bias | Dollar bid but BOJ tail risk limits upside conviction |
| Signal | AVOID directional : asymmetric tail risk makes sizing uncomfortable |
2. What Happened
The BOJ divergence story became more acute this week. US 10-year yields broke above 4.50%, widening the gap versus Japan’s 0.50% policy rate to 345 basis points. That is the largest rate differential between the two countries in this cycle. It should be yen-bearish : and it has been. But the tail risk is growing in proportion to that gap.
Crude oil rising 4.20% is directly bad for Japan. The country imports virtually all of its energy. When crude spikes on supply disruption, Japan pays more regardless of central bank policy, regardless of yen levels, and regardless of any domestic economic strength. Crude at $105.42 is an input cost problem that the Nikkei’s manufacturing-heavy composition feels directly.
The carry trade mechanism deserves attention. 345 basis points of differential is historically unusual. Investors borrow yen cheaply and buy higher-yielding US assets. When that trade unwinds : as it did violently in August 2024 : yen appreciates sharply and Japanese equities fall hard in yen terms while also losing value in USD terms for foreign investors. The trigger for that unwind is typically a BOJ surprise or a rapid move in US rates.
The 10-year at 4.50% is already at a historically significant level. If it pushes toward 4.65%, the carry trade becomes uncomfortable to hold and the probability of a disorderly unwind rises. That is the tail risk sitting underneath the Nikkei right now.
3. What the Alpha Insights Said
FX Focus : Post 11
USDJPY: BOJ at 0.50% versus US 10Y at 4.50%+ creates a 345bps differential. Identified as the most active carry trade globally. Exit risk grows as BOJ gradually tightens. Tail risk: August 2024-style carry unwind if BOJ accelerates. Signal is AVOID directional because the asymmetric risk makes position sizing deeply uncomfortable in either direction.
Global Grid : Post 06
Japan regional assessment: mixed stance, yen carry dynamics, moderate stress. USDJPY support 151.00, resistance 157.00. Dollar bid is real but BOJ tail risk limits upside conviction in the pair. Crude +4.20% is stagflationary for energy-importing countries : Japan is the most exposed major economy to this specific dynamic.
Macro Pulse : Post 01
Crude +4.20% creates a stagflationary undertone that no central bank controls. Japan’s central bank faces that problem acutely : the BOJ cannot raise rates fast enough to offset import inflation from crude without triggering yen carry unwinding. That policy trap makes Japanese equity direction fundamentally uncertain relative to developed market peers.
Overwatch : Post 18
The USDJPY carry trade is explicitly listed as a risk that grows each week as BOJ gradually tightens. The 10-year at 4.50% is described as a binary threshold. If it breaks to 4.65%, every carry trade faces stress. The Nikkei sits in the middle of that dynamic : exposed to both the rate threshold and the yen volatility that follows any sharp move in either direction.
Commodities : Post 13
Crude $105.42 on supply disruption. Backwardation of $1.82 excess confirms physical tightness : not a short-term spike. Japan imports essentially all of its crude. This is not a transient input cost headwind. The supply disruption thesis is expected to persist to the EIA data on Wednesday. If confirmed, crude stays elevated and Japan’s cost structure stays under pressure.
4. Key Levels
| Instrument | Level | Significance |
|---|---|---|
| USDJPY Support | 151.00 | Below here : yen carry unwind pressure begins |
| USDJPY Resistance | 157.00 | BOJ intervention risk increases at extreme yen weakness |
| 10Y Danger Zone | 4.65% | Carry unwind risk accelerates : August 2024 analogue |
| Current Rate Gap | 345bps | Largest in cycle : unwind potential proportional |
| Crude Watch | $100.50 | Crude above here = sustained input cost headwind for Japan |
| BOJ Signal | Any surprise hike | Primary trigger for carry unwind : watch BOJ commentary |
5. Signal + Bias
USDJPY direction: AVOID directional. The dollar is bid (constructive), but the BOJ tail risk makes sizing uncomfortable. A sharp BOJ move or a 10-year break above 4.65% could trigger August 2024-style yen appreciation and Nikkei collapse in a matter of sessions.
Nikkei direction: Bearish bias in USD terms. Rising crude input costs, yen carry dynamics creating volatility risk, and no energy sector to offset the crude headwind.
If you must trade: Wait for the 10-year to stabilise below 4.55%. USDJPY range 151.00-157.00 is the box. No directional trades outside confirmed range boundaries while the carry unwind tail risk is active.
Better alternatives: All the other signals in the framework : crude, GBP short, NVDA : carry better R:R with more identifiable invalidation levels. Nikkei is the last place to deploy capital this week.
6. Next Week Setup
FOMC minutes Wednesday is the critical event for USDJPY and the Nikkei. Hawkish Fed language widens the rate gap further : yen weakens, carry trade extends, but the unwind risk builds simultaneously. A dovish surprise narrows the gap, yen strengthens, Nikkei falls in yen terms.
EIA crude supply data Wednesday 10:30 ET directly impacts the Nikkei cost structure. Confirmation of physical tightness keeps crude elevated and Japan’s energy import bill high. A supply surprise could give the Nikkei relief : but that’s the lower-probability outcome given the backwardation structure.
Any BOJ commentary through the week should be monitored carefully. Even language that signals a faster-than-expected tightening path can trigger disproportionate yen moves given the scale of the carry trade sitting in the market. The August 2024 analogue happened in days, not weeks.
If the 10-year breaks above 4.65%, that is the early warning for Scenario C across the whole framework : and the Nikkei is the most vulnerable major index to that scenario because of the carry dynamic. Watch the 10-year level first, USDJPY second, Nikkei third.
7. Risk Score
Around 70%
Highest risk score in the index group. The BOJ-Fed 345bps gap is the largest in the cycle. Crude at $105+ is a direct input cost headwind with no energy sector offset. The carry unwind tail risk is asymmetric : when it goes, it goes fast and it goes hard. Two events this week (FOMC minutes and BOJ commentary) could trigger it. Avoid directional positions here. Better setups exist elsewhere.
Saturday 16 May 2026
—
title: “NIKKEI225 Weekly Review : 16 May 2026”
subtitle: “NIKKEI225 | Tokyo Stock Exchange | Weekly Timeframe”
date: “2026-05-16”
instrument: “NIKKEI225”
—
Weekend Ticker Review | 16 May 2026
NIKKEI225 : BOJ Divergence, Carry Unwind Tail Risk, Crude Headwind
NIKKEI225 | Tokyo Stock Exchange | 12-16 May 2026
1. Week at a Glance
| BOJ Policy Rate | 0.50% |
| US-Japan Rate Gap | 345bps : BOJ 345bps below US 10Y at 4.50%+ |
| JPY Carry Dynamic | Most active carry trade globally : unwind tail risk building |
| Crude Impact | +4.20% crude = input cost headwind for energy-importing Japan |
| Tail Risk Event | 10Y above 4.65% could trigger August 2024-style carry unwind |
| BOJ Trajectory | Gradual tightening : each hike narrows carry and builds unwind risk |
| USDJPY Bias | Dollar bid but BOJ tail risk limits upside conviction |
| Signal | AVOID directional : asymmetric tail risk makes sizing uncomfortable |
2. What Happened
The BOJ divergence story became more acute this week. US 10-year yields broke above 4.50%, widening the gap versus Japan’s 0.50% policy rate to 345 basis points. That is the largest rate differential between the two countries in this cycle. It should be yen-bearish : and it has been. But the tail risk is growing in proportion to that gap.
Crude oil rising 4.20% is directly bad for Japan. The country imports virtually all of its energy. When crude spikes on supply disruption, Japan pays more regardless of central bank policy, regardless of yen levels, and regardless of any domestic economic strength. Crude at $105.42 is an input cost problem that the Nikkei’s manufacturing-heavy composition feels directly.
The carry trade mechanism deserves attention. 345 basis points of differential is historically unusual. Investors borrow yen cheaply and buy higher-yielding US assets. When that trade unwinds : as it did violently in August 2024 : yen appreciates sharply and Japanese equities fall hard in yen terms while also losing value in USD terms for foreign investors. The trigger for that unwind is typically a BOJ surprise or a rapid move in US rates.
The 10-year at 4.50% is already at a historically significant level. If it pushes toward 4.65%, the carry trade becomes uncomfortable to hold and the probability of a disorderly unwind rises. That is the tail risk sitting underneath the Nikkei right now.
3. What the Alpha Insights Said
FX Focus : Post 11
USDJPY: BOJ at 0.50% versus US 10Y at 4.50%+ creates a 345bps differential. Identified as the most active carry trade globally. Exit risk grows as BOJ gradually tightens. Tail risk: August 2024-style carry unwind if BOJ accelerates. Signal is AVOID directional because the asymmetric risk makes position sizing deeply uncomfortable in either direction.
Global Grid : Post 06
Japan regional assessment: mixed stance, yen carry dynamics, moderate stress. USDJPY support 151.00, resistance 157.00. Dollar bid is real but BOJ tail risk limits upside conviction in the pair. Crude +4.20% is stagflationary for energy-importing countries : Japan is the most exposed major economy to this specific dynamic.
Macro Pulse : Post 01
Crude +4.20% creates a stagflationary undertone that no central bank controls. Japan’s central bank faces that problem acutely : the BOJ cannot raise rates fast enough to offset import inflation from crude without triggering yen carry unwinding. That policy trap makes Japanese equity direction fundamentally uncertain relative to developed market peers.
Overwatch : Post 18
The USDJPY carry trade is explicitly listed as a risk that grows each week as BOJ gradually tightens. The 10-year at 4.50% is described as a binary threshold. If it breaks to 4.65%, every carry trade faces stress. The Nikkei sits in the middle of that dynamic : exposed to both the rate threshold and the yen volatility that follows any sharp move in either direction.
Commodities : Post 13
Crude $105.42 on supply disruption. Backwardation of $1.82 excess confirms physical tightness : not a short-term spike. Japan imports essentially all of its crude. This is not a transient input cost headwind. The supply disruption thesis is expected to persist to the EIA data on Wednesday. If confirmed, crude stays elevated and Japan’s cost structure stays under pressure.
4. Key Levels
| Instrument | Level | Significance |
|---|---|---|
| USDJPY Support | 151.00 | Below here : yen carry unwind pressure begins |
| USDJPY Resistance | 157.00 | BOJ intervention risk increases at extreme yen weakness |
| 10Y Danger Zone | 4.65% | Carry unwind risk accelerates : August 2024 analogue |
| Current Rate Gap | 345bps | Largest in cycle : unwind potential proportional |
| Crude Watch | $100.50 | Crude above here = sustained input cost headwind for Japan |
| BOJ Signal | Any surprise hike | Primary trigger for carry unwind : watch BOJ commentary |
5. Signal + Bias
USDJPY direction: AVOID directional. The dollar is bid (constructive), but the BOJ tail risk makes sizing uncomfortable. A sharp BOJ move or a 10-year break above 4.65% could trigger August 2024-style yen appreciation and Nikkei collapse in a matter of sessions.
Nikkei direction: Bearish bias in USD terms. Rising crude input costs, yen carry dynamics creating volatility risk, and no energy sector to offset the crude headwind.
If you must trade: Wait for the 10-year to stabilise below 4.55%. USDJPY range 151.00-157.00 is the box. No directional trades outside confirmed range boundaries while the carry unwind tail risk is active.
Better alternatives: All the other signals in the framework : crude, GBP short, NVDA : carry better R:R with more identifiable invalidation levels. Nikkei is the last place to deploy capital this week.
6. Next Week Setup
FOMC minutes Wednesday is the critical event for USDJPY and the Nikkei. Hawkish Fed language widens the rate gap further : yen weakens, carry trade extends, but the unwind risk builds simultaneously. A dovish surprise narrows the gap, yen strengthens, Nikkei falls in yen terms.
EIA crude supply data Wednesday 10:30 ET directly impacts the Nikkei cost structure. Confirmation of physical tightness keeps crude elevated and Japan’s energy import bill high. A supply surprise could give the Nikkei relief : but that’s the lower-probability outcome given the backwardation structure.
Any BOJ commentary through the week should be monitored carefully. Even language that signals a faster-than-expected tightening path can trigger disproportionate yen moves given the scale of the carry trade sitting in the market. The August 2024 analogue happened in days, not weeks.
If the 10-year breaks above 4.65%, that is the early warning for Scenario C across the whole framework : and the Nikkei is the most vulnerable major index to that scenario because of the carry dynamic. Watch the 10-year level first, USDJPY second, Nikkei third.
7. Risk Score
Around 70%
Highest risk score in the index group. The BOJ-Fed 345bps gap is the largest in the cycle. Crude at $105+ is a direct input cost headwind with no energy sector offset. The carry unwind tail risk is asymmetric : when it goes, it goes fast and it goes hard. Two events this week (FOMC minutes and BOJ commentary) could trigger it. Avoid directional positions here. Better setups exist elsewhere.
Saturday 16 May 2026
Nikkei 225 (JPN225) — Daily Read | Friday 15 May 2026
Friday Tokyo session | Captured Thursday’s US CPI tailwind | US sell-off feeds Saturday open | Not financial advice
WHAT CHANGED FROM YESTERDAY
Yesterday the Nikkei closed at 63,355 (+0.13%) — a modest gain that captured only the pre-CPI sentiment since Tokyo trades before the US data dropped. The analysis correctly noted that the CPI tailwind would “feed through into tomorrow’s Tokyo session.” That tailwind arrived for Friday’s Tokyo open, lifting the Nikkei to around 64,200-64,500 range during the Friday Asian session. But the US Retail Sales sell-off on Friday afternoon now creates a new headwind that will arrive in Monday’s Tokyo session — not this one. The Nikkei is effectively one session behind the US sell-off.
HEADLINE STATE: LAGGED — Caught CPI Tailwind Friday, Faces Retail Sales Headwind Monday
The Nikkei’s session timing means it always gets the previous US session’s signal, not the current one. Friday Tokyo benefited from Thursday’s CPI rally. Monday Tokyo will absorb Friday’s Retail Sales sell-off. USD/JPY is the critical variable: if the dollar strengthens into Monday, Nikkei gets support from currency. If yen strengthens on risk-off, Nikkei faces a double hit from both the US sell-off and currency headwind. Watch USDJPY into the Monday open.
| Metric | Thu Close (Tokyo) | Fri Tokyo (est) | Monday Risk |
|---|---|---|---|
| Nikkei 225 | 63,355 (+0.13%) | ~64,200-64,500 (CPI boost) | US sell-off lands Monday |
| USD/JPY | ~145-146 est | Check Monday open | Risk-off = yen bid = Nikkei pressure |
| US SPY Friday | N/A (not yet known) | $739.17 (-1.20%) | Nikkei absorbs Monday |
| Bias | CPI tailwind expected | CPI delivered Friday | Retail Sales headwind Monday |
KEY LEVELS INTO NEXT WEEK
- 64,000 — the CPI-driven Friday high zone becomes the first reference for Monday’s open.
- 63,355 — Thursday close, the pre-CPI base for Tokyo. Monday below here is a full reversal.
- USD/JPY — if yen strengthens past 143, Nikkei exporters face currency headwind compounding the US risk-off.
- 62,000 — deeper support if risk-off extends into the Tokyo session next week.
OVERWATCH CONTEXT
The Overwatch noted the Nikkei’s lag structure clearly in Thursday’s analysis. Friday proved the point: the CPI tailwind the read predicted arrived on schedule for Tokyo’s Friday session. The Retail Sales headwind the read did not anticipate will arrive in Tokyo’s Monday session. The Nikkei is a clean one-session lag on US macro events. Position accordingly: if you are trading Nikkei, your entry window for the Retail Sales impact is Monday morning Tokyo open, not Friday.
WHAT TO WATCH NEXT WEEK
- Monday Tokyo open gap versus Friday estimated close is the first Retail Sales impact read.
- USD/JPY direction overnight Sunday into Monday determines the currency amplifier direction.
- Japanese data releases next week — any domestic catalyst that offsets the US growth concern.
- 63,000 is the level. Hold it Monday and the Nikkei is consolidating. Lose it and the CPI week gains are gone.
Friday 15 May 2026 | Not financial advice. For informational purposes only.
Friday 15 May 2026
Nikkei 225 — Daily Read | Friday 15 May 2026
Post-CPI US close | 63,355 — yen sensitivity, risk-on participant | Not financial advice
WHAT CHANGED FROM YESTERDAY
Yesterday’s read flagged Nikkei as a risk-on participant benefiting from the broader global bid, with the yen at USD/JPY 158.15 providing a mechanical export tailwind. The Thursday US close confirmed the global risk-on regime: the 8/3/1 Overwatch grid has Nikkei as one of the confirmers. What changed is that the post-CPI dollar strength at DXY 98.89 pushed USD/JPY higher, which is directly positive for Nikkei’s export-heavy composition. When the yen weakens, Toyota, Sony, and the other major exporters see their foreign earnings translate back into more yen. At 63,355, Nikkei is at a historically elevated level, which raises the question of whether this is a continuation or an exhaustion point.
HEADLINE STATE: LONG WITH YEN TAILWIND — USD/JPY Above 158 Is the Mechanical Bid
Nikkei’s move this week has a straightforward mechanical explanation: the yen has been weak, the risk-on regime has been confirmed, and Japan’s export economy benefits directly from both. USD/JPY at 158.15 is historically high. That means Japanese exporters are booking record yen revenues from their dollar-denominated overseas earnings. The Overwatch did not flag any specific concern about Nikkei — it is one of the clean confirmers in the 8/3/1 grid. The tail risk here is that a sudden yen strength move (intervention risk increases as USD/JPY approaches 160) could sharply reprice Nikkei’s export premium in one session.
Key Levels
| Level | Price | Significance |
|---|---|---|
| Thursday close | 63,355 | Part of the 8/3/1 global confirmer set |
| USD/JPY | 158.15 | Weak yen = mechanical Nikkei export tailwind |
| Upside continuation | 63,800–64,200 | Strong RS data + sustained yen weakness pushes higher |
| Consolidation range | 62,900–63,500 | Holds gains, digests the week — normal Friday behaviour |
| Yen intervention watch | USD/JPY 160 | Bank of Japan verbal or actual intervention risk threshold |
| Tariff tail risk | Any escalation | Japan export sensitivity — tariff risk discount returns immediately |
Structure · Momentum · Flow
Structure
Rising and at high levels. 63,355 is historically elevated for Nikkei. The structure is supported by yen weakness and global risk-on, but extended valuations mean any yen reversal is felt immediately.
Momentum
Positive but extended. The week’s move has been significant. Friday typically sees position squaring in Asia before the US data print. Expect lighter volume and potential drift rather than a strong directional session in the Asian window.
Flow
Yen weakness is the primary flow driver. Foreign institutional buyers favour Nikkei when USD/JPY is rising because their dollar-denominated returns are enhanced. That flow is intact as long as USD/JPY stays above 155.
| Bias | LONG — yen supported, risk-on confirmed |
| Risk estimate | Around 35% — yen intervention risk at 160 is the single biggest tail |
| Key watch | USD/JPY — stays below 160 = Nikkei tailwind continues |
| Friday note | Position squaring in Asian session before US data — lighter volume |
| Week carry | Bullish — global grid confirmer, yen still weak entering next week |
This content is for educational and informational purposes only and does not constitute financial advice. Past analysis does not guarantee future results. Always conduct your own research before making any trading decisions.
Thursday 14 May 2026
Nikkei 225 (JPN225) — Daily Read | Thursday 14 May 2026
Post-CPI mid-session | Pre-CPI Nikkei session captured | Not financial advice
WHAT CHANGED FROM YESTERDAY
Yesterday the Nikkei was flagged as WATCHING — 76% long, structure rising, but volume coming in on the sell side. The analysis called it a distribution pattern and said “when the volume and structure align, the trade becomes actionable.” The Nikkei session today was pre-CPI and closed at 63,355 (+0.13%) — modest. It did not get the CPI boost directly as the US session trades after Tokyo closes. The volume conflict from yesterday appears to have partially resolved: price held and posted a gain, but the gain is small. The full CPI tailwind will likely feed through into tomorrow’s Tokyo session.
HEADLINE STATE: CAUTIOUS POSITIVE — Small Gain Pre-CPI, Tailwind Builds for Friday
Nikkei closed +0.13% before the US CPI print was known. That is the honest read: today’s Tokyo session was flying blind. USD/JPY is now at 158.15 (+0.30%) — yen weakening is a tailwind for Japanese exporters. The dollar bid that came with the CPI print is providing the JPY weakness that the Nikkei needs. The volume conflict from yesterday has not fully resolved, but the environment has improved. Friday’s Tokyo session is where the CPI impact is felt directly.
Key Levels
| Reference | Value | Note |
|---|---|---|
| Today’s close | 63,355 | +0.13% — modest pre-CPI gain |
| USD/JPY | 158.15 (+0.30%) | Yen weakening — tailwind for Nikkei exporters |
| Prior volume signal | Distribution — selling into rising price | Partially resolved — watching Friday for confirmation |
| CPI impact timing | Delayed — Tokyo closed before print | Friday Tokyo session gets the full benefit |
| 76% long read | Maintained | Structure still rising — bias intact |
Structure · Momentum · Flow
Structure
Rising structure is intact. The +0.13% close today, while modest, did not break anything. Structure held, added marginally, and is well positioned for the CPI tailwind to flow through into Friday’s session.
Momentum
Muted today — Tokyo session was pre-CPI. The volume conflict from yesterday has not been fully resolved. USD/JPY moving higher is the most positive signal for Nikkei momentum right now. Watch Friday.
Flow
The distribution concern from yesterday is being tested. If Friday’s session opens higher and buys through on volume, the distribution read was a blip. If price fails to react to the US CPI positive, it confirms the distribution was real.
TODAY’S BIAS: WATCHING — Friday Session is the Confirmation Moment
Today’s Nikkei session is a placeholder. The real test is Friday — will the CPI tailwind and JPY weakness translate into a strong Tokyo open? USD/JPY at 158.15 is supportive. Global risk-on is supportive. But the volume signal from yesterday needs to be resolved with buy-side participation in the next session, not just price holding.
Risk: Around 45%
The distribution signal from yesterday has not been cleared — only deferred. Until Friday’s session provides volume confirmation on the long side, the risk score stays elevated. The long bias in structure is real but needs flow to back it up. Do not act purely on the CPI tailwind narrative — wait for Friday’s price action to confirm.
By Experience Level
New to this
The Nikkei is a lesson in time zones. A US CPI print at 13:30 ET happens after Tokyo has already closed. The Nikkei does not benefit in real time — it prices the reaction in the following session. This is why global macro traders think in terms of “overnight flows,” not just intraday.
Developing
The JPY/Nikkei inverse relationship is one of the most reliable in global markets. Yen weakens, Nikkei rises — Japanese exporters earn overseas revenue in dollars and it converts back to more yen. USD/JPY at 158.15 is a meaningful headwind for the yen and tailwind for the index.
Experienced
The distribution signal that flagged yesterday is the key unresolved question. It is possible the “sellers” in the distribution were hedgers who are now being forced to cover on this CPI move. If so, Friday’s session will see forced unwind flow driving the Nikkei sharply higher. Watch Friday’s open volume — that is the tell.
This is a daily analysis read for educational and informational purposes only. Nothing here is financial advice. Past performance is not a guide to future results. Trading carries significant risk of loss. Always apply your own risk management.
Wednesday 13 May 2026
Nikkei 225 (JPN225) — Daily Framework Read | Wednesday 13 May 2026
analysis as of pre-market | CPI 3.8% shock context | Not financial advice
HEADLINE STATE: WATCHING — 76% Long, Structure Rising, Volume Selling
The Nikkei mirrors a pattern we see in GBPUSD today: structure rising, volume contradicting. 76% long read with structure rising is encouraging, but volume is on the sell side. When price goes up and volume comes in on the down side, you have distribution — institutions reducing exposure into the strength. That is not a signal to go long confidently. The framework is watching, not acting. When the volume and structure align, the trade becomes actionable.
Key Context
| Reference | Note |
|---|---|
| Long bias read | 76% — majority lean upward |
| Structure | Rising — constructive longer-term |
| Volume bias | Selling — distribution pattern |
| USD/JPY context | JPY strengthening = headwind for Nikkei exporters |
| Framework state | WATCHING — structure/volume conflict |
| Trigger for long | Volume must confirm with buying before entry |
Structure · Momentum · Flow
Structure
Rising structure is a positive base. The index is not in a downtrend — it is building upward. But rising price with selling volume means the moves higher may be running on fumes. Structural trend is positive, execution timing is not yet confirmed.
Momentum
76% long — above neutral, not at conviction levels. The bias is clear but not overwhelming. Momentum needs to flip volume from selling to buying to confirm the structural story. Until then, it is a read without a trade.
Flow
USD/JPY macro is weak short — JPY strengthening. A stronger yen puts pressure on Nikkei earnings from export-heavy constituents. This FX dynamic is a structural headwind for the index even as the technical picture rises. The selling volume may partly reflect this FX concern from institutional players.
Long Case vs Short Case
LONG CASE (conditional)
- 76% long read — structural majority upward
- Rising structure — trend is your long-term friend
- Risk-on globally supports Asian equity indices
- Trigger: volume flips to buying confirmation
- Valid once volume and structure agree
SHORT CASE
- Volume selling in a rising structure = distribution risk
- JPY strengthening = Nikkei exporters under FX pressure
- If structure breaks, 24% short bias materialises fast
- Framework does not call this short — only a warning flag
- Shorts not supported by the primary read today
Sizing Guidance
No position until volume confirms. The Nikkei is a watching state today. The framework has direction (long) but the volume signal is the blocker. Any long entered without volume confirmation is a low-quality setup that fights a distribution pattern. When volume flips and confirms the rising structure, the position becomes a standard long with full sizing. Until then, watch.
Monitor the Asia session opening volume. If buying volume comes in on the open and holds, the 76% long read becomes actionable.
Tuesday 12 May 2026
Daily Framework Read · Tuesday 12 May 2026
Nikkei 225 (JPN225) — Daily Framework Read | Tuesday 12 May 2026
Published pre-market · Time-gated member content
Current State
WATCHING — Mixed Picture
Long bias: 76%. Structure rising across all timeframes, but volume is selling into the advance. Wait for cleaner alignment before engaging.
Key Levels
| Level | Price | Notes |
|---|---|---|
| Structural Direction | Rising | All timeframes bullish |
| Volume Flow | Selling | Counter to structural direction |
| Directional Bias | 76% long | Solid bias but lacks flow confirmation |
| Entry Trigger | Volume aligns with structure | Key missing ingredient today |
Structure Read
The Nikkei’s structural picture is uniformly bullish — all timeframes are showing rising highs and rising lows. This is a market that has been trending higher in a consistent and orderly way. The structural case alone would make this a watch-for-long opportunity, and the 76% long bias reflects that genuine underlying strength.
Momentum Read
Momentum is not the blocking factor here — the issue is volume flow. That said, when volume is selling into a structural advance, momentum can turn quickly if sellers gain traction. For now this is a market in a transition period: the structural trend is up, but today’s session needs to show that buyers can maintain control before committing new capital.
Volume & Flow Read
The volume flow is selling into this market today, which is the single reason this is a watch rather than an active trade. When flow contradicts structure, it creates uncertainty about whether the advance will hold or stall. The resolution — flow turning supportive or price breaking down — is what produces the next clean opportunity.
The Verdict
The Nikkei has the structural setup for a long — the trend is up, the bias is 76%, and the sequence is intact. But the flow is not supporting the long today and that matters. The picture is mixed, not broken. A mixed picture means you wait for the missing element rather than trading on the elements you have. When flow turns to match structure, this becomes a clean trade. Until then, it stays on the watch list.
Long Case vs Short Case
76%
All-timeframe bullish structure. Strong directional bias. Trend intact.
24%
Selling flow + unconfirmed advance stalls and reverses from current levels.
Position Sizing Guidance
No active position today. The Nikkei is a high-priority watch instrument given the strong structural bias. Add it to the list and monitor for flow to flip supportive. When sellers stop pressing and buyers reassert control in the volume picture, revisit with standard risk parameters. The setup will still be there — you don’t need to force a trade in a mixed environment.
This content is for educational and informational purposes only. Nothing here constitutes financial advice or a recommendation to buy or sell any instrument. Trading involves substantial risk of loss. Past performance is not indicative of future results. Always conduct your own due diligence and manage risk appropriately.
Tuesday 5 May 2026
Nikkei 225 (Japan 225) — Daily Framework Read | Tuesday 5 May 2026
Nikkei 225 Cash | Tuesday Open Daily Read | Data basis: Friday close, Tokyo closed for Golden Week
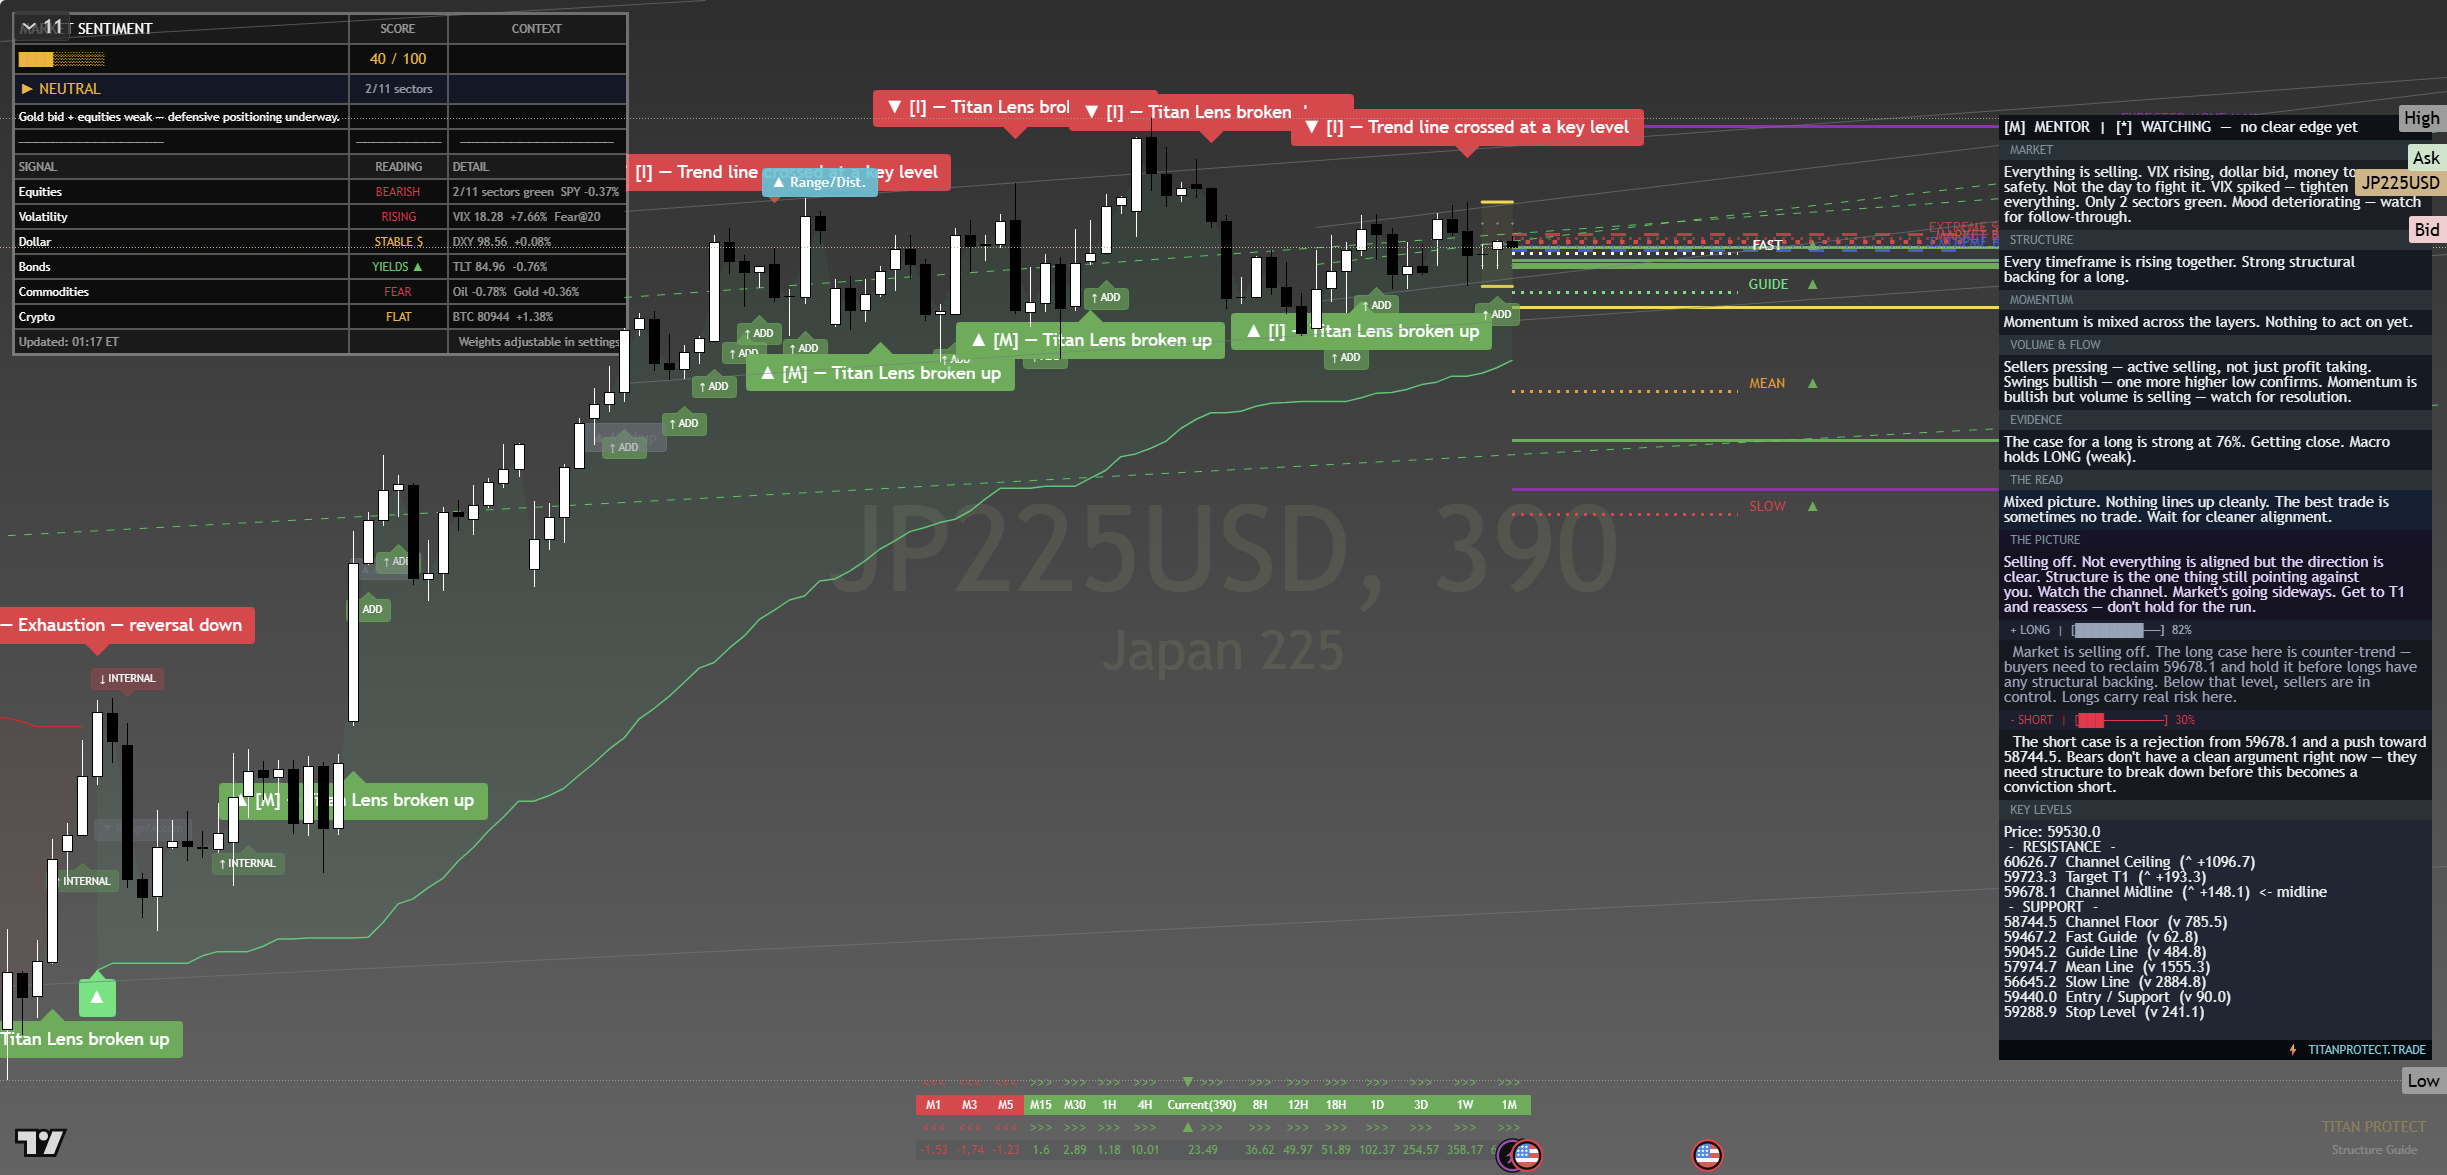
The Read
Two stories converge. First is structural. The Nikkei carried a clean uptrend through April, broke 58,000 mid-month, and stretched to 59,500 by Friday before Golden Week. Higher highs, higher lows, no closing print below the 20-day average for the run. Trend followers have nothing to complain about on the daily.
Second is reflexive. Tokyo cannot trade Monday or today. The cash market is anchored to last week’s tape while the rest of the world has already absorbed Monday’s defensive session. That creates gap risk into Wednesday. If global breadth deteriorates further before the reopen, the Nikkei prints to a marked-down sentiment without fresh local catalysts to help.
The honest read is that the structural tailwind is doing the work. Yen weakness at 157 supports the export-heavy index and the carry trade has not unwound. Against that, the global risk-off impulse is fresher and the Nikkei reopens Wednesday with two sessions of stored news to digest in one open. Constructive on structure, defensive on timing.
The Setup
Structurally the index is still in markup. The leg from the early-April base to the 59,500 zone has been clean and supported by yen weakness at every step. The mid-April breakout above 58,500 has not been retested and the prior swing high above 59,000 has acted as support on every minor pullback. That is the shape of a working trend, not a blow-off top.
The challenge is the index is operating in a stretched zone with no fresh catalyst available. With Tokyo shut, the only thing the price can respond to is sympathy flow through Hong Kong, Singapore futures, and Tuesday Asia turnover. Those venues have been thin and noisy. The index has effectively been frozen at 59,513 while the global tape has cooled.
The middle path is what the data favours. Range between 58,800 and 59,800 on the reopen, with the index using the first session back to absorb the news flow. Uncomfortable for trend followers but normal behaviour for an index returning from a multi-day shutdown.
Levels
| Level | Type | Significance | Action Zone |
|---|---|---|---|
| 60,500 | Upside extension | Next swing extension on a clean continuation | Take profits on longs |
| 60,000 | Round-number magnet | Psychological level, prior pause point | Trim into strength |
| 59,513 | Reference | Friday close, current cash anchor | Directional bias line |
| 59,000 | Support shelf | Prior swing high, must hold for the bull case | Tactical long with stop below |
| 58,500 | Breakout retest | Mid-April breakout level, structural pivot | Defined long zone |
| 58,200 | Major support | Last clean higher low before the recent leg | Loss = defensive read |
| 57,500 | Structural floor | Full retracement of recent extension | Last line before trend break |
Scenarios
Bull Case
Hong Kong carries Tuesday with constructive flow, USDJPY pushes through 158 on dollar bid, and Wednesday’s reopen is greeted by exporter buying. The index defends 59,000 cleanly, prints fresh highs above 59,800, and extends towards 60,000. The trend earns its next leg.
Range Case
The index reopens between 58,800 and 59,500 and uses Wednesday and Thursday to absorb the global news flow. No directional resolution, healthy digestion, framework neutral. Highest-probability path given the volatility profile and the gap-risk mechanics of returning from a multi-day shutdown.
Defensive Case
Global breadth weakens further while Tokyo is shut. VIX prints through 19.50 and US benchmarks lose another leg. The Nikkei reopens lower, breaks 58,800, and tests 58,200 within the first session back. Yen catches a haven bid that pulls USDJPY to 155 and the carry trade unwinds part of its recent gains.
The Verdict
Risk is at Around 60% heading into the reopen.
Three factors set that level. First, the index is operating with stale price discovery. Two sessions of accumulated global news flow have to clear in one open and that mechanically widens the range of likely outcomes. Second, the volatility regime that made the recent rally easy has changed. VIX at 18 with VVIX through 98 tells you global hedgers are paying up for protection and that protection bid does not stop at the US border. Third, the yen tailwind that drove the export-heavy index higher is conditional on the dollar bid persisting, and the dollar bid is conditional on the global risk-off staying contained rather than turning into a credit-style flush.
The 40 percent relief reflects that the structural leg is intact. Markup has not been broken on the daily, the higher-timeframe trend is alive, and yen weakness at 157 favours the export weighting that drove the rally. Position-sized longs into tested support pullbacks remain on the menu. New directional size at the highs is not.
Yesterday vs today: Friday’s close at 59,513 carried a constructive tone and a confirmed structural leg. Today the price is the same, but the global backdrop the price has to defend has changed. The framework has not flipped. It has shifted urgency. We respect the trend and we respect the gap. Wednesday is where the index gets to choose.
Trade the level. Respect the read. Walk it like an institution.
This analysis is for educational and informational purposes only. It does not constitute financial advice. Always manage your risk independently and in accordance with your own financial circumstances.
Continue with Titan Protect
Twenty-plus instruments. One framework.
We read more than twenty instruments daily across four sessions. The framework’s sunrise call landed across the day — the Pre-NY case study shows what the lines drew, what New York did, and where the read stands.
Core
£59/mo
Indicator suite plus daily framework reads.
Edge Popular
£109/mo
Core plus Shield dashboard and member-only briefs.
Elite
£179/mo
Edge plus weekly 1:1 call and early access to new tools.
Save 15% on annual billing
Want to see the framework in action? Free Explorer tier — no card required.
Join the live community: Discord channel · Shield dashboard
Education, not financial advice. Trade your own analysis.
Sunday 3 May 2026
Nikkei 225 — Daily Framework Read | Sunday 3 May 2026
Nikkei 225 | Monday Open Framework Read | Data basis: Friday 1 May 2026 close
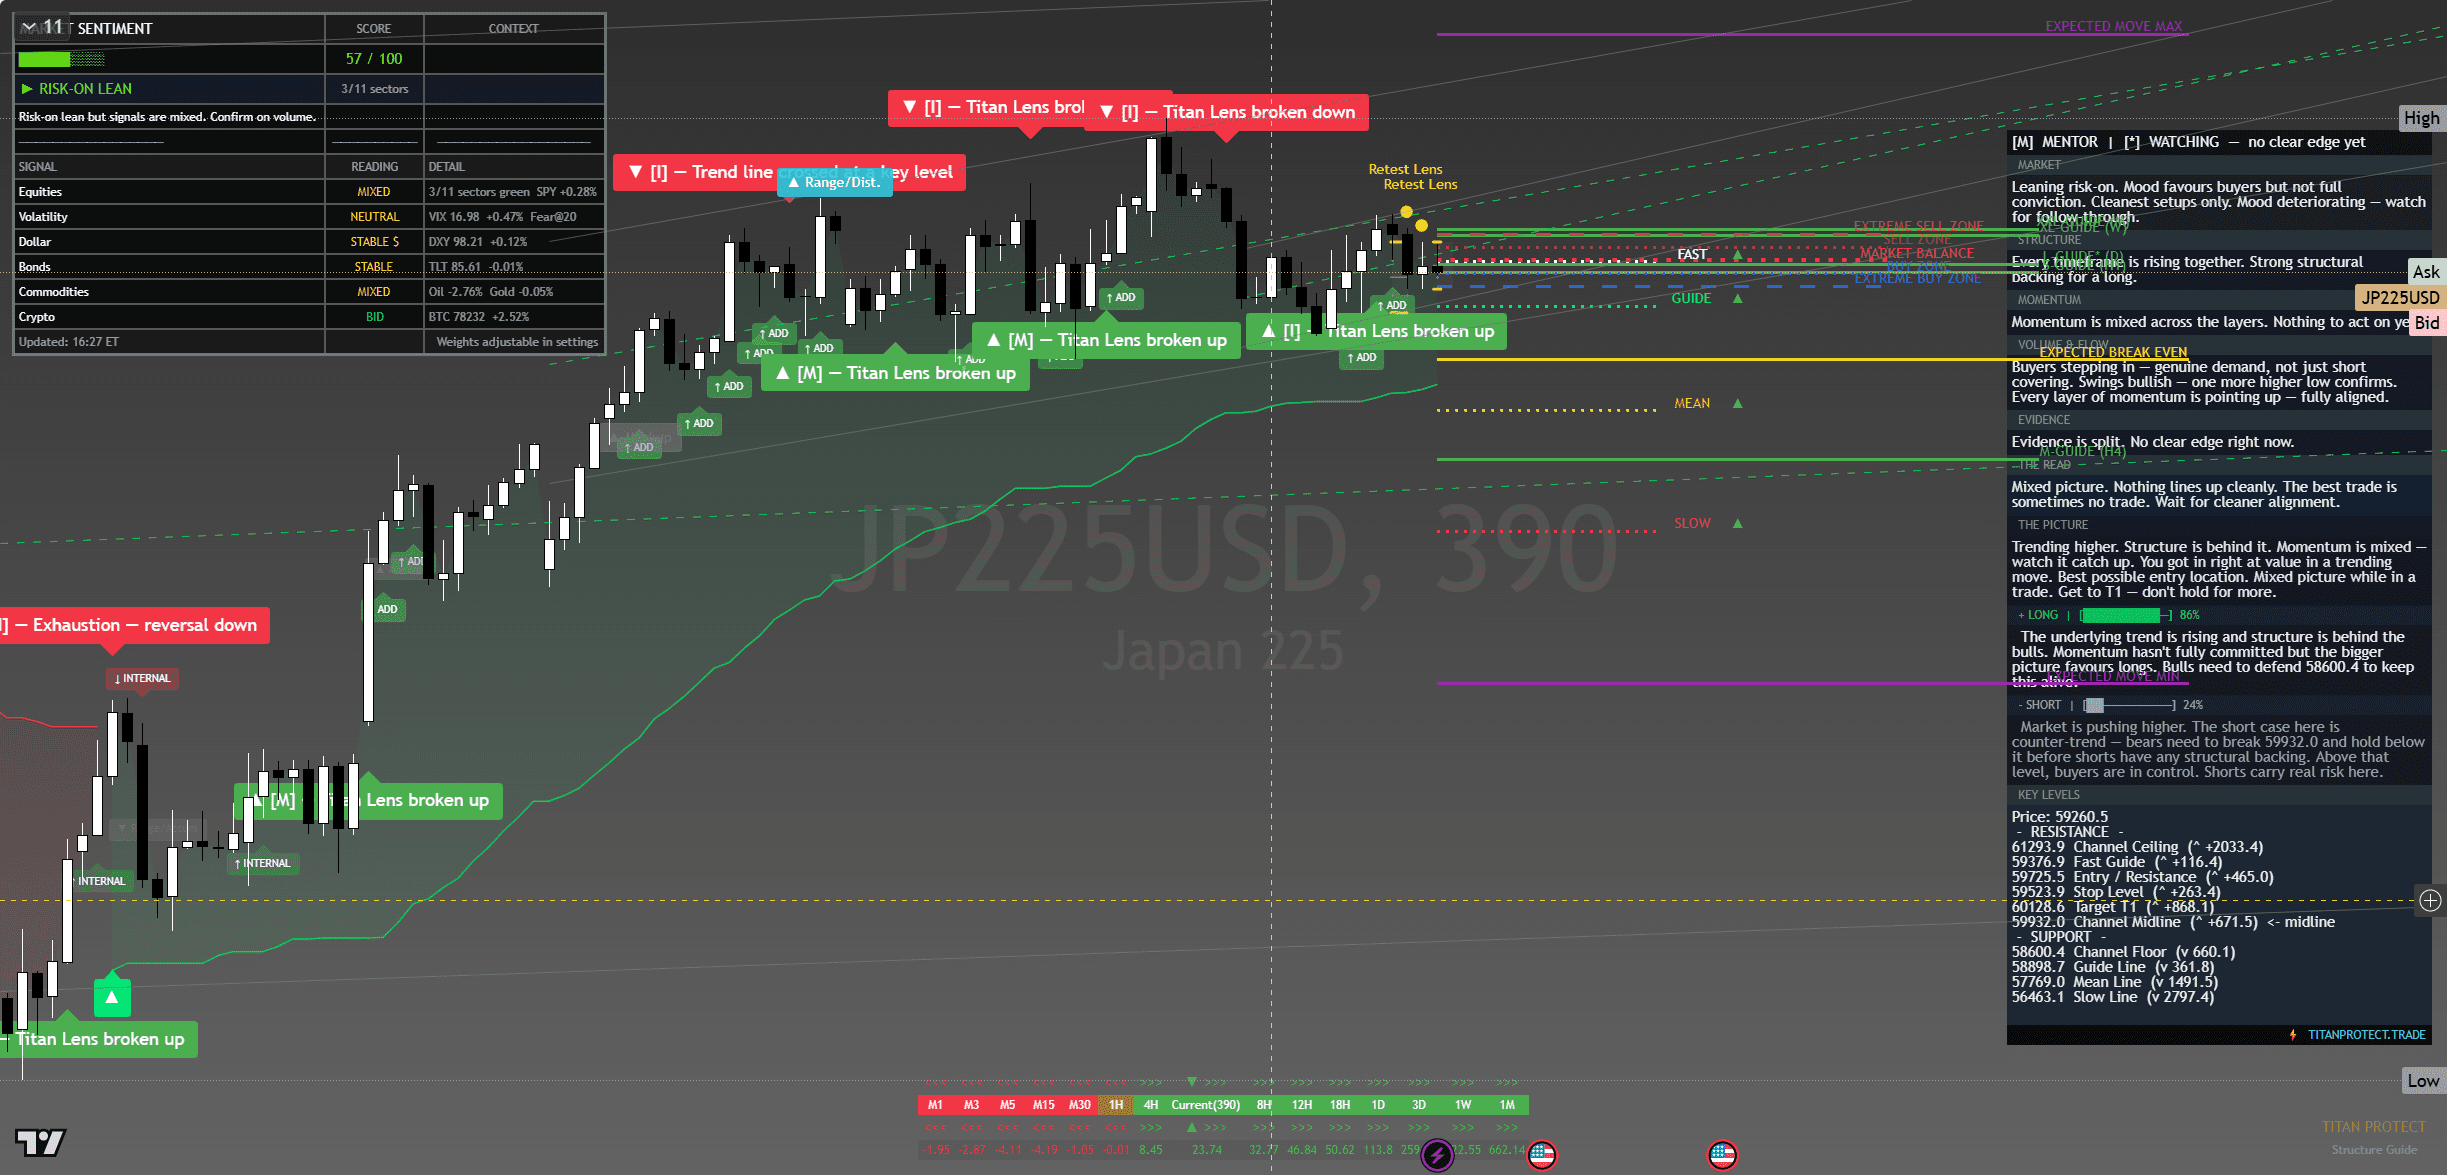
Nikkei 225 — chart with framework overlay. The Lens annotations show structural breaks, reversal triggers and confluence zones at the levels referenced below.
Where It Sits
Structure
Structurally the index is in a clear uptrend with higher highs and higher lows on daily and 4-hour timeframes since the April low. Friday’s close sits in the upper third of the recent range, holding above the rising 20-day MA. There is no distribution signal on the daily timeframe.
Momentum
Momentum is constructive without flagging exhaustion. The index has been climbing in an orderly fashion with no parabolic finish. Internal momentum readings sit in the upper half of their range — supportive of continuation rather than reversal.
Volume & Flow
Volume has been steady on the recent advance, with broad participation across exporters and tech names. Breadth is healthier than the recent trend would suggest — the index gains are not concentrated in just a few names. That is a structurally healthy posture.
Key Levels
| Level | Type | Significance | Action Zone |
|---|---|---|---|
| 60,200 | Resistance | Round number, prior all-time-high zone | Take profits if reached |
| 59,700 | Pivot | Friday intraday high cluster | Hold above = continuation |
| 59,513 | Friday close | Reference anchor | Bias line for Monday open |
| 59,000 | Support | Round number, retest level | Buy zone with defined stop |
| 58,500 | Major support | Multi-week range floor | Stop-out below for longs |
Three Scenarios Into Monday Open
Continuation
Index opens firm in Tokyo, follows US Friday close strength, takes 59,700 cleanly, runs to 60,000 round number. Tech and exporter leadership. Yen weakness supports the move.
Range
Index opens flat, churns 59,300-59,800 through the session. Magnet to Friday close. Tokyo follows the global mood without a domestic catalyst.
Mean Reversion
Index opens weak on yen strength or BoJ jawboning, fades to 59,000 support, holds. Mean-reversion within the uptrend.
Risk Score
Risk sits at Around 50% heading into Monday open.
Risk is moderate. The Nikkei carries dual sensitivity to US tech leadership and to USDJPY direction. Both are currently constructive — US tape strong, yen weak — but a sharp shift in either creates outsized index moves. Standard size with defined stops, watch the USDJPY tape for early warning of a regime shift.
How to Walk It
Entry / Stop / Target structure:
- Long 59,200-59,400 pullback | Stop 58,950 | Target 59,800 | R:R 2:1
- Long 59,750 breakout | Stop 59,500 | Target 60,200 | R:R 1.8:1
- Fade 60,300+ rejection | Stop 60,450 | Target 59,700 | R:R 4:1
Experience-level guidance:
Beginner: The Monday open after a Friday record close is exactly the situation where over-confidence costs money. Reduce size to half your standard. Trade only the cleanest setup from the entries above. If the tape opens against your bias, do nothing — wait for the second hour, when the institutional flow has tipped its hand.
Intermediate: Use the levels table to define the trading range. Fade the extremes with defined stops, take profits before the round-number resistance levels. Do not carry directional positions through the day if you cannot watch the tape — Monday opens are prone to fast reversals.
Advanced: The vol regime is supportive of trending moves. Defined-risk options structures around the key pivot levels capture the asymmetry cleanly. Keep notional small relative to your book — Monday after a record-close week is asymmetric speculation, not core positioning.
The Sunday Composite — How This Read Sits Inside The Cross-Asset View
This single-instrument framework read is one slice of the larger Sunday weekend synthesis. The composite takes positioning, macro, sentiment, volatility, sector dispersion and trade structure as separate analytical layers and arrives at a unified composite verdict for Monday open. Each layer below is unpacked in full.
Read the full composite for the cross-asset context driving this instrument:
The institutional positioning split — Asset Managers vs Leveraged Funds in size
PCE clearance and the macro case for Monday’s carry
The three-layer sentiment disagreement — surface greed, retail neutral, professionals hedged
The vol curve term structure and what VVIX is signalling
Sector dispersion and the breadth problem behind the record close
The Monday position-management playbook — sizing tiers and trade plans
Sunday Overwatch — the unified composite verdict
Continue Reading
The macro frame driving this read is unpacked in the weekend briefs:
Sunday Setup — Reading The Tape Into Monday Open
PCE Cleared, VIX Crushed, SPY Closed 720 — Friday Post-Close Recap
This analysis is for educational and informational purposes only. It does not constitute financial advice. Always manage your risk independently and in accordance with your own financial circumstances.