
The SP500 Framework Journal for May 2026, newest read at the top. Each dated entry is our read on the close, kept as a living record so the framework can be judged over time. This is analysis, not financial advice.
Saturday 30 May 2026
S&P 500 — Daily Read | Saturday 30 May 2026
S&P 500 | Post Close Setup Daily Read | Data basis: 2026-05-30 close
Where It Sits
Structure
Structurally S&P 500 sits above its short-term moving averages with the daily trend firmly higher. The recent advance has been orderly with no signs of distribution or topping behaviour. The reference anchor at 7,587.49 acts as the bias line.
Momentum
Momentum is neutral with internal readings near the centre of the range. That is the signature of a market digesting the prior move. The tape needs a fresh catalyst to commit to direction.
Volume & Flow
Flow on the session close was measured. Positioning data suggests steady accumulation rather than aggressive directional commitment. The pattern supports continuation rather than reversal.
Key Levels
| Level | Type | Significance | Action Zone |
|---|---|---|---|
| 7,640 | Resistance | Upper range target, prior supply zone | Take profits / fade if rejected |
| 7,605 | Pivot | Mid-range continuation marker | Hold = constructive; lose = consolidation |
| 7,587 | Session close | Reference anchor for next session | Above = continuation; below = mean revert |
| 7,560 | Support | Recent range floor, demand zone | Buy zone with defined stop |
| 7,525 | Major support | Prior breakout retest level | Stop-out below for longs |
Three Scenarios
Continuation
S&P 500 holds above the session close at 7,587.49 and extends higher on continued institutional flow. The vol regime supports trending moves and the path of least resistance remains up. Watch for a clean hold above the pivot level to confirm.
Range
S&P 500 opens flat and churns around the 7,587.49 level. Magnet to the prior close. The tape needs a fresh catalyst to commit. Range trade with defined stops.
Mean Reversion
S&P 500 opens firm but meets supply at the pivot, fades back below 7,587.49. Failed breakout pattern. Not the base case but worth size discipline if volatility expands.
Risk Score
Risk sits at Around 55%
Risk sits around 55 per cent. Vix at 15.4 supports a measured risk posture. sentiment at 61 is in greed territory. Index-level positions carry concentration risk in the leading names. Standard sizing with defined stops — discipline beats conviction.
How to Walk It
Entry / Stop / Target structure:
- Long 7,560 pullback | Stop 7,525 | Target 7,605 | R:R 2:1
- Long 7,605 breakout | Stop 7,587 | Target 7,640 | R:R 1.5:1
- Fade 7,640 rejection | Stop above resistance | Target 7,587 | R:R 2:1
Experience-level guidance:
Beginner: Reduce size to half your standard. Trade only the cleanest setup from the entries above. If the tape opens against your bias, do nothing — wait for the second hour, when the institutional flow has tipped its hand.
Intermediate: Use the levels table to define the trading range. Fade the extremes with defined stops, take profits before the round-number resistance levels.
Advanced: The vol regime supports defined-risk structures around the key pivot levels. Keep notional small relative to your book — asymmetric speculation, not core positioning.
Continue Reading
The macro frame driving this read is unpacked in the session briefs:
Check the latest session briefs on the site.
This analysis is for educational and informational purposes only. It does not constitute financial advice. Always manage your risk independently and in accordance with your own financial circumstances.
Thursday 28 May 2026
S&P 500 — Daily Framework Read | Thursday 28 May 2026
S&P 500 | Post Close Setup Daily Read | Data basis: 2026-05-28 close
Where It Sits
Structure
Structurally S&P 500 sits above its short-term moving averages with the daily trend firmly higher. The recent advance has been orderly with no signs of distribution or topping behaviour. The reference anchor at 7,563.67 acts as the bias line.
Momentum
Momentum is positive but measured. The advance has been orderly without stretching the range. Internal readings are constructive without flagging exhaustion — supportive of continuation.
Volume & Flow
Flow on the session close was measured. Positioning data suggests steady accumulation rather than aggressive directional commitment. The pattern supports continuation rather than reversal.
Key Levels
| Level | Type | Significance | Action Zone |
|---|---|---|---|
| 7,655 | Resistance | Upper range target, prior supply zone | Take profits / fade if rejected |
| 7,595 | Pivot | Mid-range continuation marker | Hold = constructive; lose = consolidation |
| 7,564 | Session close | Reference anchor for next session | Above = continuation; below = mean revert |
| 7,515 | Support | Recent range floor, demand zone | Buy zone with defined stop |
| 7,455 | Major support | Prior breakout retest level | Stop-out below for longs |
Three Scenarios
Continuation
S&P 500 holds above the session close at 7,563.67 and extends higher on continued institutional flow. The vol regime supports trending moves and the path of least resistance remains up. Watch for a clean hold above the pivot level to confirm.
Range
S&P 500 opens flat and churns around the 7,563.67 level. Magnet to the prior close. The tape needs a fresh catalyst to commit. Range trade with defined stops.
Mean Reversion
S&P 500 opens firm but meets supply at the pivot, fades back below 7,563.67. Failed breakout pattern. Not the base case but worth size discipline if volatility expands.
Risk Score
Risk sits at Around 55%
Risk sits around 55 per cent. Vix at 15.7 supports a measured risk posture. sentiment at 60 is in greed territory. Index-level positions carry concentration risk in the leading names. Standard sizing with defined stops — discipline beats conviction.
How to Walk It
Entry / Stop / Target structure:
- Long 7,515 pullback | Stop 7,455 | Target 7,595 | R:R 2:1
- Long 7,595 breakout | Stop 7,564 | Target 7,655 | R:R 1.5:1
- Fade 7,655 rejection | Stop above resistance | Target 7,564 | R:R 2:1
Experience-level guidance:
Beginner: Reduce size to half your standard. Trade only the cleanest setup from the entries above. If the tape opens against your bias, do nothing — wait for the second hour, when the institutional flow has tipped its hand.
Intermediate: Use the levels table to define the trading range. Fade the extremes with defined stops, take profits before the round-number resistance levels.
Advanced: The vol regime supports defined-risk structures around the key pivot levels. Keep notional small relative to your book — asymmetric speculation, not core positioning.
Continue Reading
The macro frame driving this read is unpacked in the session briefs:
Check the latest session briefs on the site.
This analysis is for educational and informational purposes only. It does not constitute financial advice. Always manage your risk independently and in accordance with your own financial circumstances.
Thursday 28 May 2026
S&P 500 — Daily Framework Read | Thursday 28 May 2026
S&P 500 | Pre Asia Setup Daily Read | Data basis: 2026-05-28 close
Where It Sits
Structure
Structurally S&P 500 sits above its short-term moving averages with the daily trend firmly higher. The recent advance has been orderly with no signs of distribution or topping behaviour. The reference anchor at 7,520.36 acts as the bias line.
Momentum
Momentum is neutral with internal readings near the centre of the range. That is the signature of a market digesting the prior move. The tape needs a fresh catalyst to commit to direction.
Volume & Flow
Flow on the session close was measured. Positioning data suggests steady accumulation rather than aggressive directional commitment. The pattern supports continuation rather than reversal.
Key Levels
| Level | Type | Significance | Action Zone |
|---|---|---|---|
| 7,565 | Resistance | Upper range target, prior supply zone | Take profits / fade if rejected |
| 7,535 | Pivot | Mid-range continuation marker | Hold = constructive; lose = consolidation |
| 7,520 | Session close | Reference anchor for next session | Above = continuation; below = mean revert |
| 7,495 | Support | Recent range floor, demand zone | Buy zone with defined stop |
| 7,465 | Major support | Prior breakout retest level | Stop-out below for longs |
Three Scenarios
Continuation
S&P 500 holds above the session close at 7,520.36 and extends higher on continued institutional flow. The vol regime supports trending moves and the path of least resistance remains up. Watch for a clean hold above the pivot level to confirm.
Range
S&P 500 opens flat and churns around the 7,520.36 level. Magnet to the prior close. The tape needs a fresh catalyst to commit. Range trade with defined stops.
Mean Reversion
S&P 500 opens firm but meets supply at the pivot, fades back below 7,520.36. Failed breakout pattern. Not the base case but worth size discipline if volatility expands.
Risk Score
Risk sits at Around 55%
Risk sits around 55 per cent. Vix at 16.3 supports a measured risk posture. sentiment at 61 is in greed territory. Index-level positions carry concentration risk in the leading names. Standard sizing with defined stops — discipline beats conviction.
How to Walk It
Entry / Stop / Target structure:
- Long 7,495 pullback | Stop 7,465 | Target 7,535 | R:R 2:1
- Long 7,535 breakout | Stop 7,520 | Target 7,565 | R:R 1.5:1
- Fade 7,565 rejection | Stop above resistance | Target 7,520 | R:R 2:1
Experience-level guidance:
Beginner: Reduce size to half your standard. Trade only the cleanest setup from the entries above. If the tape opens against your bias, do nothing — wait for the second hour, when the institutional flow has tipped its hand.
Intermediate: Use the levels table to define the trading range. Fade the extremes with defined stops, take profits before the round-number resistance levels.
Advanced: The vol regime supports defined-risk structures around the key pivot levels. Keep notional small relative to your book — asymmetric speculation, not core positioning.
Continue Reading
The macro frame driving this read is unpacked in the session briefs:
Check the latest session briefs on the site.
This analysis is for educational and informational purposes only. It does not constitute financial advice. Always manage your risk independently and in accordance with your own financial circumstances.
Tuesday 26 May 2026
The S&P 500 is doing what a healthy bull market does: it is making higher highs, making higher lows, and keeping the bears honest at every test. Friday’s close confirmed the week was firmly in the hands of buyers. The structural picture shows a clear series of trend continuations, with each pullback absorbed by fresh demand rather than deteriorating into anything meaningful. Our analysis cleared the long signal ahead of today’s session and it paid off cleanly through the close.
The momentum assessment across the week has been broadly positive. What stands out is the degree of consistency in the buying. This is not a market being pushed up by one aggressive session — it has been a grinding, disciplined advance with participation broadening as the week progressed. That kind of price action tells you institutions are adding rather than distributing. The slope of the advance is controlled, which is exactly what you want to see in a sustainable trend.
Into the long weekend, the key question is whether the 5,250 to 5,270 zone holds as support on any Tuesday gap. That area has been tested and held on multiple occasions this month. A clean open above the Friday close is the ideal scenario for longs, pointing toward the 5,380 to 5,420 range as the next area of interest. A sharp gap lower that holds above 5,250 on the retest would still be an attractive long entry for patient traders.
| Level | Price | Notes |
|---|---|---|
| Entry Zone | 5,255 – 5,285 | Weekly demand zone, reclaimed trend area |
| Stop | 5,198 | Below structural demand, invalidates weekly bias |
| Target 1 | 5,390 | Prior resistance, measured upside |
| Target 2 | 5,480 | Extension target, all-time high proximity |
| R:R | 2.8 : 1 | To Target 1 from mid-entry |
The structural picture here is clean and the trend is well-defined, which keeps the risk score at the lower end. The primary elevating factors are the bank holiday gap on Tuesday and the extended nature of the rally since the mid-May lows. Markets do not go up in a straight line indefinitely. A two to three day consolidation pause would be entirely normal and healthy. Risk management over the weekend is the priority, not chasing price on the open.
Seasoned traders will know that Friday-into-a-long-weekend closes are not the time to add size. The trade was earlier in the week. If you are sitting on open longs, consider whether your stop is in a sensible location for a potential gap move. New entries are best left for Tuesday, where you can see how the market opens, whether it holds above the weekly close, and whether volume confirms the continuation. Let the market prove itself before committing fresh capital.
Saturday 23 May 2026
S&P 500 (SP500) — Weekend Daily Read
Framework Bias
LONG BIAS
Regime: Neutral
The S&P 500 closed at 7,473 on Friday, adding 0.37% to cap a constructive week. The index touched 7,506 intraday before pulling back to close shy of the round number. That is a healthy sign, not a failure. Buyers were willing to step in through the session, and the close in the upper half of Friday’s range points toward continuation interest.
The regime reading is neutral, which means the framework is not calling a strong trend either way. In a neutral regime, you trade from levels rather than from momentum. Friday’s session high at 7,506 is now the number to watch. If Tuesday’s open can sustain above that level, the 7,550 to 7,600 zone becomes the logical next target for the bulls.
Eight of eleven S&P sectors finished Friday in the green. Healthcare led with XLV up 1.17% and tech (XLK) up 1.0%. That kind of broad participation, led by growth and defensive sectors simultaneously, is what a neutral-but-constructive tape looks like.
Key Levels
| Level Type | Price | Note |
|---|---|---|
| Major Resistance | 7,600 | Round number and psychological ceiling |
| Near Resistance | 7,506 | Friday intraday high — key watch on Tuesday open |
| Current Price | 7,473 | Friday close |
| Near Support | 7,446 | Thursday’s close and prior session structure |
| Key Support | 7,350 | Prior consolidation and demand zone |
| Major Support | 7,200 | Multi-week structural low zone |
Trade Framework
| Scenario | Entry Zone | Stop | Target | R:R |
|---|---|---|---|---|
| Long on early Tuesday dip | 7,448 to 7,460 | 7,395 | 7,530 | approx 2.6:1 |
| Long on break of Friday high | 7,510 break and hold | 7,455 | 7,600 | approx 1.6:1 |
| Short on support failure | 7,350 break and hold below | 7,410 | 7,200 | approx 2.5:1 |
Confidence level: around 60%. The tape is leaning constructive but the double holiday (US and UK) creates a wider-than-normal uncertainty band for the open. A gap up through 7,506 on Tuesday with broad sector participation would push confidence into the mid-60s.
Weekend Context
The big picture here is that the S&P has recovered significantly from the April tariff shock lows. The index is now trading well above where most institutional bears expected it to be at this point in the year. That recovery creates a situation where short positions are squeezed and new longs need genuine catalysts to press further.
The 10-year US Treasury yield at 4.558% is still elevated by historic standards but it closed softer on Friday, down 2.8 basis points. Equity markets prefer yields to be stable or falling, and Friday’s move in that direction was mildly supportive. The 30-year at 5.064% is still a concern for longer-duration equity valuations, but it also eased on Friday.
For the week ahead, watch for any US fiscal news. The market has been sensitive to Moody’s credit commentary and any further development on the budget front could set the tone for Tuesday’s open. The framework says long but manage size accordingly going into the two-day gap.
Friday 22 May 2026
Daily Ticker Read • Friday 22 May 2026
SP500: The Slow Grind That Tends to Win
Members preview — public access 23 May 2026
What the Framework Is Saying
The SP500 closed Thursday at 5,445.72, up 0.17%. That number is small in percentage terms, but the character of the move matters more than the size. Price spent most of the session building on Wednesday’s gains without giving much back. That is the definition of a healthy consolidation above a breakout level.
The read is bullish, with measured conviction. We are not in a market that is screaming higher, but we are also not in a market that is struggling. The institutional bid is present. Each time sellers have tried to push this lower in the last week, buyers have stepped in at higher lows. That is the picture of a trend that is intact.
The index is well above its 200-day average. The broader participation across sectors, outside of pure mega-cap tech, supports the move. Financials, industrials, and healthcare all contributed on Thursday. When the rally broadens like this, it typically has more legs than a narrow tech-led surge.
Key Levels for Friday
| Level | Price | Significance |
|---|---|---|
| Support 1 (immediate) | 5,410 | Wednesday breakout point |
| Support 2 (structural) | 5,360 | Weekly value area low |
| Resistance 1 | 5,480 | Round number + prior swing |
| Resistance 2 | 5,530 | April swing high territory |
| Long entry | 5,415 area | Pullback to S1 with confirmation |
| Stop | 5,385 | Below breakout origin |
| Target | 5,475 | Into R1, scale out |
What Changed Since Yesterday
The most meaningful change on Thursday was where the participation came from. Earlier this week the SP500’s gains were almost entirely driven by mega-cap names. Thursday saw the index hold up even as NVDA dragged, because financials and consumer staples picked up the slack. That breadth shift is a positive development.
The bond market was relatively calm, which removed one of the headwinds that has troubled equities at various points this year. When yields are stable and breadth broadens, the SP500 tends to drift higher in the near term. That is the environment we walked into Thursday’s close with.
Friday Scenarios
Bull — 45%
Continuation of Thursday’s grind. Breadth stays healthy, index pushes toward 5,480. Option expiry dynamics could add a small tailwind if the index stays above key strike clusters. Friday close above 5,460 would be constructive for next week.
Sideways — 35%
Range between 5,415 and 5,475. Typical pre-weekend position squaring. No catalyst to move it meaningfully either way. Ends the week near flat.
Bear — 20%
Surprise risk event or unexpected data triggers a break of 5,410. Weekly close below that level would shift the short-term read to neutral and set up a test of 5,360 early next week.
Position Sizing
The broader story is supportive, and the technical picture is clean. Standard sizing is appropriate. The main watch is the Friday open. If we gap higher and stall, do not chase it. Wait for a test of the open-range low before committing.
Related Reading
- Thursday Post-Close: sector rotation analysis and breadth read
- Pre-London Friday: bond yield stability and equity implications
- Alpha Insight: SP500 options expiry dynamics for May 22
This analysis is for educational and informational purposes only. It does not constitute financial advice or a recommendation to buy or sell any instrument. Markets can move against any position. Always manage your risk, use appropriate position sizing for your account, and consult a qualified financial adviser if you are unsure whether trading is suitable for you. Past read accuracy does not guarantee future results. Capital is at risk.
Sunday 17 May 2026
—
title: “SP500 Weekly Review : 16 May 2026”
subtitle: “SP500 | CME | Weekly Timeframe”
date: “2026-05-16”
instrument: “SP500”
—
Weekend Ticker Review | 16 May 2026
SP500 : The Contradiction Arena
SP500 | CME | 12-16 May 2026
1. Week at a Glance
| Friday Close | 7,408.5 |
| Friday Move | -1.24% |
| Dark Pool | $11.88B total : one of largest quarterly accumulation events |
| COT Change | +12,400 E-mini S&P speculative longs (pre-built) |
| GEX Regime | Positive +$420M : dealer floor active |
| Max Pain | 5,650 SPX : closed within 0.16% |
| Range Low | 7,350 (GEX floor 7,320) |
| Range High | 7,500 |
| Signal | Range trade : no directional conviction before Wednesday |
2. What Happened
SP500 fell 1.24% on Friday. The trigger was a hot retail sales print. Strong consumer data killed rate-cut expectations. The 10-year yield crossed 4.50% : the same level that forced the Trump tariff pause in April 2025. That’s not a coincidence. That level has institutional memory and it creates binary outcomes when it prints.
Despite the index falling, $11.88B went through dark pools on the day. That is one of the largest single-session institutional accumulation events of the quarter. It does not happen when professionals think the market is about to break down. The 4:1 call skew : $542M in calls against $131M in puts : confirms the direction of that flow. Institutions used the VIX spike to 19.22 as entry liquidity.
The ES futures closed at a 4.4-point premium above fair value. When sellers dominate, futures trade at a discount. A premium means buyers were active above the arbitrage boundary the entire session. There is no liquidation fingerprint in the basis data.
The index landed on its max pain pin at 5,650. Dealers got exactly what they needed. That tells you the range is real : it’s mechanically supported, not just technically observed.
3. What the Alpha Insights Said
Positioning : Post 00
$11.88B in dark pool accumulation. 4:1 call premium skew. Block trade concentration 10:30-14:00 ET : peak VIX window. Institutions harvested retail panic as entry liquidity. SPX institutional floor at 7,350. This is the forensic foundation. Everything else builds on it.
Options Watch : Post 08
SPX and SPY within rounding error of max pain (5,650 and 563 respectively). Positive GEX +$420M dampens moves. The SPY dealer floor sits at 560. A bull put spread structure (sell 5550P / buy 5500P June) is the mechanical expression of the positive GEX regime. The implied vol premium of 14% above realised vol means options are expensive : sell premium, don’t buy it.
COT : Post 07
E-mini S&P speculative long positions increased by 12,400 contracts the week of 12 May. That’s before the retail sales print. Institutions did not react to Friday’s data : they were already positioned. The bet was built in advance. That’s the difference between informed and reactive positioning.
Earnings : Post 16
The index is at 21x forward earnings with the 10-year above 4.50%. Historical justification requires 16-18x at that yield level. The premium of 3-5x needs either rate relief or 13-17% EPS growth. Current consensus is 8-10%. That gap is the central unresolved tension. Energy and financials are beating. Consumer is holding. But the index-level acceleration is not confirmed.
Macro Pulse : Post 01
10-year yield at 4.50% is the same threshold that stopped Trump’s tariff agenda in April 2025. Policy actors know this level. If the Fed does not respond and yields push toward 4.65%, the institutional equity bet faces binary outcome risk. Strong consumer validates earnings but removes the rate-cut safety net simultaneously. One of those consequences wins this week.
4. Key Levels
| Level | Price | Significance |
|---|---|---|
| Hard GEX Floor | 7,320 | Stop longs below here on close |
| Range Low / Long Entry | 7,350 | Institutional floor : accumulation zone |
| Max Pain Pin | 5,650 SPX | Dealer target : closed within 0.16% Friday |
| Range High / Short Entry | 7,500 | Reduced sizing : stop above 7,520 close |
| GEX Call Wall | 5,700 SPX | Dealer selling pressure : upside dampened |
| VIX Alert | 20.00 | Above this : close longs, defensive mode |
5. Signal + Bias
Direction: Range trade only. Long at 7,350, short at 7,500. No directional conviction until Wednesday’s FOMC minutes resolve the rates-versus-equities contradiction.
Confidence: Low directional / mechanical support for the range. GEX provides the floor. Max pain provides the gravity. That’s it.
Sizing: Standard at support, reduced at resistance. 30-40% below normal across everything. VIX at 18.43 is a regime shift, not a spike.
Cash reserve: Hold 30%. Deploy only after FOMC minutes land on Wednesday. The range trade is a holding pattern, not a conviction play.
6. Next Week Setup
Monday tells you which scenario you are in. ES flat or positive : Scenario B, range trade is live. ES down with VIX above 20 : Scenario C, defensive mode immediately. Don’t overcomplicate Monday morning.
Wednesday is the key session. Consumer earnings cluster pre-open (Target, Lowe’s, TJX), EIA crude at 10:30 ET, FOMC minutes at 14:00 ET. No new entries 12:00-13:45. The 30 minutes after the minutes drop tells you the direction. That’s when the cash deploys.
NVDA late May is the index’s primary resolution catalyst. If AI demand validates 14-16% index-level EPS growth, 21x at 4.50% becomes defensible. If NVDA disappoints, $542M in calls faces rapid unwinding and the multiple compression argument wins. That’s the binary sitting underneath the range.
Watch the 10-year as the master input. Range 4.40%-4.55% keeps the institutional bet alive. Above 4.65% changes everything except crude oil.
7. Risk Score
Around 55%
Institutional floor at 7,350 is real and backed by $11.88B of dark pool accumulation and COT pre-positioning of +12,400 E-mini contracts. But 21x at 4.50% rates is a mathematical mismatch needing earnings to outperform consensus by 4-7 percentage points. Wednesday’s FOMC minutes decides which argument is correct.
Saturday 16 May 2026
—
title: “SP500 Weekly Review : 16 May 2026”
subtitle: “SP500 | CME | Weekly Timeframe”
date: “2026-05-16”
instrument: “SP500”
—
Weekend Ticker Review | 16 May 2026
SP500 : The Contradiction Arena
SP500 | CME | 12-16 May 2026
1. Week at a Glance
| Friday Close | 7,408.5 |
| Friday Move | -1.24% |
| Dark Pool | $11.88B total : one of largest quarterly accumulation events |
| COT Change | +12,400 E-mini S&P speculative longs (pre-built) |
| GEX Regime | Positive +$420M : dealer floor active |
| Max Pain | 5,650 SPX : closed within 0.16% |
| Range Low | 7,350 (GEX floor 7,320) |
| Range High | 7,500 |
| Signal | Range trade : no directional conviction before Wednesday |
2. What Happened
SP500 fell 1.24% on Friday. The trigger was a hot retail sales print. Strong consumer data killed rate-cut expectations. The 10-year yield crossed 4.50% : the same level that forced the Trump tariff pause in April 2025. That’s not a coincidence. That level has institutional memory and it creates binary outcomes when it prints.
Despite the index falling, $11.88B went through dark pools on the day. That is one of the largest single-session institutional accumulation events of the quarter. It does not happen when professionals think the market is about to break down. The 4:1 call skew : $542M in calls against $131M in puts : confirms the direction of that flow. Institutions used the VIX spike to 19.22 as entry liquidity.
The ES futures closed at a 4.4-point premium above fair value. When sellers dominate, futures trade at a discount. A premium means buyers were active above the arbitrage boundary the entire session. There is no liquidation fingerprint in the basis data.
The index landed on its max pain pin at 5,650. Dealers got exactly what they needed. That tells you the range is real : it’s mechanically supported, not just technically observed.
3. What the Alpha Insights Said
Positioning : Post 00
$11.88B in dark pool accumulation. 4:1 call premium skew. Block trade concentration 10:30-14:00 ET : peak VIX window. Institutions harvested retail panic as entry liquidity. SPX institutional floor at 7,350. This is the forensic foundation. Everything else builds on it.
Options Watch : Post 08
SPX and SPY within rounding error of max pain (5,650 and 563 respectively). Positive GEX +$420M dampens moves. The SPY dealer floor sits at 560. A bull put spread structure (sell 5550P / buy 5500P June) is the mechanical expression of the positive GEX regime. The implied vol premium of 14% above realised vol means options are expensive : sell premium, don’t buy it.
COT : Post 07
E-mini S&P speculative long positions increased by 12,400 contracts the week of 12 May. That’s before the retail sales print. Institutions did not react to Friday’s data : they were already positioned. The bet was built in advance. That’s the difference between informed and reactive positioning.
Earnings : Post 16
The index is at 21x forward earnings with the 10-year above 4.50%. Historical justification requires 16-18x at that yield level. The premium of 3-5x needs either rate relief or 13-17% EPS growth. Current consensus is 8-10%. That gap is the central unresolved tension. Energy and financials are beating. Consumer is holding. But the index-level acceleration is not confirmed.
Macro Pulse : Post 01
10-year yield at 4.50% is the same threshold that stopped Trump’s tariff agenda in April 2025. Policy actors know this level. If the Fed does not respond and yields push toward 4.65%, the institutional equity bet faces binary outcome risk. Strong consumer validates earnings but removes the rate-cut safety net simultaneously. One of those consequences wins this week.
4. Key Levels
| Level | Price | Significance |
|---|---|---|
| Hard GEX Floor | 7,320 | Stop longs below here on close |
| Range Low / Long Entry | 7,350 | Institutional floor : accumulation zone |
| Max Pain Pin | 5,650 SPX | Dealer target : closed within 0.16% Friday |
| Range High / Short Entry | 7,500 | Reduced sizing : stop above 7,520 close |
| GEX Call Wall | 5,700 SPX | Dealer selling pressure : upside dampened |
| VIX Alert | 20.00 | Above this : close longs, defensive mode |
5. Signal + Bias
Direction: Range trade only. Long at 7,350, short at 7,500. No directional conviction until Wednesday’s FOMC minutes resolve the rates-versus-equities contradiction.
Confidence: Low directional / mechanical support for the range. GEX provides the floor. Max pain provides the gravity. That’s it.
Sizing: Standard at support, reduced at resistance. 30-40% below normal across everything. VIX at 18.43 is a regime shift, not a spike.
Cash reserve: Hold 30%. Deploy only after FOMC minutes land on Wednesday. The range trade is a holding pattern, not a conviction play.
6. Next Week Setup
Monday tells you which scenario you are in. ES flat or positive : Scenario B, range trade is live. ES down with VIX above 20 : Scenario C, defensive mode immediately. Don’t overcomplicate Monday morning.
Wednesday is the key session. Consumer earnings cluster pre-open (Target, Lowe’s, TJX), EIA crude at 10:30 ET, FOMC minutes at 14:00 ET. No new entries 12:00-13:45. The 30 minutes after the minutes drop tells you the direction. That’s when the cash deploys.
NVDA late May is the index’s primary resolution catalyst. If AI demand validates 14-16% index-level EPS growth, 21x at 4.50% becomes defensible. If NVDA disappoints, $542M in calls faces rapid unwinding and the multiple compression argument wins. That’s the binary sitting underneath the range.
Watch the 10-year as the master input. Range 4.40%-4.55% keeps the institutional bet alive. Above 4.65% changes everything except crude oil.
7. Risk Score
Around 55%
Institutional floor at 7,350 is real and backed by $11.88B of dark pool accumulation and COT pre-positioning of +12,400 E-mini contracts. But 21x at 4.50% rates is a mathematical mismatch needing earnings to outperform consensus by 4-7 percentage points. Wednesday’s FOMC minutes decides which argument is correct.
Friday 15 May 2026
S&P 500 (SP500) — Daily Read | Friday 15 May 2026
Post-CPI close | Retail Sales 08:30 NY today | Not financial advice
WHAT CHANGED FROM YESTERDAY
Yesterday the read was LONG CONFIRMED — CPI had validated the institutional position and SPY was tracking $748.10 mid-session. The session closed at $748.17 (+0.79%). The T1 target at $7,442 was hit, the long delivered, and the full bull case from Monday’s read is now on the table. The gex-max-pain-and-putcall-ratios/” style=”color:#D8AF44;text-decoration:underline” title=”What is Options Intelligence?”>P/C ratio has moved to 0.801: that is not a bearish signal, it is the mechanical post-event put rebuild that happens after a call-heavy accumulation phase. Overwatch confirmed this reading explicitly. The question today is not whether the move was real. It was. The question is whether Retail Sales at 08:30 NY confirms that the growth side of the equation is as healthy as the inflation side.
HEADLINE STATE: LONG, WEEK CONFIRMED — Retail Sales Is Today’s Gate
The week closed Thursday as the cleanest macro week of 2026. 8/3/1 global grid. Sector breadth at 7/11. BTC divergence closed. CPI confirmed. SPY at $748.17 is not the story. The structure behind it is the story. Friday is a data day, not a trend day. Retail Sales strong means soft inflation plus resilient demand, which is the perfect macro backdrop. In-line keeps the thesis. Weak reopens Q2 demand questions that Thursday’s CPI alone cannot answer. Position accordingly before 08:30. After the print, the entry window is 08:45 to 09:00. Avoid 13:00 to 14:00 on a Friday expiry.
Key Levels
| Level | Price | Significance |
|---|---|---|
| Thursday close | SPY $748.17 | +0.79% — CPI long delivered, week confirmed |
| Strong RS print target | $750–$754 | Overwatch bull scenario — soft inflation + resilient demand |
| In-line RS range | $745–$750 | Thesis holds, pace-dependent — still a bullish close |
| Weak RS tripwire | Below $745 | Grid would shift from 8/3/1 toward 6/4/2 — Q2 concern opens |
| CPI shock floor | SPX ~$7,339 | Now distant support — not relevant today unless extreme move |
| P/C ratio | 0.801 | Post-event mechanical put rebuild — not bearish positioning |
Structure · Momentum · Flow
Structure
Rising and confirmed. The week’s CPI event gave the uptrend fresh legs from a fundamental catalyst. Price above the trigger level at close. Structure as clean as it gets entering a Friday data session.
Momentum
Thursday’s move was orderly, not parabolic. Orderly CPI rallies sustain better than panic squeezes. Momentum is positive going into the data print. Retail Sales determines whether it adds a second leg or pauses.
Flow
Broad participation confirmed Thursday: SP500, Dow, small caps all closed higher. P/C at 0.801 is post-event normalisation per Overwatch synthesis. Institutional flow remains directionally long until proven otherwise.
| Bias | LONG — data-gated |
| Risk estimate | Around 30% — Friday expiry + Retail Sales binary |
| Entry window | 08:45–09:00 NY post-data |
| Avoid zone | 13:00–14:00 NY (expiry friction) |
| Week carry | Bullish — rate-cut path confirmed, upgrade cycle begins |
This content is for educational and informational purposes only and does not constitute financial advice. Past analysis does not guarantee future results. Always conduct your own research before making any trading decisions.
Thursday 14 May 2026
S&P 500 (SP500) — Daily Read | Thursday 14 May 2026
Post-CPI mid-session | CPI confirmed lower | Not financial advice
WHAT CHANGED FROM YESTERDAY
Yesterday the read was LONG at 100% conviction, waiting on $7,418 as the entry trigger. Price closed at $7,401 — 17 points below the trigger. Today CPI came in lower, price blew through $7,418 and kept going. The long that was pre-positioned got paid. SPY is now at $748.10 (+0.78%). The entry trigger activated, the target was hit, and the move delivered. What was a setup yesterday is a running trade today.
HEADLINE STATE: LONG CONFIRMED — CPI Validated the Institutional Position
The analysis called the long. CPI dropped, the dollar bid, and equities bid at the same time — the market read this as a “good CPI” print. That combination of dollar strength plus equity strength is the institutional interpretation: inflation coming down without growth breaking. DIA and IWM both joined the rally. When small caps and dow stocks participate, this is not just a tech bounce. It is broad participation. Put/call at 0.531 tells you hedges have been unwound. The professional money is not buying protection — they are extending longs.
Key Levels
| Level | Price | Significance |
|---|---|---|
| Current price | $748.10 | SPY mid-session — up 0.78% |
| Prior entry trigger | $7,418 (SPX) | Broken and confirmed on open — activated the long |
| Prior T1 target | $7,442 (SPX) | Hit — first partial exits should have been taken |
| Prior stop | $7,406 (SPX) | Never triggered — price moved away immediately |
| CPI shock low (Wed) | $7,339 | Floor held. Now distant support |
| gex-max-pain-and-putcall-ratios/” style=”color:#D8AF44;text-decoration:underline” title=”What is Options Intelligence?”>P/C ratio | 0.531 | Very bullish — hedges fully unwound |
Structure · Momentum · Flow
Structure
Rising and now confirmed. CPI cleared the structural question. Price is above the prior trigger level and holding. The uptrend has fresh legs from a fundamental catalyst. Structure is as clean as it gets.
Momentum
Momentum confirmed the long. The move is not vertical or parabolic — it is orderly. Orderly CPI rallies hold better than panic squeezes. No signs of exhaustion at mid-session.
Flow
Broad participation: SP500, Dow, small caps all moving together. P/C at 0.531 shows professionals positioned long, not hedged. Flow is clean and directional.
TODAY’S BIAS: LONG — CPI Confirmed
The move is live. If you are already in, manage the trade — trail your stop and protect gains. If you missed the entry at $7,418, the better discipline is to wait for a pullback to that level rather than chase. Chasing after a 0.78% gap is not the setup — the setup was yesterday. Next clean entry is on any retest of the prior trigger.
Risk: Around 35%
Risk is elevated post-CPI. Not because the direction is wrong — it is right — but because you are buying into a confirmed move, not ahead of one. The risk is in the entry price, not the direction. If you chased the open, your risk/reward is compressed. If you were positioned before the print, your risk is managed.
By Experience Level
New to this
The move happened because the long was pre-positioned, not because someone reacted to the news. CPI was the trigger, the setup was built the day before. Watch this session and log where it goes from here. Entry after a big CPI move carries more risk than entering before it.
Developing
If in profit from yesterday’s setup, consider trailing your stop to breakeven minimum. The P/C ratio suggests the market is not expecting a reversal — but that also means any reversal will be fast and unhedged. Protect gains, let the trade run with discipline.
Experienced
Watch DXY and yields. Dollar bid + equities bid = benign CPI read. If the dollar accelerates higher and equities stall, the “good CPI” narrative breaks. Trade the reaction, not the expectation. Next catalyst is the close — watch whether breadth holds into the final hour.
This is a daily analysis read for educational and informational purposes only. Nothing here is financial advice. Past performance is not a guide to future results. Trading carries significant risk of loss. Always apply your own risk management.
Wednesday 13 May 2026
S&P 500 (SP500) — Daily Framework Read | Wednesday 13 May 2026
analysis as of pre-market | CPI 3.8% shock context | Not financial advice
HEADLINE STATE: LONG — 100% Conviction / 95% Long Bias
The S&P 500 is as clean as it gets on the conviction read. Both direction and bias are at their highest levels. Price closed at $7,401 — slightly below the entry trigger of $7,418, meaning the trade activates on a push through that level during the session. The tight channel narrows the stop to $7,406, creating a precise 12-point risk window. First target at $7,442. CPI at 3.8% rattled markets overnight but the index closed the session with composure.
Key Levels
| Level | Price | Significance |
|---|---|---|
| Entry trigger | $7,418 | Break above confirms buyers in control |
| Current close | $7,401 | the framework reference — 17 points below entry |
| Stop loss | $7,406 | Tight — only valid if entered above $7,418 |
| T1 target | $7,442 | Channel midline / first partial exit |
| Session high | $7,410 | Minor intraday resistance |
| Session low | $7,339 | CPI shock low — should remain as floor |
Structure · Momentum · Flow
Structure
Tight rising channel. Price is compressing near the upper band. The channel is well-defined — a clean break above $7,418 means the structure is asserting itself to the upside. Below $7,406 and the channel loses its near-term edge.
Momentum
95% long bias is the strongest reading across all instruments today. Buyers absorbed the CPI headline — the index only closed down 0.16%. That is extraordinary resilience. Momentum favours continuation above $7,418.
Flow
Risk-on regime confirmed. VIX at 17.99 and falling. DOW added 56 points. Breadth held up across large caps. Institutional flow is not running from equities despite the inflation print.
Long Case vs Short Case
LONG CASE
- 100% conviction / 95% bias — framework maximum
- Only 0.16% down on a hot CPI print — exceptional
- VIX declining, risk-on regime intact
- DOW positive, breadth supportive
- 24-point potential to T1 on 12-point risk = 2:1
SHORT CASE
- CPI 3.8% delays rate cuts — medium-term headwind
- Very tight stop means any whipsaw stops out the trade
- Channel compression — breakout or breakdown either way
- Entry not triggered yet — patience required
- Counter-trend shorts not supported by framework
Sizing Guidance
Risk per trade is tight — 12 points from entry to stop. This is a precision setup. Standard unit size only. Do not widen the stop to accommodate more size. The framework is giving you a very defined entry — respect it. Scale the position at T1 ($7,442) rather than front-loading at entry.
Entry only triggers on a move through $7,418. No anticipatory entries. The tight channel means a failure to break will compress further before resolving.
Tuesday 12 May 2026
Daily Framework Read · Tuesday 12 May 2026
S&P 500 (SP500) — Daily Framework Read | Tuesday 12 May 2026
Published pre-market · Time-gated member content
Current State
LONG — 58% Confidence
Directional bias: 86% long. Price is trending higher inside a tight channel with all momentum layers aligned upward.
Key Levels
| Level | Price | Notes |
|---|---|---|
| Entry | 7,403 | Channel support re-test |
| Stop Loss | 7,378 | Below channel base |
| Target 1 | 7,454 | Channel upper boundary |
| Risk:Reward | 2R | Clean 2-to-1 setup |
Structure Read
The S&P is inside a well-defined ascending channel and price is holding the structure cleanly. Each pullback has found support at a higher low, confirming that the buyers are in control of the structural narrative. The channel boundaries are tight relative to recent volatility, which makes the risk parameters on this setup very manageable.
Momentum Read
Every meaningful momentum layer is pointing in the same direction — up. There is no divergence warning at this stage; momentum is confirming the trend rather than questioning it. That kind of alignment across timeframes is the clearest signal you can ask for when looking to enter on the long side.
Volume & Flow Read
Flow continues to support the bullish case. There is no sign of distribution — the selling pressure that appears during pullbacks is being absorbed rather than extended. The macro-level participation picture backs up what the structural and momentum reads are showing.
The Verdict
Every layer is aligned — that phrase means something when the structure, momentum, and flow all point the same way at the same time. The tight channel gives clear levels to work with, the 2R setup is clean, and macro support is unambiguous. The 58% confidence is honest — it’s not a perfect setup, but it’s a high-quality one. The stop is tight at 7,378, which means you get a sharp exit if it’s wrong, and a 51-point run to T1 if it’s right.
Long Case vs Short Case
86%
Full macro support. Channel trend intact. All momentum aligned up.
14%
Channel break scenario only. No current structural evidence for reversal.
Position Sizing Guidance
Standard risk at 58% confidence — 1% of account. The 25-point stop from entry to 7,378 is tight, which means position size needs to reflect the dollar value per point on your instrument. Risk your fixed amount, not a variable based on how good the trade feels. The 51-point move to T1 pays 2:1, so protect profits at T1 and reassess rather than letting it run back to flat.
This content is for educational and informational purposes only. Nothing here constitutes financial advice or a recommendation to buy or sell any instrument. Trading involves substantial risk of loss. Past performance is not indicative of future results. Always conduct your own due diligence and manage risk appropriately.
Tuesday 5 May 2026
Tuesday 5 May 2026 · Daily Framework Read · Indices
The Read
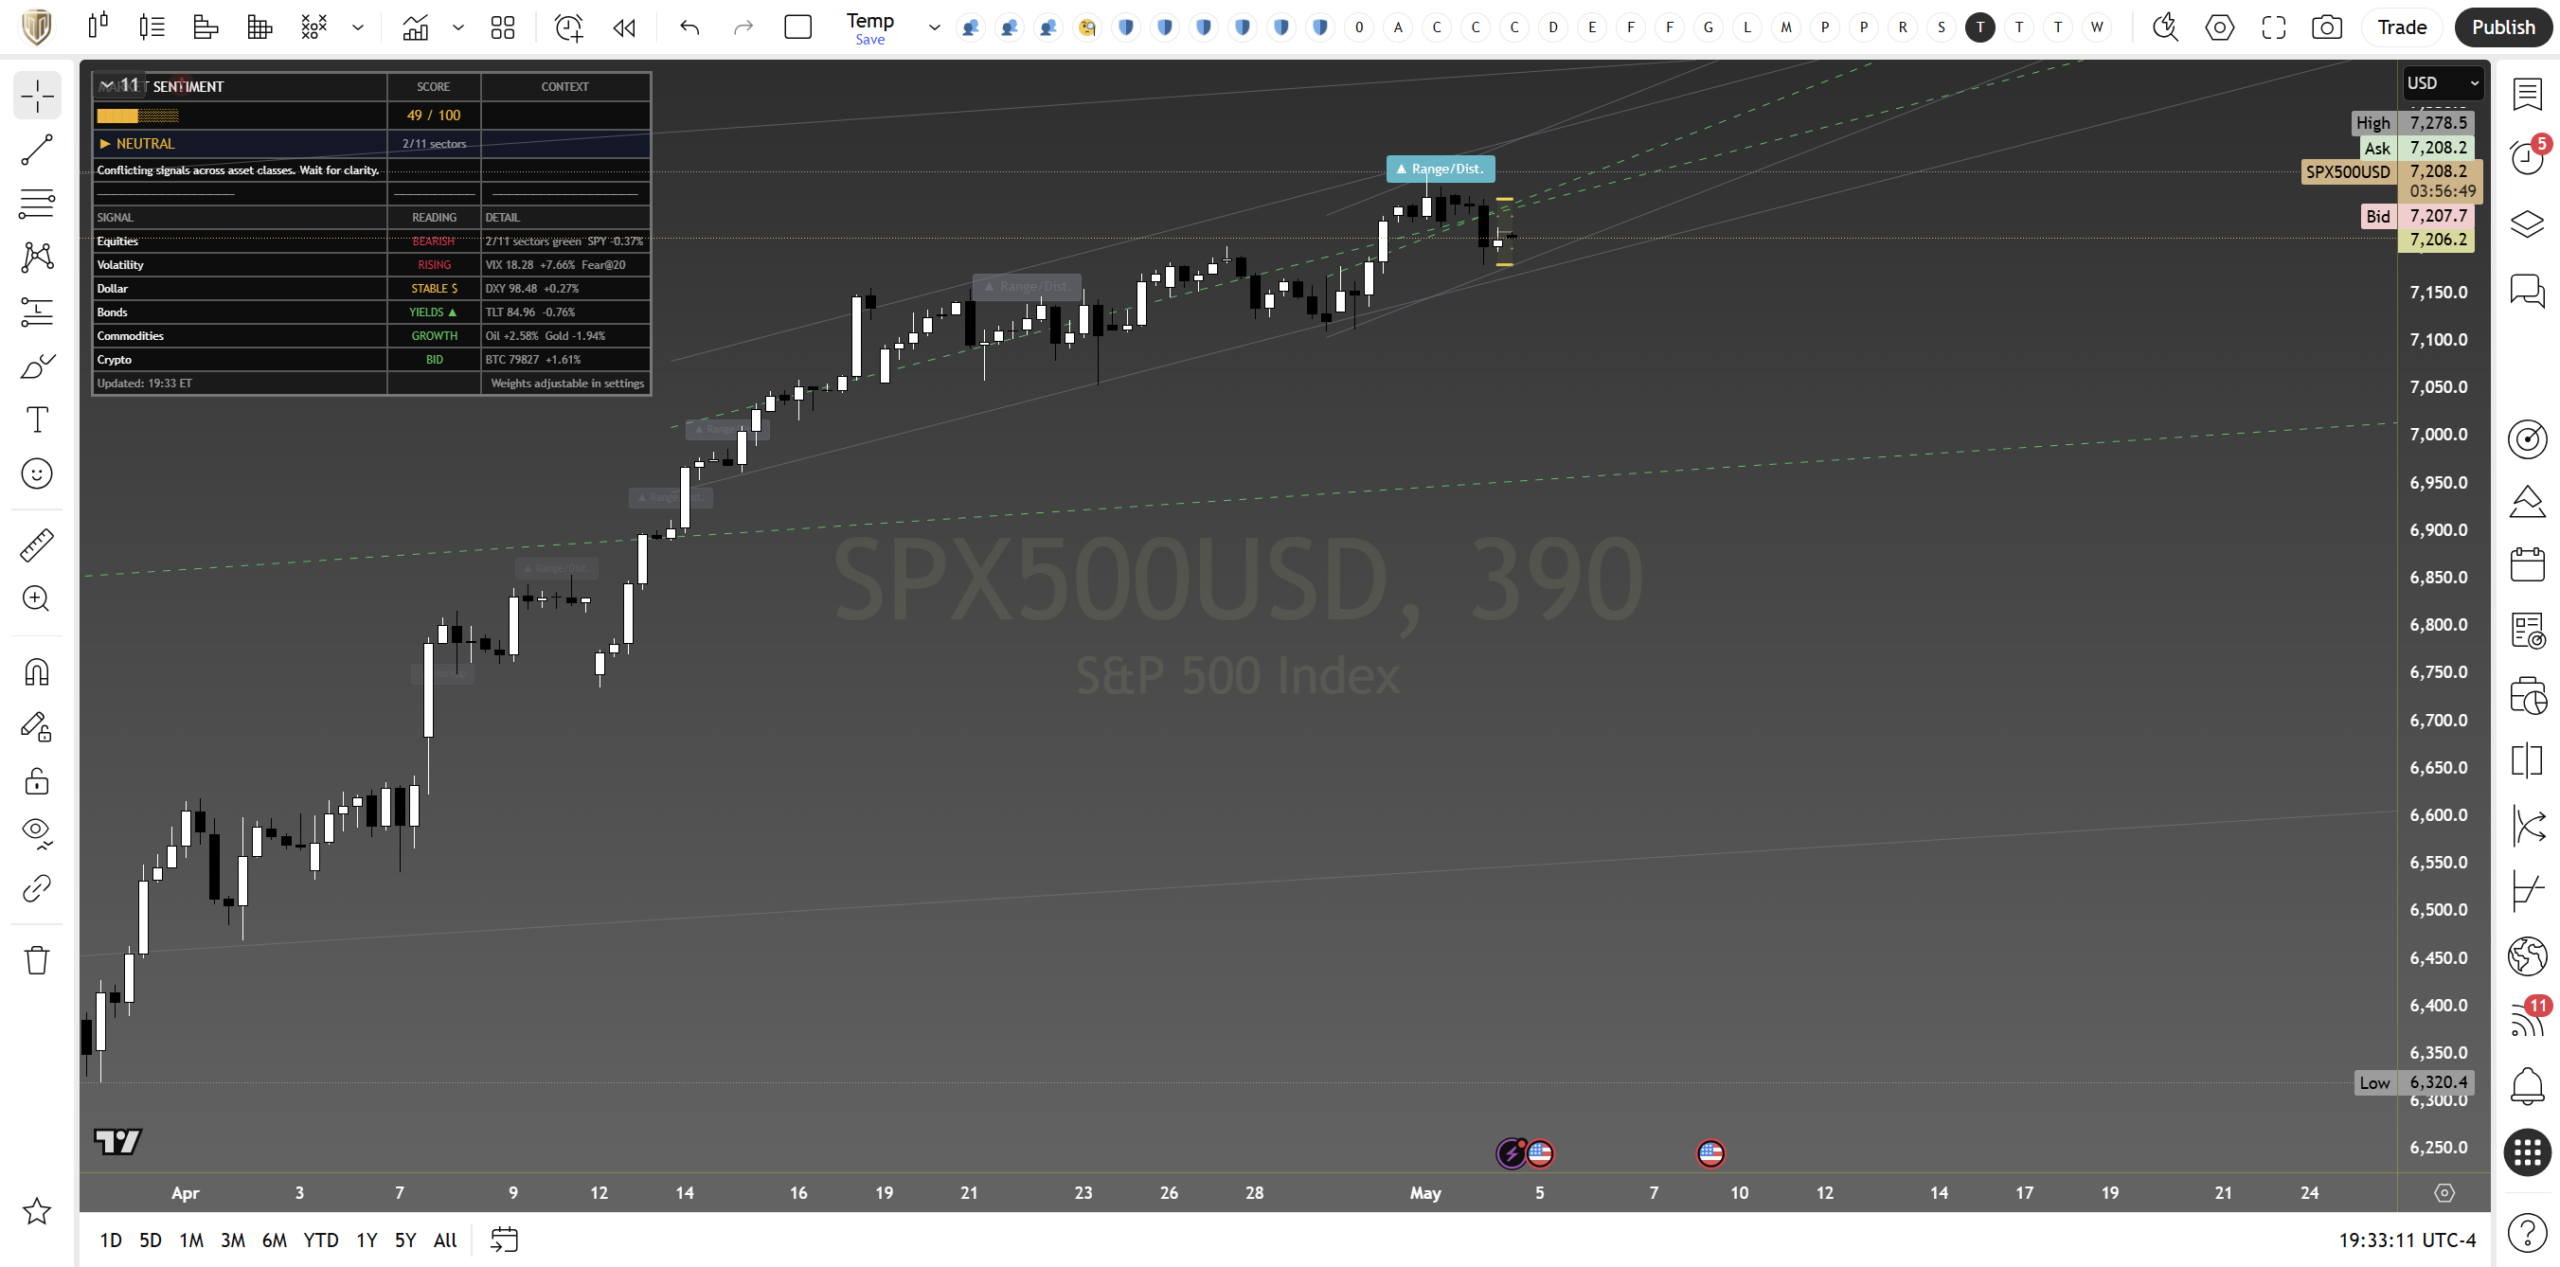
The S&P 500 closed Monday at 7,201, around forty handles below the prior session’s high and a touch above the value area floor. That sounds like nothing on a chart that has rallied a thousand points off the early-April lows, and on the structural read it is nothing. The trend is intact, the higher-low sequence from 6,200 is unbroken, and the diagonal that has carried price since the mid-April reclaim still runs underneath the tape. What has changed is the tone underneath the price.
The framework is doing the same thing it did into the late-April highs. It is asking for confirmation. The cross-asset score has flattened to neutral, equities are reading defensive against a backdrop where futures are green but cash is leaking, and the volatility cohort is no longer collapsing the way it did during the impulse leg. That is not a top call. It is the framework saying the easy money in this trend has been made, and the next leg either earns its size on a clean break or hands the chart back to chop.
The Setup
| Read | Monday 4 May | Tuesday 5 May |
|---|---|---|
| Bias | Long, conviction firm | Watching · long pending hold of value |
| Conviction | Building into highs | Softening at the upper edge |
| Structure | Markup, fresh swing high tagged | Markup paused, distribution candle on the daily |
| Volume & flow | Buyers in control through the close | Flow flattening, sellers defending the highs |
| Cross-asset | Aligned bullish across equities and credit | Mixed · greed reading with vol creeping back |
| Mentor tone | “Aligned for continuation” | “Confirming signals across asset classes. Wait for clarity.” |
Yesterday the framework wanted you long. Today it wants you patient. The same trend is on the screen, the same diagonal is supporting price, and the same higher-low sequence is intact. The difference is that the panel that was firing on every cylinder yesterday has gone quiet. Equities are reading defensive even as futures hold up, the volatility lane has stopped collapsing, and the dollar and bonds are stable rather than confirming risk-on. That is the textbook profile of a trend pausing for breath rather than reversing, but it is also the profile that occasionally tips into a deeper retracement when the wrong catalyst lands.
Levels
| Zone | Level | What It Means |
|---|---|---|
| Upper extension | 7,244 to 7,290 | Friday’s high and the next round-number magnet. Break opens the next leg. |
| Pivot · current | 7,200 to 7,210 | The decision band. Daily close decides whether the pause is constructive or distributive. |
| Trend support | 7,140 to 7,170 | Rising diagonal from the mid-April reclaim. First buy zone on weakness. |
| Step support | 7,050 to 7,080 | Late-April breakout shelf. Real test of the trend if reached. |
| Invalidation | 6,900 to 6,940 | Last higher-low. A daily close below here changes the regime. |
Read the table from the middle outwards. The pivot is the only level that matters this session. Hold it on a daily close and the trend’s bid stays in place, with the upper extension as the natural target on a fresh break. Lose it on a closing basis and the read steps down to the trend support, where buyers either show up at the diagonal or the chart gets a deeper test of the late-April shelf. Below the shelf you are asking the entire reclaim to fail, and that requires a catalyst the panel is not currently flagging.
Scenarios
The Verdict
The S&P 500 is in the textbook pause that follows an impulse. Trend up, structure intact, momentum cooling, cross-asset reads asking for confirmation rather than chasing. The single most important number this session is the daily close relative to the pivot band. Above it the trend earns the next leg. Below it the chart hands itself back to the diagonal for a test, and the framework will reassess from there.
The honest read is that the asymmetry has compressed since Friday. A long entered at the pivot has limited room to the upper extension and meaningful room to the step support if the level fails. That is why the framework has dialled bias from “long with conviction” to “watching with patience”. The trade is still there. It just needs the close to confirm it before it earns size, and there is no edge in front-running that resolution. Risk on this setup reads around 55 percent, balanced between trend support and the absence of a fresh momentum impulse.
Educational analysis only. Not investment advice. Trading carries substantial risk including loss of capital. Past performance is not indicative of future results. Always do your own research.
Continue with Titan Protect
Twenty-plus instruments. One framework.
We read more than twenty instruments daily across four sessions. The framework’s sunrise call landed across the day — the Pre-NY case study shows what the lines drew, what New York did, and where the read stands.
Core
£59/mo
Indicator suite plus daily framework reads.
Edge Popular
£109/mo
Core plus Shield dashboard and member-only briefs.
Elite
£179/mo
Edge plus weekly 1:1 call and early access to new tools.
Save 15% on annual billing
Want to see the framework in action? Free Explorer tier — no card required.
Join the live community: Discord channel · Shield dashboard
Education, not financial advice. Trade your own analysis.
Sunday 3 May 2026
S&P 500 — Daily Framework Read | Sunday 3 May 2026
S&P 500 | Monday Open Framework Read | Data basis: Friday 1 May 2026 close
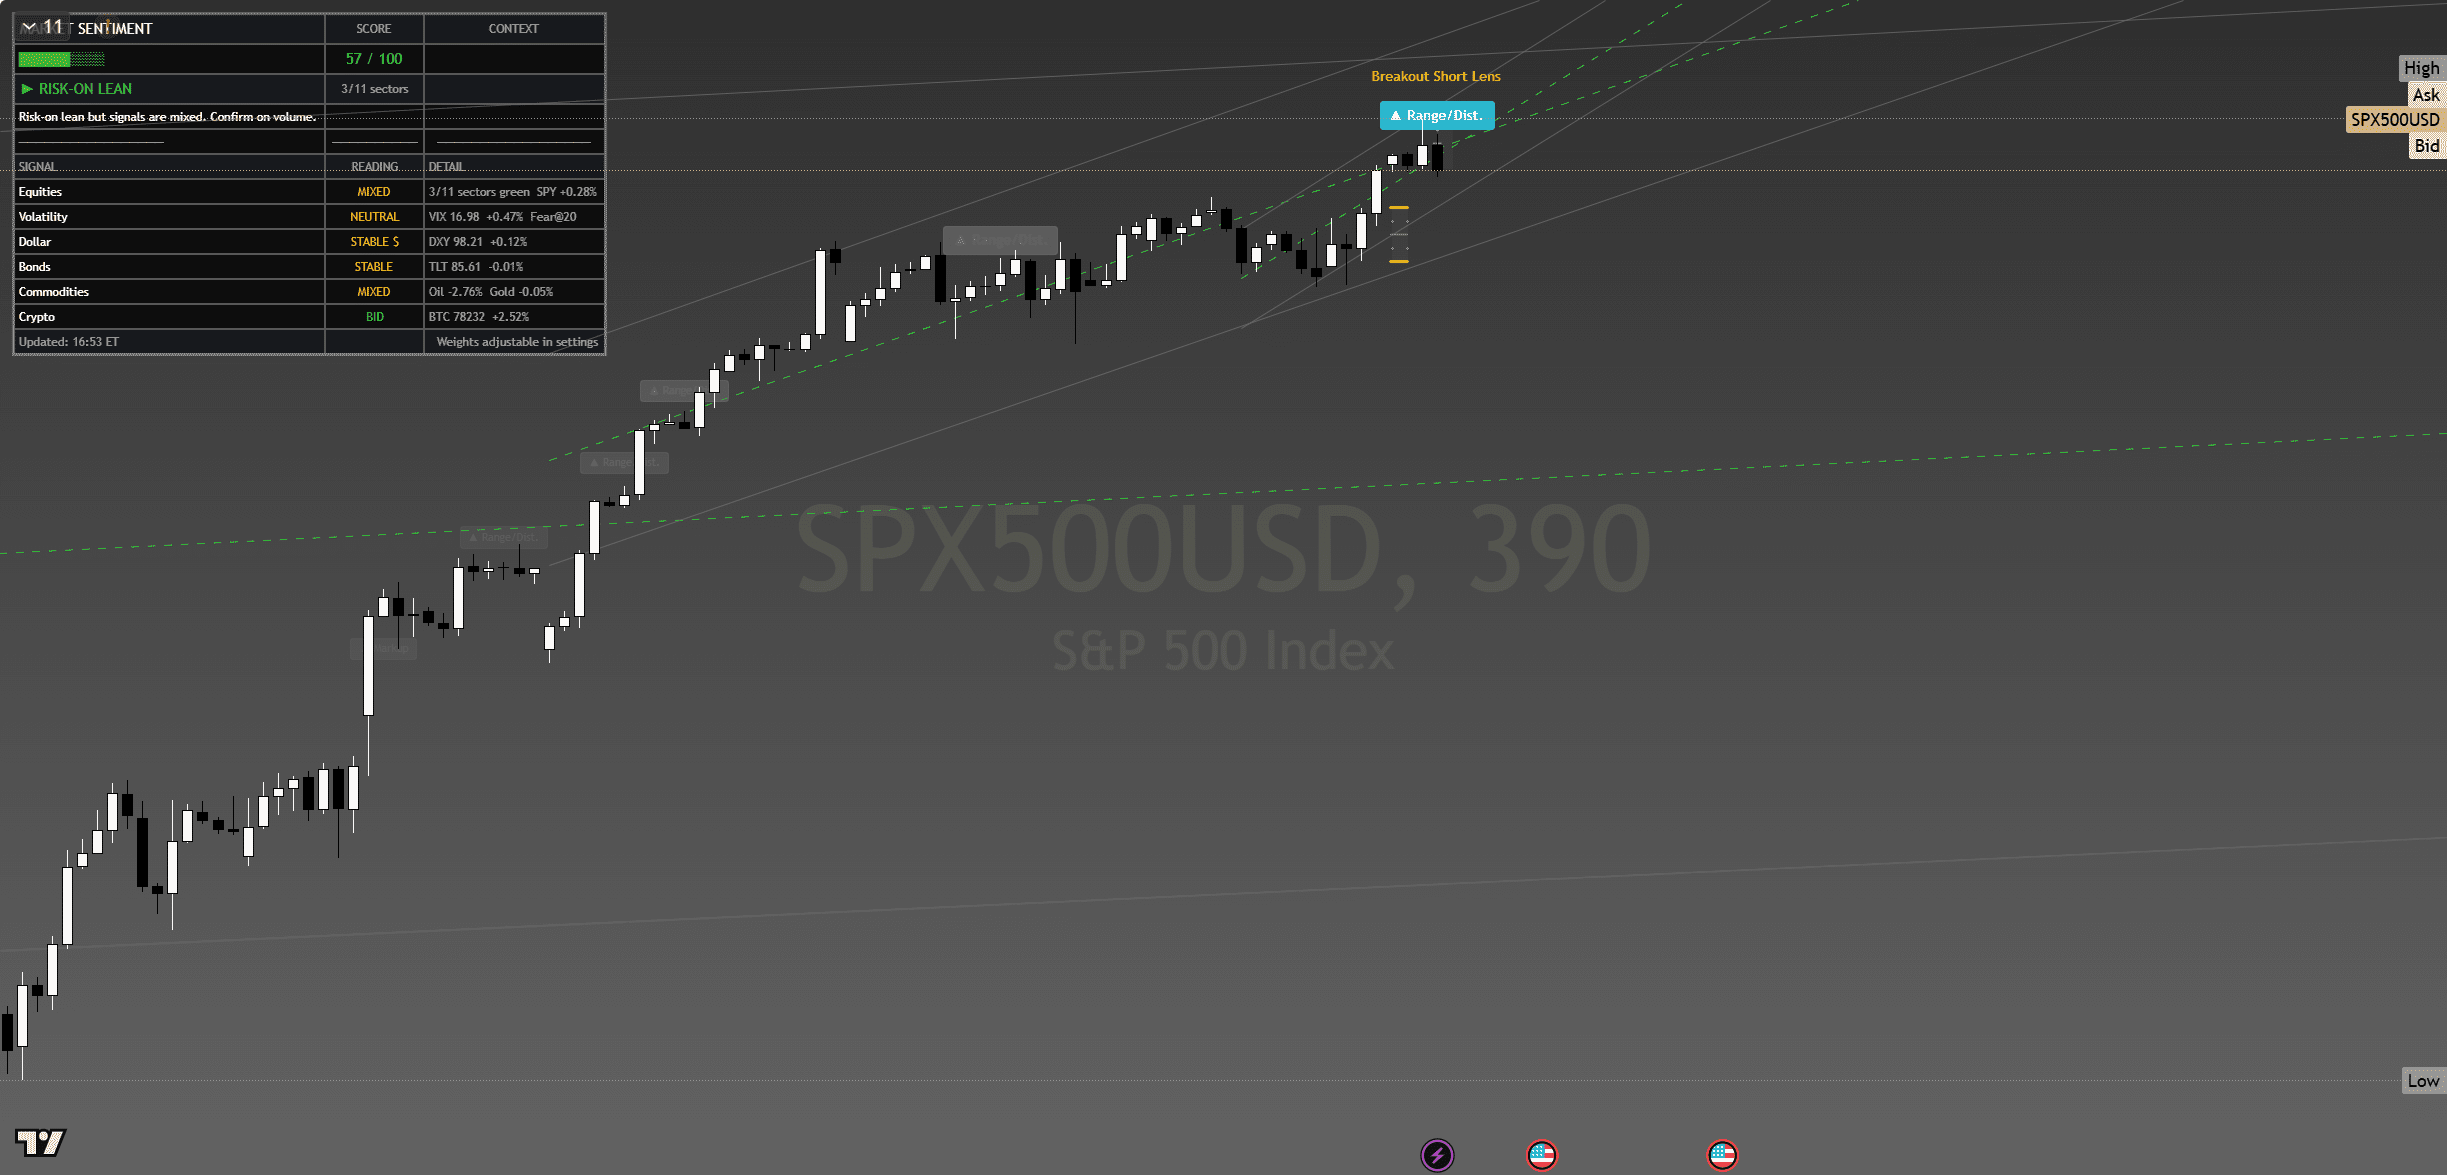
S&P 500 — chart with framework overlay. The Lens annotations show structural breaks, reversal triggers and confluence zones at the levels referenced below.
Where It Sits
Structure
The index sits at all-time highs with the structural trend firmly up across daily, 4-hour, and 60-minute timeframes. Friday’s close above the 7,200 round number on declining VIX is the kind of confirmation that historically extends. The structure is healthier than the Nasdaq’s because participation is broader — financials, industrials, and consumer discretionary all contributed to Friday’s print.
Momentum
Momentum is constructive but not extended. The pace of the advance over the past two weeks has been orderly with no parabolic finish. Internal momentum readings sit in the upper half of their range without pressing extremes — that is the kind of momentum profile that supports continuation rather than reversal.
Volume & Flow
Volume on Friday’s close was solid and broad. Breadth confirmed the move with the advance/decline line printing fresh highs. That is the structural difference between this index and the Nasdaq — when participation is broad, the next leg up does not need a single name to lead. Monday’s tape should reflect that breadth quality unless something interrupts the mood.
Key Levels
| Level | Type | Significance | Action Zone |
|---|---|---|---|
| 7,290 | Resistance | Round-number stretch target, sparse historical reference | Take profits if reached |
| 7,250 | Pivot | Friday intraday high zone — Monday gap-up trigger | Hold above = continuation; reject = fade |
| 7,230 | Friday close | Reference anchor for Monday open | Above = bias up; below = mean revert |
| 7,200 | Support | Round number, recent breakout retest | Buy zone with defined stop |
| 7,150 | Major support | Pre-PCE consolidation floor | Stop-out below for longs |
Three Scenarios Into Monday Open
Continuation
Index opens flat-to-firm, takes out Friday’s intraday high cleanly, runs to 7,260 by midday. SPY 720 holds as the magnetic level, vol bleeds further into the mid-16s. Continuation works because the macro overhang has cleared and there is no catalyst to interrupt the drift higher.
Range
Index opens flat, churns 7,210-7,250 through the session waiting for ISM Services Tuesday. Magnet to Friday close. Range trade — small size, defined stops, take what the tape gives.
Mean Reversion
Index gaps open above 7,250, runs into the 7,260 zone and meets supply, fades back below 7,200 by close. Failed-breakout pattern. Not the base case unless VIX flips back above 17.5 intraday.
Risk Score
Risk sits at Around 50% heading into Monday open.
Risk is moderate. The macro overhang has cleared, vol is compressed, and the trend is clearly up. The constraint is that the index is at a record high and the easy continuation trade is already in place — anyone chasing strength on Monday is buying after the move has already happened. Standard sizing on existing longs, smaller new entries, hard stops.
How to Walk It
Entry / Stop / Target structure:
- Long 7,210-7,220 pullback | Stop 7,180 | Target 7,260 | R:R 2:1
- Long 7,255 breakout | Stop 7,225 | Target 7,290 | R:R 1.2:1
- Fade 7,275+ rejection | Stop 7,295 | Target 7,225 | R:R 2.5:1
Experience-level guidance:
Beginner: The Monday open after a Friday record close is exactly the situation where over-confidence costs money. Reduce size to half your standard. Trade only the cleanest setup from the entries above. If the tape opens against your bias, do nothing — wait for the second hour, when the institutional flow has tipped its hand.
Intermediate: Use the levels table to define the trading range. Fade the extremes with defined stops, take profits before the round-number resistance levels. Do not carry directional positions through the day if you cannot watch the tape — Monday opens are prone to fast reversals.
Advanced: The vol regime is supportive of trending moves. Defined-risk options structures around the key pivot levels capture the asymmetry cleanly. Keep notional small relative to your book — Monday after a record-close week is asymmetric speculation, not core positioning.
The Sunday Composite — How This Read Sits Inside The Cross-Asset View
This single-instrument framework read is one slice of the larger Sunday weekend synthesis. The composite takes positioning, macro, sentiment, volatility, sector dispersion and trade structure as separate analytical layers and arrives at a unified composite verdict for Monday open. Each layer below is unpacked in full.
Read the full composite for the cross-asset context driving this instrument:
The institutional positioning split — Asset Managers vs Leveraged Funds in size
PCE clearance and the macro case for Monday’s carry
The three-layer sentiment disagreement — surface greed, retail neutral, professionals hedged
The vol curve term structure and what VVIX is signalling
Sector dispersion and the breadth problem behind the record close
The Monday position-management playbook — sizing tiers and trade plans
Sunday Overwatch — the unified composite verdict
Continue Reading
The macro frame driving this read is unpacked in the weekend briefs:
Sunday Setup — Reading The Tape Into Monday Open
PCE Cleared, VIX Crushed, SPY Closed 720 — Friday Post-Close Recap
This analysis is for educational and informational purposes only. It does not constitute financial advice. Always manage your risk independently and in accordance with your own financial circumstances.


