Index Breakdown and Tech Leadership
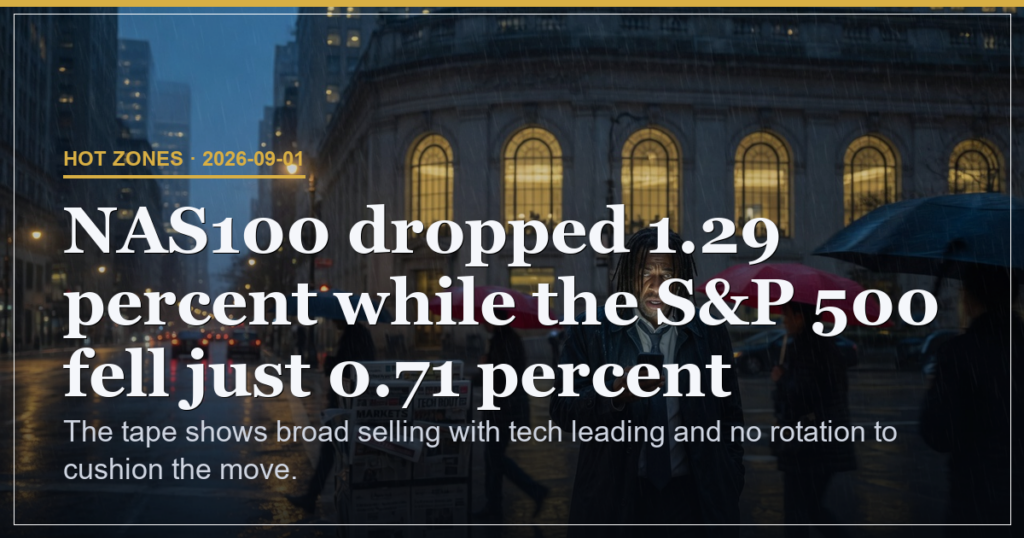
Major indices closed lower across the board with technology leading the decline. The Nasdaq fell 1.29 percent while the S and P 500 dropped 0.71 percent, marking the widest tech underperformance of the session. This leadership increases downside pressure on growth names and leaves the broader market exposed to further selling. Small caps fell in line with large caps, showing no defensive rotation into value or defensives. The Russell 2000 declined 1.23 percent, confirming that the weakness is market wide rather than confined to one segment.
Volume Confirmation and Participation
Volume rose on the selloff, confirming participation and raising the chance of follow through weakness tomorrow. Elevated turnover on the downside suggests that the move is not the work of a few large sellers but reflects broader conviction. Without a quick reclaim of key levels, the tape risks extending the decline into the next session as stops and systematic flows activate.
Options Structure and Dealer Positioning
Building on the Positioning Pressure read, the options market shows a clear bullish tilt with the average put call ratio at 0.885. This level reflects measured call buying rather than aggressive speculation. Whale activity concentrated in AAPL, META and MSFT with call heavy prints that point to real money accumulation. In contrast IWM draws bearish bets, aligning with the observation that small caps led the recent sell off. As our Positioning Pressure read notes, zero day SPY expiry carries max pain seven points above the 761.78 print, setting up natural dealer hedging pressure toward 769.
| Flow Focus | Direction | Tactical Insight |
|---|---|---|
| AAPL META MSFT | Bullish calls | Accumulation into expiry supports index pinning higher yet failed to prevent today’s tech led drop |
| IWM | Bearish puts | Small cap weakness may cap any broad rally attempt and signals continued rotation out of risk |
Key Levels and Immediate Pressure Points
SPY support now sits at 759 with QQQ testing 704 after the break lower. A sustained move below these zones would open the door to the next layer of downside as systematic selling accelerates. Conversely, a quick reclaim of 767 on the S and P 500 would be required to shift the tone from bearish follow through to consolidation.
| Index | Key Level | Tactical Insight |
|---|---|---|
| SPY | Support 759 | Break opens path to accelerated selling as stops trigger |
| QQQ | Support 704 | Tech underperformance keeps growth names under pressure |
| SPY | Reclaim 767 | Necessary to neutralise downside momentum and invite short covering |
Scenario Probabilities and Risk Assessment
Base case continuation lower carries 50 percent probability, modest rebound 30 percent, and tight consolidation 20 percent. Risk sits at 55 percent driven by the absence of any rotation into defensives, leaving the market without a natural cushion if selling persists. Experience level guidance: beginners should reduce position size and avoid chasing weakness, intermediate traders can watch for volume spikes at the 759 support zone, advanced participants may structure defined risk hedges around the 704 QQQ level.
Cross Asset Context and Broader Tape
Digital assets moved lower together confirming they still trade as a risk proxy. Supply driven crude strength stands out while metals point to softer growth ahead. The split reveals divergence where large cap institutions defend while smaller names absorb selling. This leaves the options channel as the dominant visible signal of intent until fresh data arrives.
The tape shows broad selling with tech leading and no rotation to cushion the move.
This is analysis, not financial advice. Always manage your risk.