Index Performance Divergence
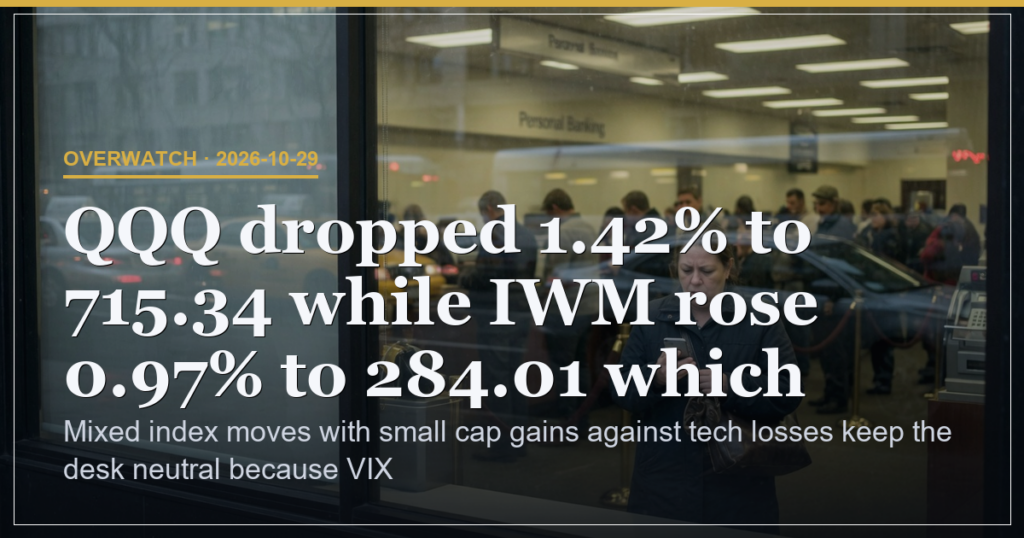
SPY closed at 769.36 down 0.38% because QQQ fell 1.42% to 715.34 which means technology weakness outweighed broad index support and produced net downside pressure. Russell 2000 gained 1.01% to 2859.22 because IWM rose 0.97% to 284.01 which means small-cap outperformance offset large-cap declines by 2.39 percentage points on the session. NDX fell 1.38% to 29402.51 while the S&P 500 lost 0.30% to 7720.39 because the same tech-led rotation limited participation breadth across the major benchmarks.
Volatility and Sentiment Metrics
VIX rose 1.71% to 17.2 because the fear-greed score slipped to 34.6 which means volatility pressure increased slightly and kept the regime mixed rather than directional. AAII bearish readings reached 41.4% against bullish at 37.8% which means the bull-bear spread of minus 3.6 points signals mild defensive tilt from individual investors without tipping into extreme territory.
Options Positioning Alignment
Positioning Pressure shows call-heavy whale flow in NVDA and META lifted overall options sentiment to bullish because the average put-call ratio sat at 0.77 with no offsetting bearish names visible. SPY max-pain at 770 versus the 764.86 print creates a 5.14-point gap which means mechanical upward bias persists into expiry as price sits 0.67% below the zero-day strike.
| Index | Close | Change | Implication |
|---|---|---|---|
| SPY | 769.36 | -0.38% | Tech drag dominates despite small-cap offset |
| QQQ | 715.34 | -1.42% | Primary source of downside leadership |
| IWM | 284.01 | +0.97% | Rotation into value areas underway |
Range Boundaries and Key Levels
SPY support rests at the 766.62 low and resistance at the 770.76 high while QQQ support sits at 711.62 which means any decisive move outside these prints would shift the neutral regime. Dark-pool visibility recorded zero top flows which means the options channel remains the sole measurable signal for positioning pressure.
| Level | Value | Meaning |
|---|---|---|
| SPY support | 766.62 | Session low that would confirm further downside if broken |
| SPY resistance | 770.76 | Session high that would open upside continuation if cleared |
| VIX line | 17.2 | Moderate caution threshold that keeps bias balanced |
Scenario Triggers and Weights
45% probability of upside resolution above the 770.76 resistance because small-cap strength and bullish options flows would then dominate. 30% probability of continued range hold between 766.62 and 770.76 because the composite remains near zero with no decisive catalyst. 25% probability of downside break below 766.62 because further tech weakness would widen the rotation gap and lift VIX above 17.36.
Risk stands at 17% driven by the VIX at 17.2 and the 1.71% daily rise which means moderate caution persists until term-structure or fear-greed readings shift materially.
| Experience Level | What to Watch on the Tape |
|---|---|
| Beginner | Observe how small-cap outperformance versus tech alters daily closes |
| Intermediate | Track VIX movement against the 17.2 line and fear-greed score changes |
| Advanced | Monitor max-pain gaps and options flow concentration for regime shifts |
Mixed index moves with small cap gains against tech losses keep the desk neutral because VIX at 17.2 signals moderate caution.
This is analysis, not financial advice. Always manage your risk.