Sentiment Snapshot and Daily Shift
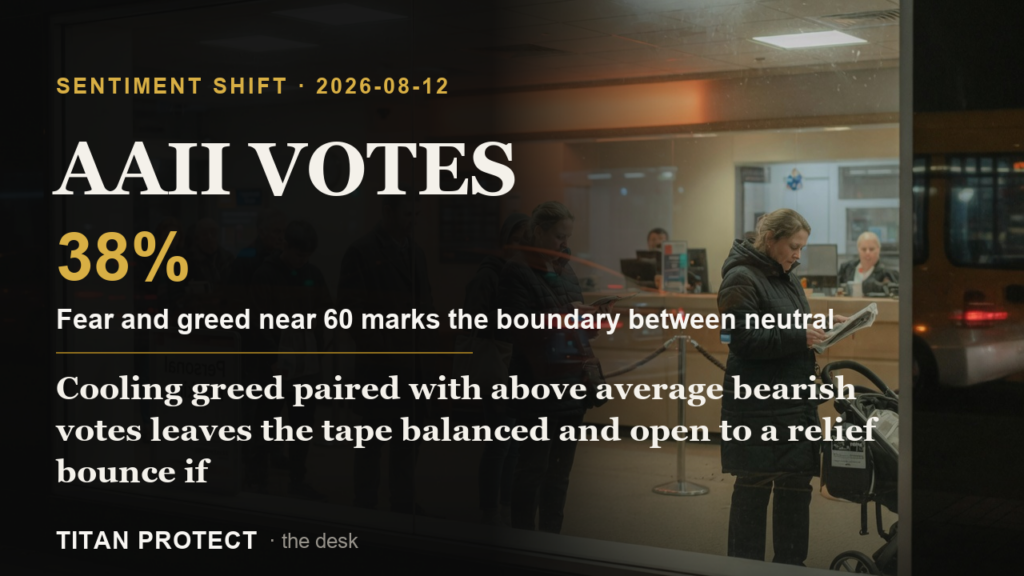
Fear and greed sits at 60.7 in greed territory yet has fallen 4.3 points in a single session. That drop shows momentum fading after recent advances and places the reading right at the neutral-greed boundary. Crowd participation remains steady but the direction of travel now leans toward caution. Building on yesterday’s view from the Macro Pulse pod the risk on regime stays intact so this cooling does not yet signal outright reversal. The tape therefore sits balanced with room for a relief bounce if selling exhausts as our Positioning Pressure read notes.
AAII Readings and Contrarian Context
The latest AAII survey shows bullish votes at 37 percent matching the long term average while bearish votes reach 38 percent against the 31.5 percent norm. This above average bearish reading often serves as a contrarian signal once it exceeds historical ranges and leaves the crowd leaning cautious rather than euphoric. Neutral votes sit at 32.9 percent close to the 31 percent historical mark so polarisation is mild rather than extreme. Elevated bearish sentiment at these levels has historically flagged oversold conditions when paired with contained volatility.
| AAII Component | Current Level | Historical Norm | Tactical Insight |
|---|---|---|---|
| Bullish | 37.0% | 37.5% | Matches average so no extreme optimism to fade |
| Bearish | 38.0% | 31.5% | Above range flags potential relief if flows stabilise |
| Neutral | 32.9% | 31.0% | Steady participation keeps breadth intact |
Options Flow and Dealer Positioning
Options market sentiment sits bullish with the average put call ratio at 0.873 pointing to heavier call activity in names such as AAPL TSLA and META. SPY closed at 770.72 against the front week max pain level of 771.00 so the 0.28 point gap keeps price glued to the strike where dealers hold the flattest gamma profile. As our Positioning Pressure read notes this configuration reduces the incentive for aggressive hedging either side of the level. IWM shows the opposite pattern with bearish options flow which leaves small caps as the relative laggard inside an otherwise supported tape.
| Strike Cluster | Flow Observation | Tactical Insight |
|---|---|---|
| 770-772 | Heavy open interest at max pain | Expect range compression and low realised volatility into expiry |
| 760-765 | Put support building | Any dip attracts dip buying from systematic accounts |
| 775-780 | Call resistance light | Upside breaks require volume confirmation to extend |
Breadth Implications and Herd Lean
Dark pool prints remain quiet with zero notable blocks reported so the narrative rests with options positioning. Large cap indices closed soft while small caps held above prior close leaving breadth mixed rather than uniformly weak. The herd therefore leans cautious on the AAII reading yet derivatives flows continue to pin the main index near max pain. This divergence often precedes short covering once selling pressure eases and supports the case for a contained bounce rather than deeper downside.
Scenario Probabilities and Risk Assessment
Three forward paths emerge from the current balance. A relief bounce if bearish votes trigger short covering carries 40 percent probability. Continued range compression near max pain holds 35 percent probability. A deeper pullback on fresh macro shocks accounts for the remaining 25 percent. Risk sits at 45 percent driven by the rapid one day drop in fear and greed that could accelerate if options flow turns defensive.
Experience guidance follows three tiers. Beginners should focus on the max pain pin and avoid chasing moves beyond the 760 to 775 band. Intermediate traders can monitor AAII bearish levels for contrarian entries on any test of 760 support. Advanced participants may overlay options flow with the 40 percent bounce scenario to size hedges accordingly.
The tape remains balanced and open to a relief bounce if selling exhausts.
This is analysis, not financial advice. Always manage your risk.