Alpha Insights | Week Ahead Preview
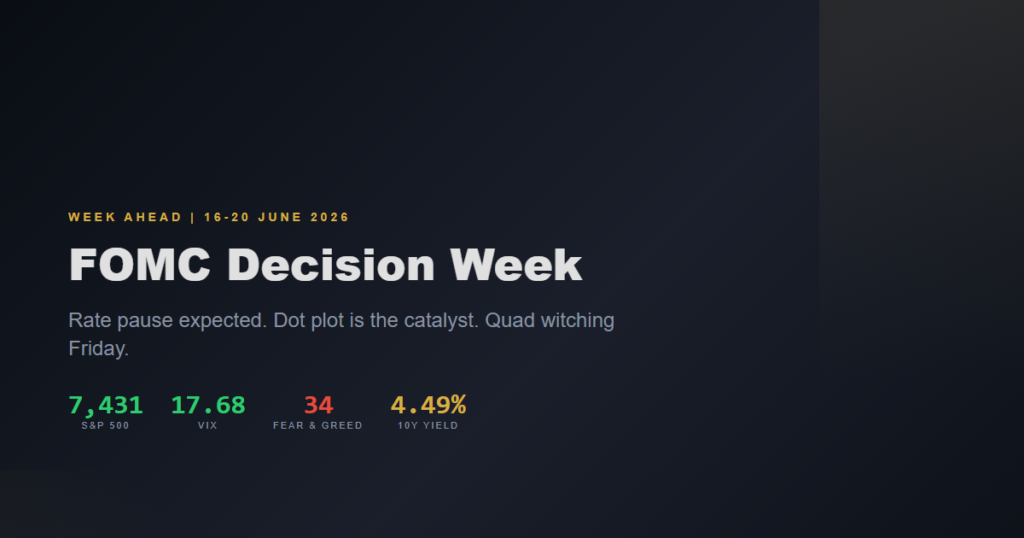
FOMC Decision Week: Rate Pause Expected as VIX Hits 17.68 and Iran Deal Framework Emerges
Week of 16-20 June 2026 | Published 14 June 2026
Executive Summary
The coming week is dominated by Wednesday’s FOMC decision, where a rate hold at 5.25-5.50% is near-certain, but the updated dot plot and Powell’s press conference will determine whether markets extend the rally or reverse. The S&P 500 enters the week at 7,431 after adding $1.2 trillion on Iran deal optimism, while the VIX at 17.68 is at its lowest since pre-crisis levels. Friday’s quad witching adds a volatility accelerant to an already event-heavy calendar. This is a week that rewards preparation and punishes complacency.
Market Setup Heading Into the Week
S&P 500
7,431
+$1.2T on Iran deal
VIX
17.68
Lowest since pre-crisis
Fear & Greed
34
Fear (contrarian bullish)
10Y Yield
4.49%
30Y at 4.97%
Gold
$4,238
Safe haven demand steady
Crude Oil
$84.88
Iran supply relief priced
The equity rally that followed the Iran deal framework announcement has pushed the S&P 500 to 7,431, adding a staggering $1.2 trillion in market capitalisation. Yet the Fear & Greed Index sitting at 34 tells a different story: retail sentiment remains cautious, which historically acts as a contrarian bullish signal. The divergence between price action and sentiment is one of the most interesting dynamics heading into this week.
The yield curve continues to steepen with the 10-year at 4.49% and the 30-year at 4.97%, a spread that reflects the market’s longer-term inflation concerns even as short-term rate expectations remain anchored. Gold at $4,238 is holding firm despite the risk-on move in equities, suggesting that geopolitical hedging demand has not fully unwound. Crude at $84.88 is pricing in partial Hormuz reopening, but the timeline remains uncertain.
Economic Calendar: 16-20 June 2026
All times shown across three major trading sessions. Highlighted events are high-impact releases that typically move markets.
| Day | Event | New York | London | Tokyo | Consensus | Prior | Why It Matters |
|---|---|---|---|---|---|---|---|
| Mon 16 | Empire Manufacturing | 08:30 | 13:30 | 21:30 | -5.0 | -3.5 | NY Fed manufacturing gauge, a leading indicator for broader industrial activity. Deepening contraction would weigh on cyclicals. |
| Tue 17 | Retail Sales | 08:30 | 13:30 | 21:30 | +0.4% | +0.3% | Consumer spending health and direct GDP input. Strong print supports soft landing narrative; weak print raises recession fears. |
| Tue 17 | Industrial Production | 09:15 | 14:15 | 22:15 | +0.3% | +0.2% | Manufacturing output gauge. Confirmation of improving production strengthens the case for economic resilience. |
| Wed 18 | FOMC Decision | 14:00 | 19:00 | 03:00+1 | 5.25-5.50% | 5.25-5.50% | THE event of the week. Dot plot projections and Powell’s press conference at 14:30 ET will drive direction. |
| Wed 18 | Housing Starts | 08:30 | 13:30 | 21:30 | 1.38M | 1.36M | Construction activity and real economy demand. Typically overshadowed by FOMC but watch for surprises. |
| Thu 19 | Initial Jobless Claims | 08:30 | 13:30 | 21:30 | 225K | 222K | Weekly labour market health check. Rising claims would validate dovish expectations from the prior day’s FOMC. |
| Thu 19 | Philly Fed Manufacturing | 08:30 | 13:30 | 21:30 | -3.0 | -4.5 | Regional manufacturing survey. Improving from -4.5 to -3.0 would signal bottoming in manufacturing. |
| Fri 20 | QUAD WITCHING | All day | — | — | — | — | Massive volume spike, index rebalancing, options expiry pin risk. Expect 2-3x normal volume. |
FOMC Preview: The Decision is Not the Story
What Markets Are Pricing
Rate Hold Probability
95%+
Target Range
5.25-5.50%
The rate decision itself is a formality. With over 95% of Fed funds futures pricing a hold, the real action is in the Summary of Economic Projections, specifically the dot plot. The question that will determine whether equities extend or reverse: how many rate cuts do FOMC members project for the remainder of 2026 and into 2027?
The macro backdrop is genuinely conflicted. CPI remains elevated at 4.2%, well above the Fed’s 2% target, which gives hawks ammunition. Yet the labour market is softening, manufacturing surveys are contracting (both Empire and Philly Fed expected negative), and the consumer appears to be slowing. This tension between sticky inflation and weakening growth is exactly what makes the dot plot so consequential.
Three Things to Watch at 14:00 ET on Wednesday
- Dot plot median for 2026: If the median shows two or more cuts remaining this year, equities rally. If it drops to one or zero, expect a sharp repricing in rate-sensitive names.
- Powell’s characterisation of inflation: Listen for shifts in language. “Persistent” or “broadening” is hawkish. “Moderating” or “expected to decline” is dovish. The adjectives matter more than the rate.
- Dissents: Any shift in voting members voting for a hike (rather than hold) would be a genuinely hawkish surprise that the market is absolutely not pricing in. VIX at 17.68 tells you complacency is high.
Earnings to Watch
While the macro calendar dominates, several notable earnings reports land this week. The focus is on consumer-facing names and any forward guidance that either validates or contradicts the soft landing thesis.
| Day | Company | Timing | Why It Matters |
|---|---|---|---|
| Mon 16 | Lennar (LEN) | AMC | Homebuilder guidance ahead of Housing Starts data. Demand signals for rate-sensitive housing sector. |
| Wed 18 | Kroger (KR) | BMO | Consumer staples bellwether. Margin commentary reveals real inflation pass-through dynamics. |
| Thu 19 | Accenture (ACN) | BMO | IT services and AI spending proxy. Forward bookings indicate enterprise tech investment appetite. |
| Thu 19 | Darden Restaurants (DRI) | BMO | Olive Garden parent. Same-store sales reveal discretionary consumer health at the middle-income level. |
The Lennar report on Monday is particularly interesting timing, arriving the day before Housing Starts data. If Lennar’s forward guidance is cautious on demand, it sets a bearish tone for Wednesday’s housing numbers and reinforces the case for rate cuts.
Geopolitical Landscape
Iran Deal Framework
The Iran nuclear deal framework remains the single largest geopolitical variable for energy markets and risk appetite. Negotiations continue but a signing timeline is uncertain. The $1.2 trillion equity rally was partly predicated on a successful outcome, which means any collapse in talks represents a significant downside risk.
Hormuz Reopening
43%
Polymarket by 15 July
Crude Impact
-$6-8
Per barrel if deal signed
Israeli strikes on Lebanon are complicating the broader Middle East negotiations. While separate from the Iran nuclear framework, the regional escalation increases the probability of a deal collapse or delay. Markets are not pricing in a serious deterioration here, which makes it a tail risk worth monitoring.
SpaceX IPO aftermarket trading enters its second week. The initial listing attracted enormous retail and institutional interest. Watch for secondary market activity to gauge broader risk appetite, particularly in the growth and innovation segment. For our full geopolitical analysis, see the Iran Oil Tracker.
Key Levels for the Week
| Instrument | Current | Support | Resistance | Key Level | Bias |
|---|---|---|---|---|---|
| S&P 500 | 7,431 | 7,350 | 7,500 | SPY max pain $740 | Bullish |
| NAS100 | 29,636 | 29,000 | 30,000 | QQQ max pain $715 | Bullish |
| Gold | $4,238 | $4,180 | $4,300 | Safe haven demand | Neutral |
| Crude Oil | $84.88 | $82.00 | $88.00 | Iran deal = supply relief | Bearish |
| VIX | 17.68 | 15.00 | 20.00 | Pre-FOMC compression | Watch |
| Bitcoin | $63,890 | $60,000 | $67,000 | Risk-on correlation | Bullish |
The S&P 500 at 7,431 sits just below the psychologically significant 7,500 level. With SPY max pain at $740, options market makers have a gravitational pull towards current levels, which suggests limited upside into Friday’s quad witching unless a catalyst shifts positioning. The 7,350 support level aligns with the breakout zone from the Iran deal announcement and would be the first test on any FOMC-driven sell-off.
Crude oil is the most interesting asymmetric setup. If the Iran deal is signed, expect crude to test $82 or lower as Hormuz reopening floods supply expectations. If talks collapse, $88+ is in play quickly. The binary nature of this outcome makes crude the highest-conviction directional trade of the week, but only once the catalyst confirms.
Scenario Analysis
Bull Case
40%
FOMC holds as expected. Dot plot shows 2+ rate cuts for 2026, validating the soft landing. Iran deal framework signed or near-signed. VIX compresses below 16. S&P 500 pushes through 7,500 into quad witching. Risk assets broadly higher.
Sideways
35%
FOMC holds but hawkish tone in press conference. Powell acknowledges sticky CPI and signals no rush to cut. Markets chop around current levels. Quad witching pins SPY near max pain. Iran deal delayed but not dead. A frustrating week for directional traders.
Correction
20%
Hawkish surprise in dot plot (fewer cuts projected). Iran deal collapses on Lebanon escalation. Yields spike with 10Y testing 4.60%. S&P 500 pulls back to 7,350 support. VIX jumps above 20. Quad witching amplifies the sell-off as gamma flips negative.
Black Swan
5%
Major escalation in Lebanon or Iran derails the deal entirely. Hormuz closure threat re-emerges. Crude spikes above $95. Emergency geopolitical risk premium returns. VIX above 25. Not the base case, but the tail that demands hedging.
Trading Considerations by Experience Level
For Newer Traders
This is a week to be cautious with position sizing. The FOMC decision on Wednesday and quad witching on Friday create two distinct volatility events that can produce outsized moves in both directions. Consider the following:
- Reduce position sizes by at least 50% heading into Wednesday. The dot plot reaction is binary and difficult to predict.
- Avoid taking new positions between 13:30-15:00 ET on Wednesday. The whipsaw during and immediately after the FOMC announcement catches more traders than it rewards.
- Friday’s quad witching inflates volume but much of it is mechanical rebalancing, not directional conviction. Do not mistake volume for signal.
- If you are long equities from lower levels, consider taking partial profits into strength rather than holding through both events. You can always re-enter.
For Experienced Traders
The setup this week offers multiple asymmetric opportunities if you structure the risk correctly:
- VIX at 17.68 makes protective puts relatively inexpensive. Consider hedging long equity exposure with SPY puts before the FOMC. If the dot plot is dovish, your equity positions rally and the put cost is a small insurance premium.
- The crude oil trade is the cleanest binary setup. Wait for the Iran deal catalyst before committing. If the deal signs, bearish crude. If it collapses, bullish crude. Do not anticipate.
- Quad witching gamma dynamics favour selling premium earlier in the week and covering Thursday. The pin risk around max pain levels (SPY $740, QQQ $715) creates mean-reversion opportunities.
- Monitor the 10Y yield closely. A move above 4.55% would signal the bond market is pricing in a hawkish FOMC, often leading equities by 4-6 hours.
For Portfolio Managers
Macro positioning into the FOMC should reflect the asymmetric risk profile:
- The Fear & Greed at 34 suggests the crowd is already cautious, which limits downside relative to a euphoric positioning environment. Contrarian bullish, but with caveats.
- Sector rotation opportunities exist if the dot plot is dovish: financials, homebuilders, and small caps would benefit most from a rate-cut acceleration signal.
- Gold at $4,238 remains a compelling hedge against both inflation persistence and geopolitical deterioration. The risk-reward for maintaining a 5-10% allocation is favourable regardless of the FOMC outcome.
- Review our ethical trading framework for screening criteria that align portfolio construction with principled investing.
Quad Witching Friday: What You Need to Know
Friday 20 June marks quarterly quad witching, the simultaneous expiration of stock index futures, stock index options, single stock futures, and single stock options. This event typically produces 2-3 times normal trading volume and can create outsized price moves, particularly in the final hour of trading.
Quad Witching Key Points
- Index rebalancing flows will dominate the close. Expect mechanical buying and selling unrelated to fundamentals.
- Pin risk around max pain levels is elevated. SPY gravitates to $740, QQQ to $715.
- The combination of FOMC positioning unwind plus quad witching creates a uniquely volatile Friday. Do not carry unhedged directional exposure into the close unless you have a specific thesis.
- Historically, the Monday after quad witching often reverses Friday’s close-to-close move. Keep this mean-reversion tendency in mind for the following week.
How to Structure the Week
Monday-Tuesday: Positioning Phase
Empire Manufacturing and Retail Sales set the tone. Adjust hedges based on data. Build positions if data supports your thesis, but keep powder dry for Wednesday.
Wednesday: The Main Event
FOMC at 14:00 ET. Be positioned before 13:30 or wait until after 15:00 for the dust to settle. The first 30 minutes after the decision are noise. The real move develops in the final hour and into Thursday.
Thursday: Reaction and Positioning
Thursday is when the FOMC move either extends or reverses. Jobless claims and Philly Fed add data points. This is the day to build or reduce positions ahead of quad witching.
Friday: Execution, Not Exploration
Quad witching. Execute your plan from Thursday. Do not make new directional bets. Manage risk, take profits, and prepare for the following week.
Get Ahead of Every Session
Our daily Alpha Insights briefings break down Pre-Asia, Pre-London, and Pre-New York sessions with institutional-grade analysis. Members receive briefings 24 hours ahead of public release.
View our verified track record to see how our multi-factor framework performs across market conditions.
Disclaimer: This article is for informational and educational purposes only. It does not constitute financial advice, investment advice, or a recommendation to buy or sell any security or instrument. All trading and investment decisions should be based on your own analysis and risk tolerance. Past performance is not indicative of future results. Markets can move against you. Always do your own research and consider consulting a qualified financial adviser before making investment decisions.