Titan Protect · Weekly Track Record
Weekly Track Record: 324 Calls, 84.3% Hit Rate
Titan Overwatch Desk • Week of 29 June to 3 July 2026 • Every call logged before the outcome, scored mechanically after
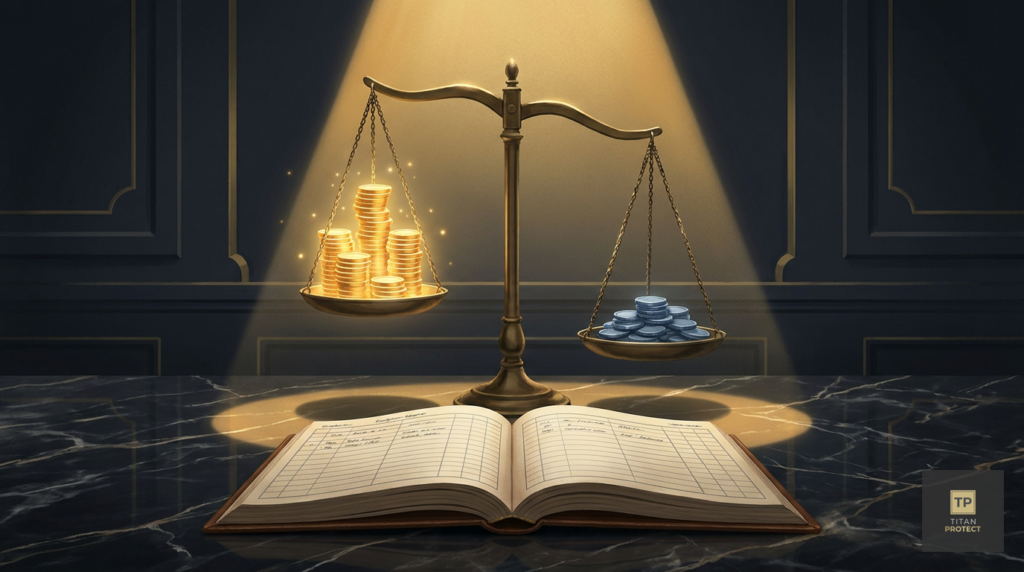
This is the weekly accounting. Every directional read the framework published last week, scored against what the market actually did, with the wrong calls given the same font size as the right ones. The week produced 324 scored calls: 273 correct, 51 wrong, an 84.3% hit rate. That is the best week on our rolling record, and it happened in a week that included a quarter-end, an ISM beat that sold off, and a payrolls shock that halved the forecast. Here is where the accuracy came from, and where it did not.
The Scorecard by Instrument
| Instrument | Calls | Hit Rate |
|---|---|---|
| S&P 500 | 25 | 100% |
| Russell 2000 | 22 | 100% |
| Crude Oil (WTI) | 22 | 100% |
| Copper | 10 | 100% |
| FTSE 100 | 5 | 100% |
| Ethereum | 37 | 95% |
| Dollar Index | 16 | 94% |
| Solana | 65 | 89% |
| Gold | 26 | 85% |
| Bitcoin | 20 | 85% |
| DAX 40 | 6 | 83% |
| Nikkei 225 | 6 | 50% |
| NAS100 | 32 | 47% |
| Microsoft | 8 | 38% |
| Nvidia | 5 | 20% |
Where the Edge Was
The week’s accuracy was carried by breadth, not by the headline index. S&P 500, Russell 2000, crude and copper went a combined 79 for 79. The crude reads deserve the spotlight: staying bearish on WTI all week while equities rallied was uncomfortable, and it was right 22 times out of 22 as the barrel lost 4%. The dollar reads (94%) and the metals reads caught the rate repricing early. And the crypto book (SOL, ETH, BTC: 122 calls at 89%) kept reading the decoupling correctly while the correlation traders fought it.
Where We Were Wrong
No accounting is honest without this section, and this week it has a clear shape. NAS100 went 15 for 32, our worst major-instrument week in over a month. The 1,295 point round trip chopped the daily reads in both directions: cautious stances early in the week scored wrong as the recovery ran, and the payday reversal on Thursday flipped intraday reads that had been right for two hours. Single-name megacap tech was worse: Nvidia 1 for 5, Microsoft 3 for 8. When an index whipsaws, its biggest components whipsaw with leverage, and the framework’s daily cadence paid for it.
The lesson we take is not new but the week underlined it: in compression weeks, the framework’s edge lives in the instruments with one clean story (commodities, FX, small caps) and thins out in the crowded argument (megacap tech). Position sizing already reflects that; the scorecard now shows why.
Context, So the Number Means Something
One great week is weather. The record is climate: 2,328 calls scored all-time at 69.7%. Recent weeks ran 70.8%, 72.1%, 76.4%, 74.4%, 71.8%, then a 54.1% week we published just as plainly as this one, and now 84.3%. Every call is logged with its date, instrument and direction before the outcome exists, then scored mechanically. Nothing is edited after the fact, including the weeks we would prefer to forget. The full live scorecard, updated weekly, is on the site.
Titan Overwatch Desk. Historical accuracy does not guarantee future results. This is analysis and education, not financial advice. Markets carry risk. Always manage your position size and do your own research.