Advance/Decline Line: Measuring Market Breadth
📊 The Surface vs The Depth
Market Internals — 6/5
Market Internals — 6/5
The S&P 500 hits a new all-time high. Headlines celebrate. Retail traders rush to buy. But beneath the surface, something troubling is happening. While the index rises, fewer and fewer stocks are participating. The gains are driven by a handful of mega-cap giants while the broader market stagnates.
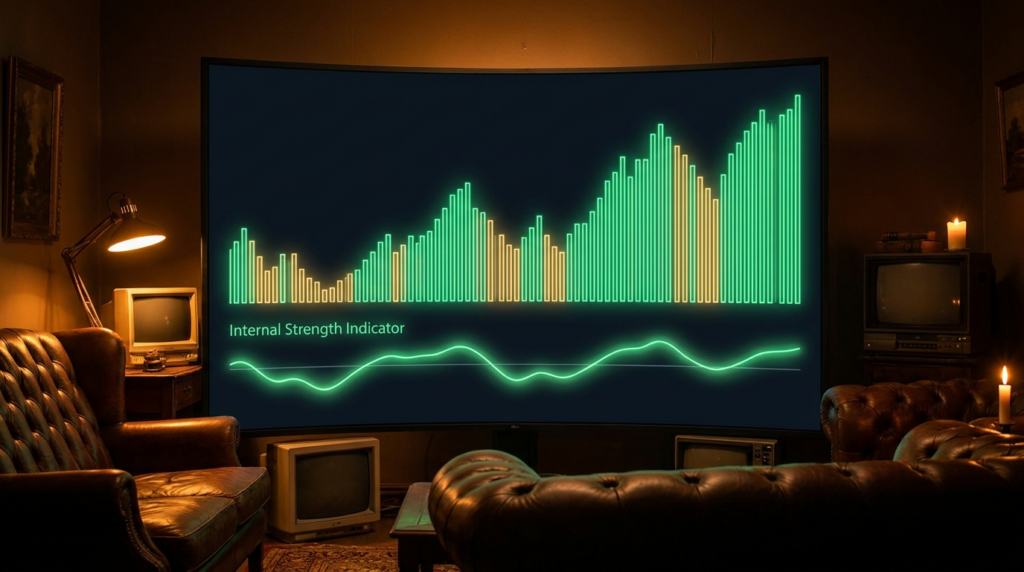
This divergence – between index performance and underlying participation – is what the Advance/Decline Line measures. It reveals whether a market move is broad and healthy, or narrow and fragile.
Most traders watch the index. Professionals watch the breadth. The A/D Line tells you whether the soldiers are following the generals, or if the generals are advancing alone.
🔍 What Is the A/D Line
Simple Definition
The Advance/Decline Line is a cumulative total of advancing stocks minus declining stocks each day. It’s a running tally of market participation.
Daily Calculation:
“`
Advancing stocks: 1,800
Declining stocks: 1,200
Net: +600
Previous A/D Line: +45,000
New A/D Line: +45,600
“`
The Math:
- Add advancing stocks
- Subtract declining stocks
- Add result to previous cumulative total
- Repeat daily
Unlike price indices (weighted by market cap), every stock counts equally in the A/D Line. A small company’s advance matters as much as a large company’s.
Why It Differs From Price Indices
The S&P 500 is dominated by its largest constituents. Apple, Microsoft, NVIDIA – these giants can push the index higher even as most stocks fall.
The A/D Line treats all stocks equally. If 3,000 stocks rise and 1,000 fall, the A/D Line rises – regardless of the size of those companies.
This difference reveals participation. Are many stocks rising (healthy), or just a few (concerning)?
📈 Reading the A/D Line
| Market Condition | A/D Line Behavior | What It Means | Signal |
|---|---|---|---|
| **Index rising** | A/D rising | ✅ Healthy breadth | Continue long |
| **Index rising** | A/D flat/falling | ⚠️ Divergence | Caution |
| **Index falling** | A/D falling | ✅ Confirms weakness | Continue short |
| **Index falling** | A/D flat/rising | ⚠️ Divergence | Reversal possible |
Healthy Alignment (Bullish)
When both index and A/D Line rise together, the market is healthy:
- Broad participation
- Many sectors contributing
- Sustainable advance
- Institutional confidence
Action: Favor long positions, trend following strategies.
Negative Divergence (Bearish Warning)
When the index rises but the A/D Line falls, warning signs flash:
- Narrow leadership (few stocks driving gains)
- Underlying weakness masked by index performance
- Often precedes corrections
- Classic topping pattern
Action:
- Tighten stops on longs
- Consider reducing position sizes
- Watch for confirmation of trend change
- Don’t short yet – divergence can persist
Historical Example – March 2000:
The NASDAQ made new highs in March 2000 while the A/D Line had peaked months earlier. The divergence warned of the dot-com crash that followed.
Positive Divergence (Bullish Opportunity)
When the index falls but the A/D Line holds or rises:
- Underlying strength building
- Selling concentrated in few names
- Often precedes bottoms
- Classic accumulation pattern
Action:
- Watch for price confirmation
- Prepare shopping list for longs
- Don’t catch falling knife yet
- Wait for trend change confirmation
Historical Example – March 2009:
The S&P 500 made lower lows in March 2009 while the A/D Line formed higher lows. The divergence signaled the financial crisis bottom.
⚡ Practical Applications
Confirming Trend Strength
In an uptrend, you want to see:
- New highs in the index
- New highs in the A/D Line
- Broad participation
This confirms the trend is healthy and likely sustainable.
Early Correction Warning
The A/D Line often peaks before the index:
- Participation narrows first
- Fewer stocks making new highs
- Eventually, index follows A/D lower
Use this to:
- Take partial profits
- Raise cash levels
- Tighten stops
- Prepare for opportunity
Accumulation vs Distribution
Accumulation (Bullish):
- Index flat or declining
- A/D Line rising
- Smart money buying broadly
- Eventually leads to breakout
Distribution (Bearish):
- Index flat or rising
- A/D Line falling
- Smart money selling broadly
- Eventually leads to breakdown
🎯 Action Steps
Adding A/D Line to Your Charts
Most platforms offer the NYSE or NASDAQ A/D Line:
- TradingView: Search “$NYAD” or “$NAAD”
- ThinkOrSwim: “NYAD” or “NAAD”
- Other platforms: Look for “Market Breadth” indicators
Daily Routine
Each morning, check:
1. Where is the A/D Line relative to yesterday?
2. Is it confirming or diverging from price?
3. Any significant divergences on multiple timeframes?
Weekly review:
1. Plot A/D Line vs index on weekly chart
2. Note any developing divergences
3. Adjust position sizing based on breadth health
Simple Checklist
- [ ] A/D Line rising with index = ✅ Healthy
- [ ] A/D Line diverging negatively = ⚠️ Caution
- [ ] A/D Line diverging positively = 👀 Watch for entry
- [ ] Multiple days of divergence = 📊 Significant signal
✅ Key Takeaways
- Breadth matters: The A/D Line shows how many stocks participate, not just the big ones
- Divergences warn: A/D Line often leads price at turning points
- Context is key: Divergence alone isn’t a trade signal – wait for price confirmation
- Use with price: The A/D Line complements technical analysis, doesn’t replace it
- Daily tool: Check it each morning like you check the weather
The Advance/Decline Line is the market’s pulse. It tells you whether the body is healthy or if only the head is functioning. Professional traders check the pulse before making decisions. You should too.
Continue Your Journey
Next: [VIX: The Fear Index](/vix-fear-index/)
Previous: [Previous Article](/previous-article/)
Back to: [The Foundry](/foundry/)
This article is part of the Market Internals series from The Foundry — reading the market’s vital signs.
All Articles in This Series
Back to Market Internals series
All Articles in This Series
Back to Market Internals series
📚 Market Internals Series
Back to Market Internals series