VIX Spot Level and Daily Range
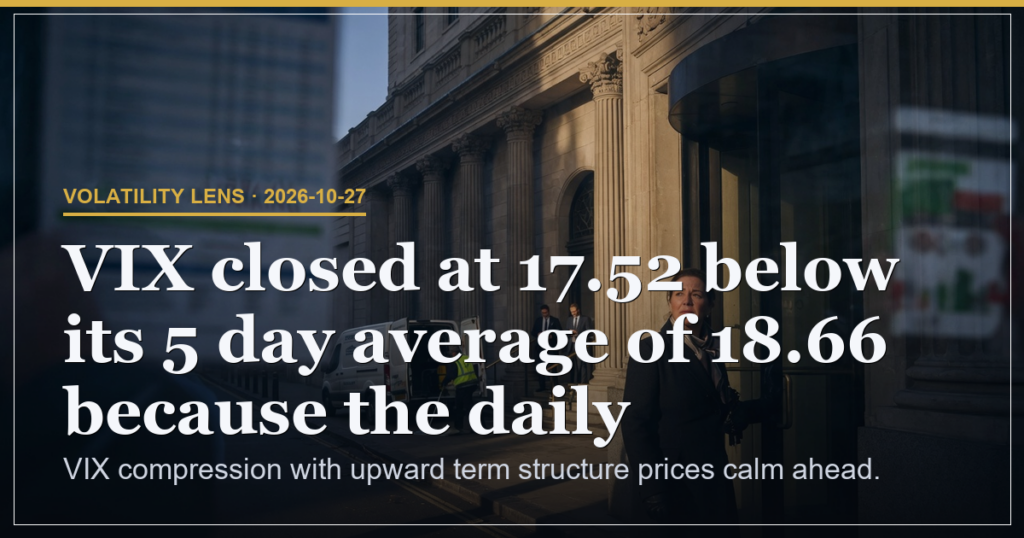
The VIX printed a close of 17.52 after declining 4.73 percent from the prior 18.39 which means the market now prices lower near term turbulence because the daily drop measured 0.87 points. The session low reached 17.43 while the high stopped at 18.55 which means any sustained breach of those bounds would shift the current compression regime. Zero volume on the print confirms the level reflects index mechanics rather than fresh trading activity which means the decline stems purely from options pricing adjustments.
Term Structure and Volatility of Volatility
VIX9D sat at 16.65 beneath the spot 17.52 which means the front curve holds in contango and signals lower volatility expectations over the next nine days. VVIX reached 99.45 against the five day VIX average of 18.66 which means volatility of volatility remains moderate and limits the chance of sudden VIX spikes. This configuration follows the further 0.87 decline from yesterday’s 18.39 close which means the easing has extended one more session without reversal.
Five Day Average Comparison
The current 17.52 level trades 1.14 points below the five day average of 18.66 because the cumulative daily declines have already pulled fear readings into calmer territory. That gap means the market has priced out part of last week’s turbulence and any retest of 18.66 would require fresh negative catalysts to materialise.
| Metric | Value | Implication |
|---|---|---|
| VIX close | 17.52 | 4.73 percent daily drop compresses near term fear |
| VIX9D versus spot | 16.65 versus 17.52 | Contango reduces expected turbulence ahead |
Key Levels and Risk Assessment
Support sits at the 17.43 low while resistance stands at the 18.55 high which means those prints define the immediate boundaries for any regime shift. The 22 percent risk measure attaches to the possibility of a quick VIX rebound because the five day average still lies above current levels and could act as a magnet on any adverse news flow.
| Metric | Value | Implication |
|---|---|---|
| Five day VIX average | 18.66 | Current print 1.14 points below signals sustained easing |
| VVIX level | 99.45 | Moderate vol of vol caps acceleration risk |
Scenario Probabilities
Continuation below 17.43 carries 45 weight because further compression would confirm the contango signal. A retest of 18.55 holds 30 weight because that resistance aligns with the five day average and would require renewed macro pressure. An isolated VVIX jump above 105 carries 25 weight because that move would indicate second derivative stress even if spot VIX stays contained.
Experience Level Focus Points
| Level | Observation from Tape |
|---|---|
| Beginner | Note how VIX9D below spot VIX alters the near term fear reading |
| Intermediate | Track the gap versus the five day average for signs of mean reversion |
| Advanced | Monitor VVIX reaction to any equity index move above 7,756 for second order effects |
VIX compression with upward term structure prices calm ahead.
This is analysis, not financial advice. Always manage your risk.