VIX Spot and Daily Movement
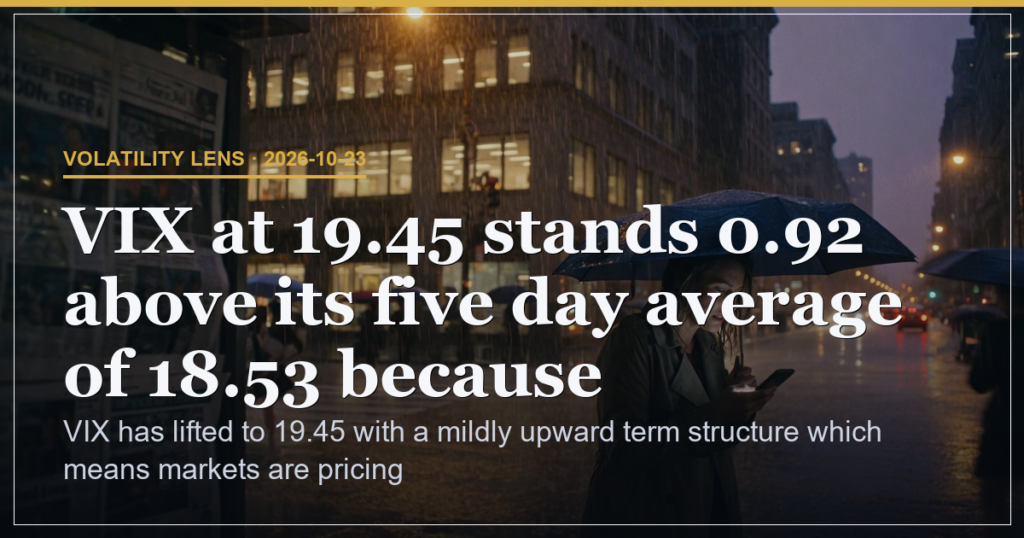
VIX settled at 19.45 after a 2.21 percent rise because the intraday high reached 20.66 which lifted the close 0.42 above the prior session. This move places the index 0.92 above its five day average of 18.53 because realised moves have increased over the past week. The session ranged from a low of 18.87 to the high of 20.66 which means the daily swing measured 1.79 points and expanded the prior calm baseline.
Term Structure and Curve Shape
VIX9D at 18.70 lies 0.75 below spot VIX which means the front of the curve remains in mild contango. The narrow gap signals that shorter dated volatility trades below the thirty day measure because hedging demand has not yet concentrated at the very front. Yesterday the same spread sat in a flatter configuration before the spot index lifted faster which means the term structure has steepened modestly on the latest repricing.
Volatility of Volatility Signals
VVIX printed 109.70 which signals elevated volatility of volatility and therefore wider swings in the VIX itself. This second order reading sits above recent session levels because uncertainty around the VIX path has increased alongside the spot rise. The combination keeps implied moves larger than the five day average would have suggested because the volatility surface now prices more dispersion.
| Metric | Value | Meaning |
|---|---|---|
| VIX close | 19.45 | 0.92 above five day average because realised equity moves widened |
| VIX9D minus spot | -0.75 | Mild contango persists which reduces immediate front month hedging cost |
Key Levels and Session Range
VIX support rests at the session low of 18.87 while resistance sits at the session high of 20.66. A sustained print above 20.66 would extend the recent expansion because the high already tested that ceiling intraday. Conversely a close back below 18.87 would compress the index toward the five day average because the low marked the session floor.
| Level | Number | Implication |
|---|---|---|
| Support | 18.87 | Session low that capped downside and would signal compression if reclaimed |
| Resistance | 20.66 | Intraday high whose breach would extend the volatility expansion |
Scenario Weights and Risk Drivers
A break above 20.66 carries 35 percent odds because that would confirm further expansion in realised moves. Holding between 18.87 and 20.66 carries 40 percent odds because the current range has contained price after the 2.21 percent daily gain. A drop below 18.87 carries 25 percent odds because that would return the index toward the five day average of 18.53. Risk sits at 22 percent driven by the VVIX reading of 109.70 which widens potential VIX swings.
What Each Experience Level Should Watch
| Level | Focus from Tape |
|---|---|
| Beginner | Track whether VIX stays above or below its five day average of 18.53 on each close |
| Intermediate | Monitor the VIX9D to spot gap for signs the contango is narrowing or widening |
| Advanced | Watch VVIX at 109.70 for confirmation that second order volatility remains elevated |
VIX has lifted to 19.45 with a mildly upward term structure which means markets are pricing moderate uncertainty rather than outright calm.
This is analysis, not financial advice. Always manage your risk.