The Macro Pulse post this morning laid out the week’s key catalysts: a new Federal Reserve Chairman, Tuesday’s Consumer Confidence print, Wednesday’s GDP revision, and Thursday’s PCE. It also flagged the extraordinary bond-equity correlation at -0.70, a level not seen since 1999. All of that macro context is now the backdrop against which this sentiment picture becomes genuinely striking.
Because the divergence between how people feel and where prices are sitting is not a minor statistical quirk. It is one of the widest gaps of the last seventy years. Understanding it is not just an academic exercise. It has direct implications for how Tuesday’s Consumer Confidence data lands and whether the equity market can hold its current position if sentiment deteriorates further.
The Fear and Greed index sits at 58.6, in greed territory. That sounds comfortable. But it is the combination of this reading with the data points below it that tells a more complex story.
The weekly AAII Investor Sentiment Survey for the week ending 20 May shows a sharp deterioration. Bullish sentiment dropped 7.6 percentage points in a single week, from 39.3% to 31.7%. That reading is now below the historical average of 37.5% for the first time in five weeks.
Neutral: 24.7%
Bear: 43.6%
With 43.6% of AAII respondents bearish and only 31.7% bullish, the individual investor community is more negative than it is positive by a significant margin. The historical average for bearish sentiment is 31.0%. We are 12.6 percentage points above that. The one-year bearish high was 52.0% in mid-March, so there is headroom for this to worsen.
Historically, extreme AAII pessimism has been a contrarian signal. When retail investors are this negative, professional money tends to be better-positioned on the other side. But the contrarian signal only works if the macro backdrop is not actually deteriorating. Given the PCE, Warsh, and Iran variables in play this week, the usual contrarian read deserves more caution than normal.
US consumer sentiment has just fallen to its lowest level since 1952. The University of Michigan index dropped another 10% last month and is now down 21% since February 2026. Consumers expect inflation to reach 4.8% over the next twelve months. That expectation matters as much as the reality, because it drives spending behaviour, wage demands, and business pricing power.
At the same time, the S&P 500 sits at 7,473, the Dow at 50,580, and US ETFs are on track for their third consecutive annual inflow record at $852 billion year to date. The stock market is not reflecting the consumer’s mood at all.
This divergence has happened before, but rarely at this magnitude and rarely with a new central bank chairman arriving simultaneously. The last time the stock-bond correlation and the consumer-equity divergence were both at extremes simultaneously was around the 1999-2000 period. That is not a forecast. It is a reference point.
Two explanations are worth taking seriously. First, the people who own most of the equities are not the same people who are most stressed by inflation and tariffs. The top 10% of US households own roughly 93% of US equities. Their sentiment is not captured well by the University of Michigan survey. Second, passive ETF inflows of $852 billion create mechanical buying pressure that is largely insensitive to sentiment. The machine buys regardless.
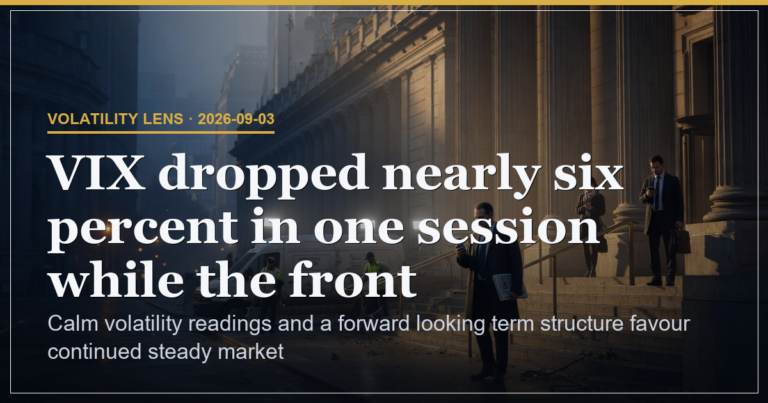
The VIX closed at 16.70, down marginally on the day. The five-day average is 18.45, meaning spot VIX is trading below its recent average, which on a normal day reads as complacency. The VIX3M (three-month implied volatility) is at 20.03, creating a normal upward term structure where near-term vol is cheaper than medium-term vol. That is the market saying: we are not worried about next week, but we are not entirely comfortable about what comes in the next few months either.
The VVIX, which measures the volatility of volatility itself, sits at 91.16. This is the more interesting number. VVIX above 90 means options on the VIX are pricing meaningful uncertainty about the vol regime itself. In other words, the market is not sure whether VIX is going to stay low or spike, and it is pricing that uncertainty through the VIX options market. That is not the signature of a market that feels safe. It is the signature of a market that has bought insurance without knowing whether it needs it.
The spread between VIX at 16.70 and VIX3M at 20.03 is 3.33 points. A spread this wide in a normal market reflects expected calm near-term and caution medium-term. In this particular week, with a closed Monday, PCE Thursday, and Iran risk over the weekend, it may simply reflect the fact that the options market cannot properly price events it cannot schedule.
| Sector | ETF | Close | Change | Sentiment Read |
|---|---|---|---|---|
| Technology | XLK | $180.39 | +1.00% | Strongest sector Friday. Micro chip shortage extension is a demand signal. AI infrastructure theme intact. |
| Healthcare | XLV | $149.89 | +1.17% | Best sector performer on the day. Defensive positioning into macro uncertainty. Consistent with AAII bearishness. |
| Industrials | XLI | $171.77 | +0.73% | Strong. South Korea export read-through. AI infrastructure capex is an industrial demand story as much as a tech one. |
| Energy | XLE | $59.49 | +0.61% | Iran risk bid. Not yet pricing a full escalation, but the floor is clearly higher. Watch over the weekend. |
| Financials | XLF | $51.94 | +0.41% | Warsh appointment is net positive for banks if it signals tighter for longer. But uncertainty is the immediate variable. |
| Utilities | XLU | $45.35 | +0.78% | Strong gain for a defensive sector. When utilities rally with technology, it is often a sign of indiscriminate buying rather than a directional call. Watch for divergence. |
| Consumer Staples | XLP | $84.80 | +0.17% | Muted relative to broader market. Consumer staples typically lead defensive rotations. The lack of outperformance here is one reason the overall sentiment picture remains mixed. |
| Real Estate | XLRE | $44.56 | +0.13% | Lagging badly. Rate-sensitive sector struggling. If yields ease into PCE, this could catch up fast. Watch as a yield-direction signal. |
Healthcare and Utilities leading on a green day is not a classic risk-on signature. When defensive sectors outperform alongside technology in a broad market rally, it usually means two distinct groups are buying at the same time with different agendas. Active money is going defensive. Passive money is going everywhere because it has to. The net result looks like a rally, but the internal structure is cautious.
This is exactly what the AAII data supports. Individual investors are bearish at 43.6%, but the index is near all-time highs because the ETF machine does not ask how they feel. Consumer sentiment at a seventy-four year low is real. Record ETF inflows are also real. Both things are true simultaneously, and that is the tension that Tuesday’s Consumer Confidence print will either ease or intensify.
Consumer Confidence Tuesday comes in better than the Michigan read suggested. AAII bearishness begins to unwind as a contrarian signal plays out. VIX drifts toward 15. Fear and Greed pushes toward 65.
Tuesday’s data neither surprises nor disappoints. VIX stays in the 15-18 range. AAII does not move significantly. Sentiment remains split, the market drifts, and the real resolution waits for PCE Thursday.
Consumer Confidence confirms the Michigan collapse. AAII bearish readings climb back toward 50%. VIX lifts above 20 as the PCE fear trade builds. Fear and Greed retreats toward 45, entering neutral territory.
Iran escalation over the weekend resets everything. VIX gaps open above 25 in Tuesday’s session. Fear and Greed collapses toward 30. Defensive positioning that has been building quietly becomes immediately validated.
The primary sentiment risk factor is the divergence between consumer mood and equity prices. The longer that gap persists without a fundamental resolution, the more violently it tends to close. The secondary factor is the VIX term structure: VVIX at 91 tells you the options market itself is uncertain about the vol regime, which is rarely comfortable background noise. The Fear and Greed at 58.6 is not extreme in either direction, which actually makes it slightly unhelpful as a signal right now. Markets that sit in the middle of the greed zone tend to be vulnerable to sharp moves in either direction when a catalyst arrives, because there is no deep contrarian positioning to act as a buffer. PCE Thursday is that catalyst.
The Volatility Lens post that follows this one goes deeper into the VIX structure, the options positioning, and what the term spread between spot VIX and VIX3M is actually pricing for the week ahead. Given the macro backdrop described in the Macro Pulse earlier, and the sentiment picture here, the vol regime analysis is the piece that determines where the asymmetry lies heading into Tuesday’s open.
This content is for informational and educational purposes only and does not constitute financial advice, investment advice, or a recommendation to buy or sell any financial instrument. Past analysis does not guarantee future accuracy. All market data referenced reflects conditions at the time of writing. Trading financial markets involves significant risk. Never risk more than you can afford to lose. Seek independent financial advice before making any investment decisions.
Deepen Your Understanding
Related articles from the Titan Protect Foundry: