S&P 500 (SPX) – Daily Read
10 October 2026 | Index | Titan Macro Desk
7,765.4
The S&P 500 is consolidating within an established advance, not yet showing a meaningful loss of control by buyers. Last price is 7,765, 0.0 percent higher on the day, while the index is holding in the upper half of its one-month range. That combination points to digestion near the highs rather than outright rejection. The clear view is constructive, but upside confirmation still matters because the market is close enough to resistance for positioning and profit-taking to create a sharp response.
The broader backdrop is a contest between confidence in resilient growth and uncertainty around inflation, monetary policy, earnings durability, and fiscal direction. For an index, that matters through valuation, bond-market conditions, and the breadth of corporate profit expectations. The S&P 500 is also being driven by whether leadership remains strong enough to pull the wider market higher. Momentum is roughly 1.1 percent up over the last two weeks, which supports the bullish structure without suggesting that price has already accelerated beyond control. The one month average is 7,718; price is above it, and the structure reads as a clean uptrend, with price above both its one-month and longer averages.
The immediate pivot is the nearer round number handle at 7,750. Holding above it keeps buyers in control of the short-term tape and preserves 7,718 as a secondary reference for orderly pullbacks. The month swing high is 7,845, about 1.0 percent above the current price. That level matters because it marks the edge of both recent progress and the three month range of 7,314 to 7,845. A decisive move above 7,845 would show that supply at the range ceiling has been absorbed and opens the path toward the other round number handle at 8,000. Below, a shelf of support at 7,508, about 3.3 percent below, is the more important structural defense. It represents the point where a routine consolidation would begin to look like a failed advance. Losing 7,508 exposes 7,314 and would shift attention from buying dips to managing a deeper range reset.
The bull path is straightforward: if the index continues to defend 7,750, remains above 7,718, and then closes decisively through 7,845, the market should attract breakout demand and challenge 8,000. The quality of that move would depend on participation broadening beyond the largest constituents. The bear path is equally clear: if price slips through the nearby handles, cannot recover the one month average, and selling then breaks 7,508, the uptrend would lose its key support and 7,314 would become the logical downside destination.
The principal risk to the constructive view is a macro shock that tightens financial conditions or undermines earnings expectations while the index is pressing resistance. The bullish read is invalidated by a sustained loss of 7,508. The bearish case is invalidated by acceptance above 7,845. Net, the trend remains upward, but the next high-conviction signal comes from resolution at the range ceiling, not from chasing price just beneath it.
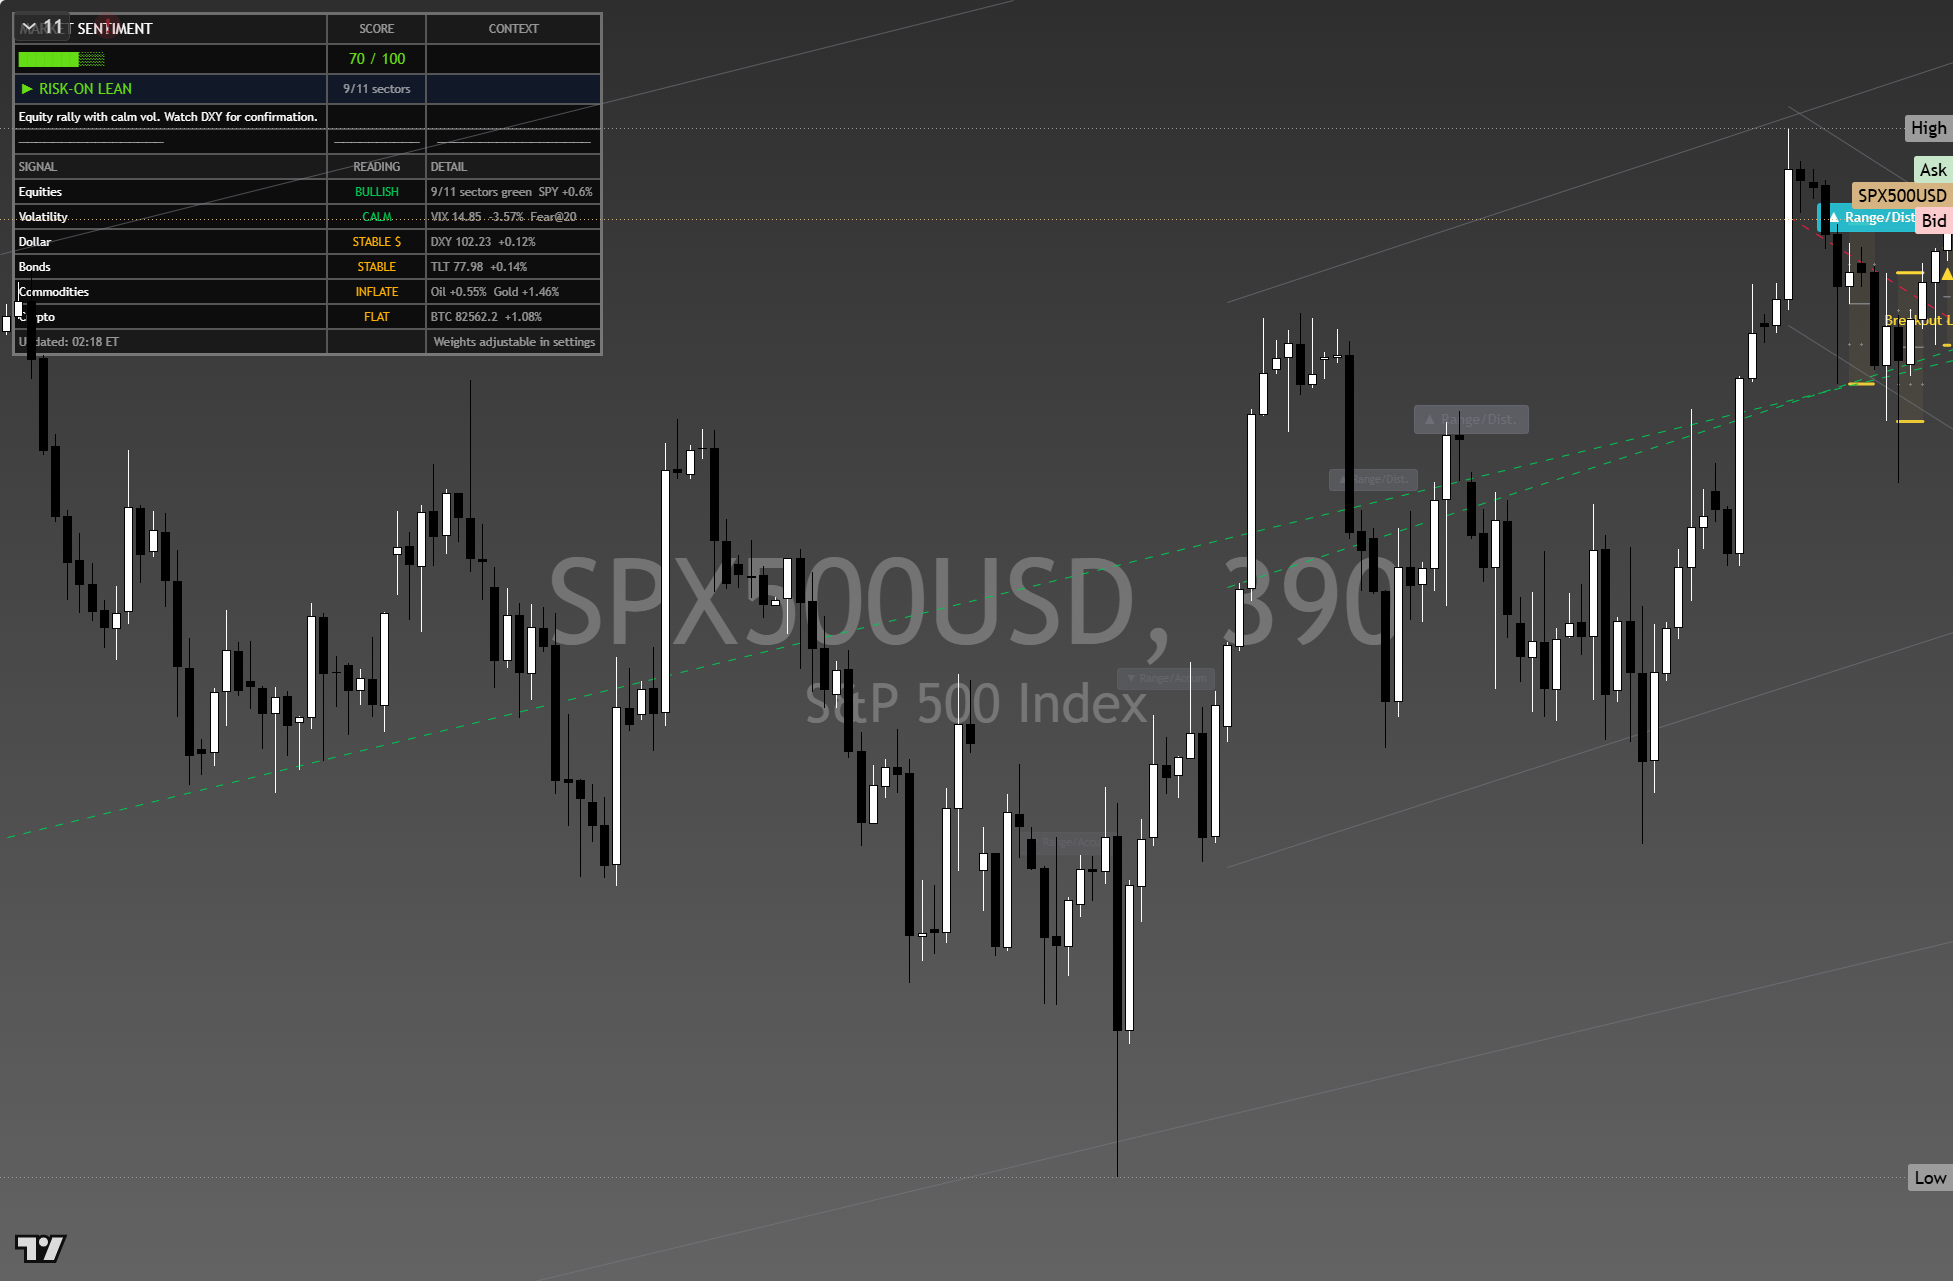
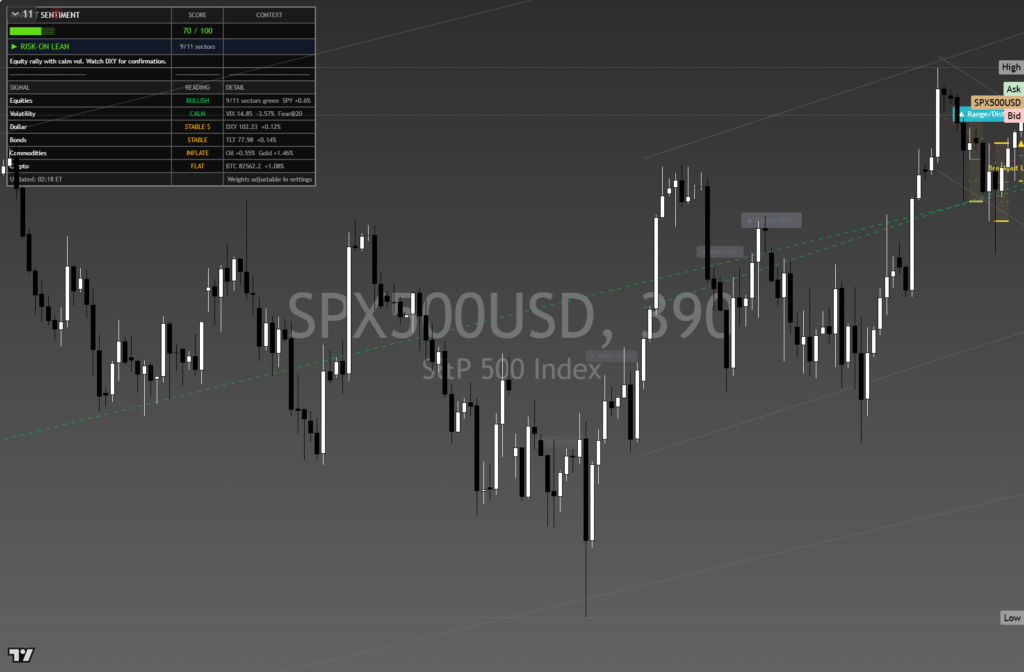
The chart above is the full daily read: structure, momentum, the levels that matter, and where the current price sits against them. Read it top to bottom for the complete picture, and pair it with our session briefs for the wider market context.
This is analysis, not financial advice. It reflects our multi-factor framework and is not a recommendation to buy or sell. Always do your own research and manage your risk.