USD/JPY – Daily Read
10 October 2026 | Forex | Titan Macro Desk
$158.26
USD/JPY remains a buy-on-dips market, but the trade is entering a more difficult zone where trend strength meets rising policy resistance. Last price is 158.26, 0.2 percent higher on the day, and it is pressing the top of its one-month range. That matters because continued dollar demand is now testing whether this is a durable extension or a crowded move vulnerable to a sharp yen recovery. The directional view stays constructive while the recent base holds, although fresh exposure near the range ceiling requires confirmation rather than enthusiasm.
The macro backdrop still favors the dollar through resilient US activity, persistent inflation concern, and expectations that Federal Reserve policy will remain restrictive. Recent [Federal Reserve minutes](https://www.federalreserve.gov/monetarypolicy/fomccalendars.htm) reinforced the prospect of further tightening, supporting US yields and the carry behind USD/JPY. Japan is pulling the other way. The Bank of Japan is normalizing policy more assertively, while government concern about yen weakness is becoming more explicit. The prime minister has emphasized scrutiny of currency and price developments, and the [Bank of Japan’s policy communication](https://www.boj.or.jp/en/mopo/mpmsche_minu/index.htm) keeps additional tightening credible. That creates an important asymmetry: the prevailing yield advantage supports the pair, but the higher it trades, the greater the risk of tougher official language, faster normalization expectations, or direct resistance to yen depreciation.
The one month average is 157.64; price is above it, and the structure reads as a clean uptrend, price above both its one-month and longer averages. Momentum is roughly 0.6 percent up over the last two weeks, showing steady accumulation rather than a disorderly surge. The month swing high at 159.04, about 0.5 percent above the current price, is the immediate test because it separates range pressure from confirmed continuation. Beyond it, 160.00 is the nearer round number handle and a likely focus for profit-taking and official sensitivity. The broader three month range is 152.88 to 163.95, making its upper boundary the natural destination if buyers establish acceptance above resistance. Below, 155.00 is the first psychological handle, while a shelf of support at 154.20, about 2.6 percent below, is the more important structural defense. It marks the area where dip buyers must prove the trend remains intact.
The bull path is straightforward: if USD/JPY makes a decisive move above 159.04, then resistance has been absorbed and the path opens toward 163.95. Holding above the breakout would matter more than a brief spike, especially around 160.00, where policy headlines could test conviction. The bear path begins if rejection near the range top forces price back through 157.64. If that weakness extends through 155.00, then attention shifts to 154.20. Losing 154.20 exposes 152.88 and would turn an orderly pullback into a broader structural reversal.
The principal risk to the bullish read is a faster narrowing of the policy gap, whether driven by tougher Bank of Japan action, softer US expectations, or stronger Japanese official resistance. A failure above 159.04 followed by sustained trade below 154.20 would invalidate the continuation case. Net, the trend favors further upside, but confirmation is essential because the reward above the range is paired with growing policy and reversal risk.
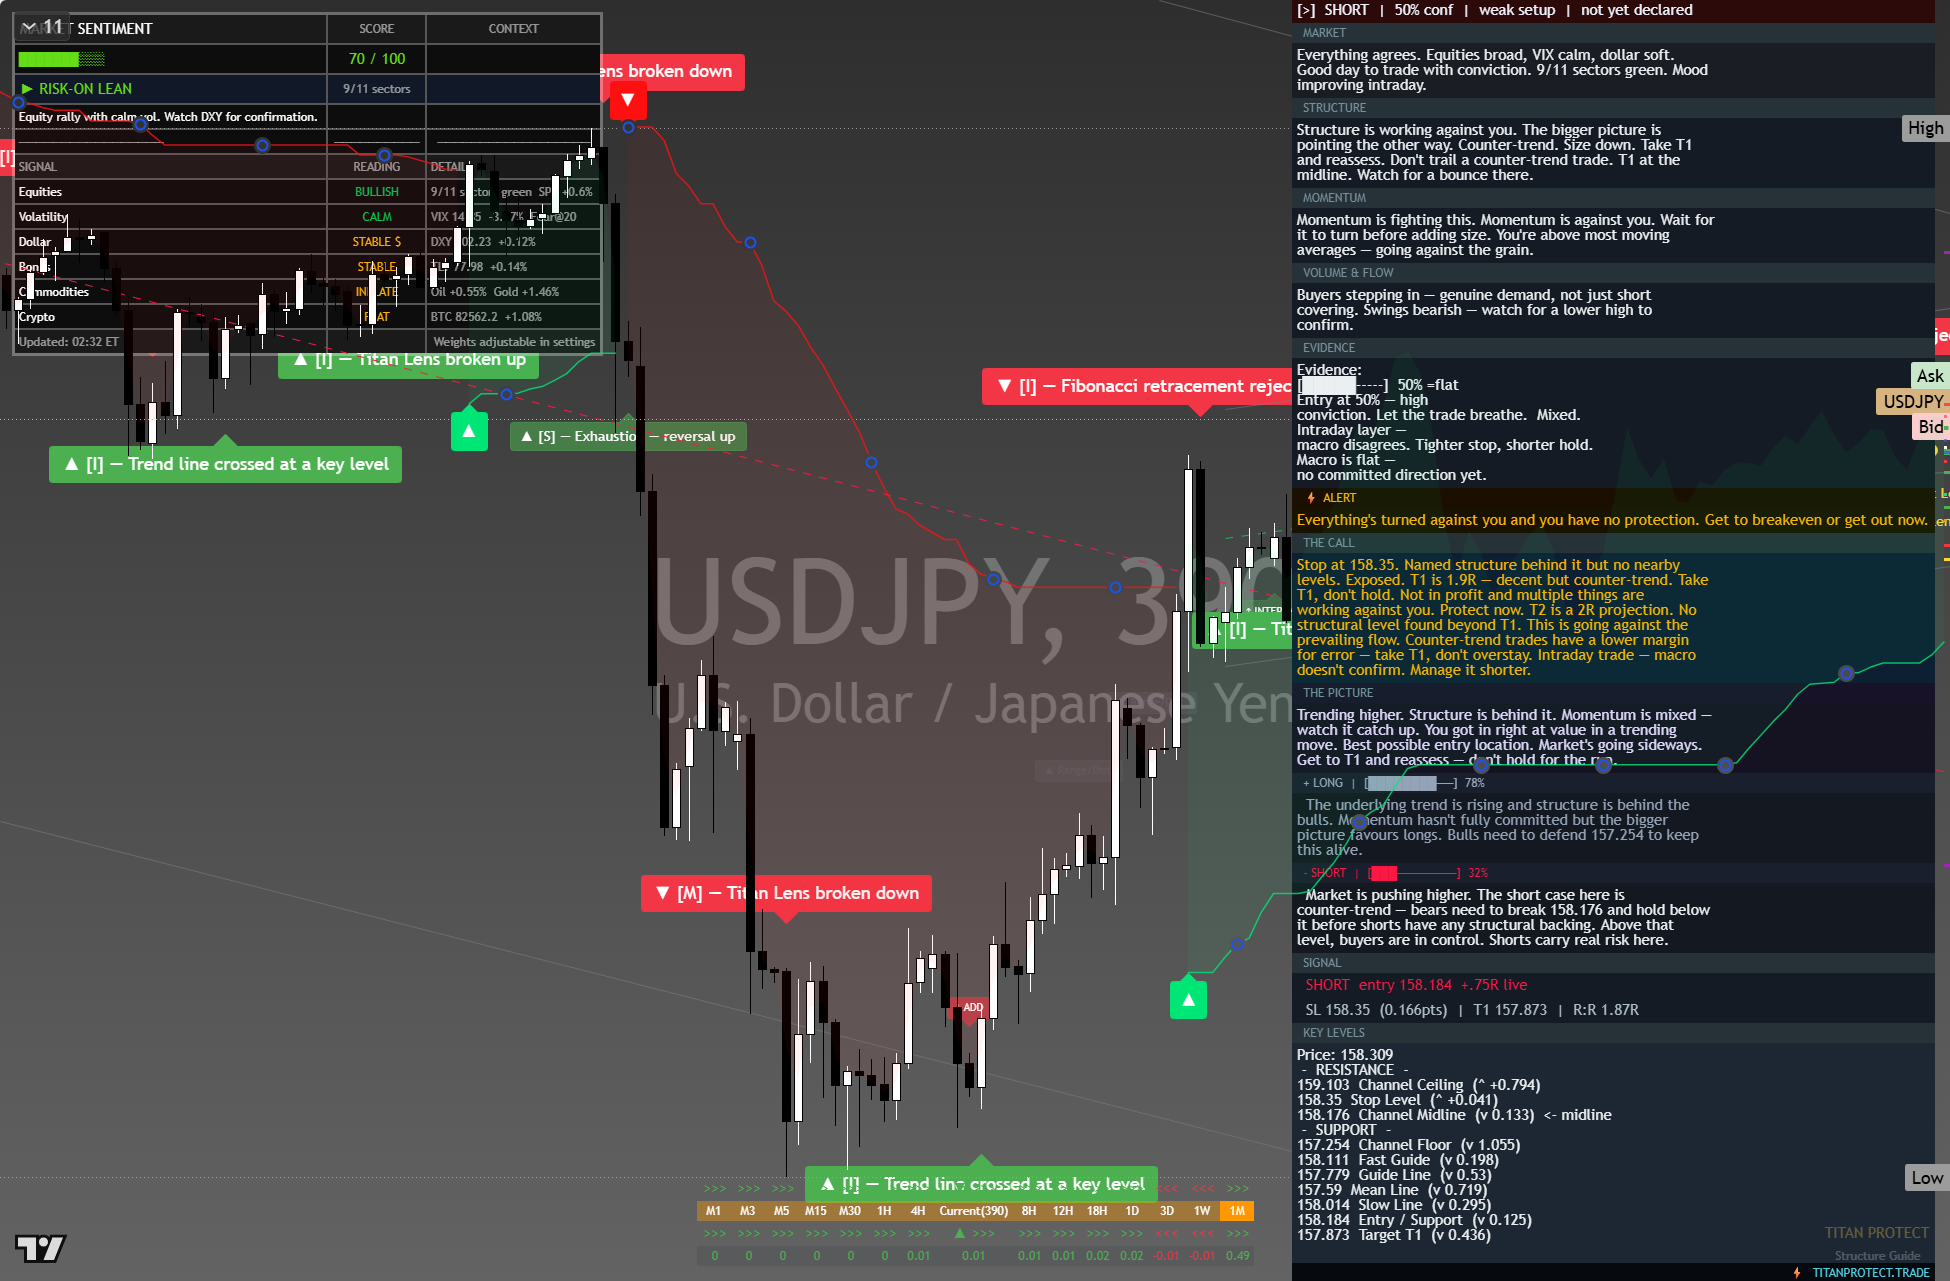
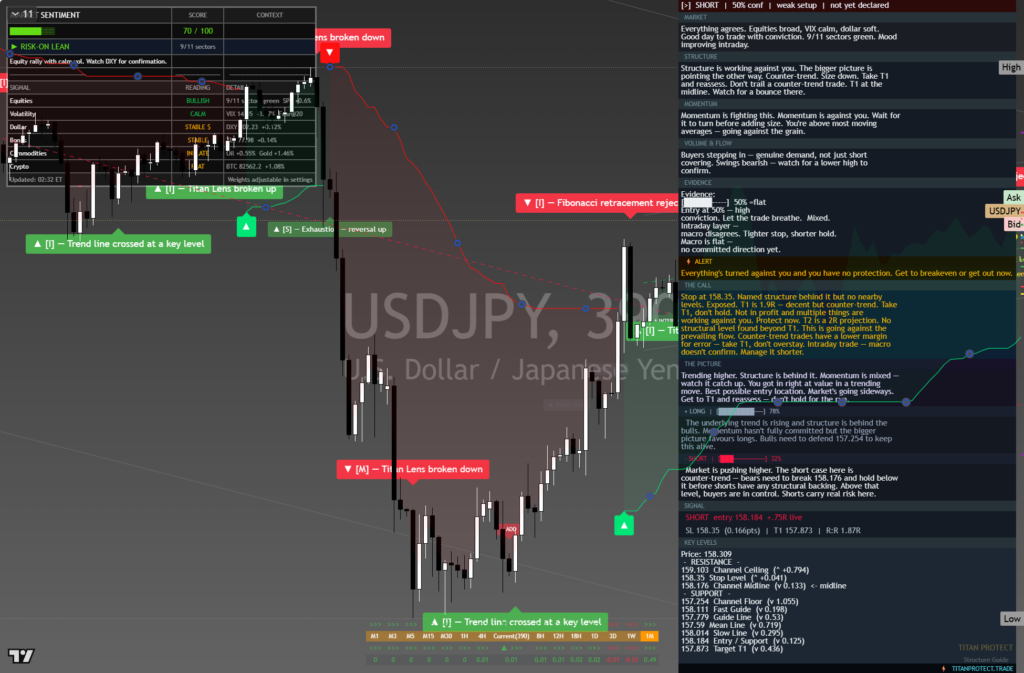
The chart above is the full daily read: structure, momentum, the levels that matter, and where the current price sits against them. Read it top to bottom for the complete picture, and pair it with our session briefs for the wider market context.
This is analysis, not financial advice. It reflects our multi-factor framework and is not a recommendation to buy or sell. Always do your own research and manage your risk.