Figures as of the 28 Oct 2026 close; published 29 Oct 2026.
Sector Performance Breakdown
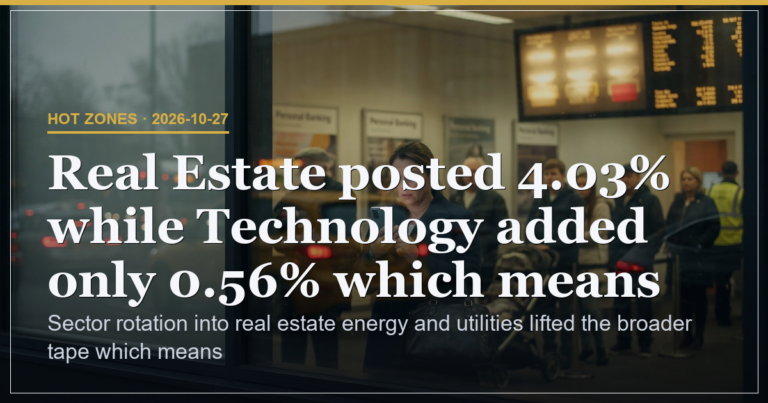
Real Estate rose 4.06 percent which means capital rotated into rate sensitive areas and lifted the broader tape because the largest single day move concentrated in one area and drove index breadth. Energy gained 3.22 percent which means commodity strength fed through to equities and supported indices at current levels because supply tightness broadened participation beyond technology. Utilities advanced 3.06 percent which means defensive yield plays participated and reduced downside pressure on the market because income sectors attracted flows that stabilised the tape. Consumer Defensive climbed 2.36 percent which means staples provided steady support that limited downside volatility and confirmed the shift into cyclicals because the move followed commodity strength in materials. Basic Materials added 2.0 percent which means materials followed commodity strength and showed rotation into value areas that reduced reliance on narrow leadership because the advance occurred alongside energy gains.
| Real Estate 4.06 percent | led all sectors and concentrated the single largest move driving index breadth |
| Energy 3.22 percent | fed commodity strength into equities supporting index levels |
| Utilities 3.06 percent | joined defensive yield participation reducing downside pressure |
Index Level Analysis
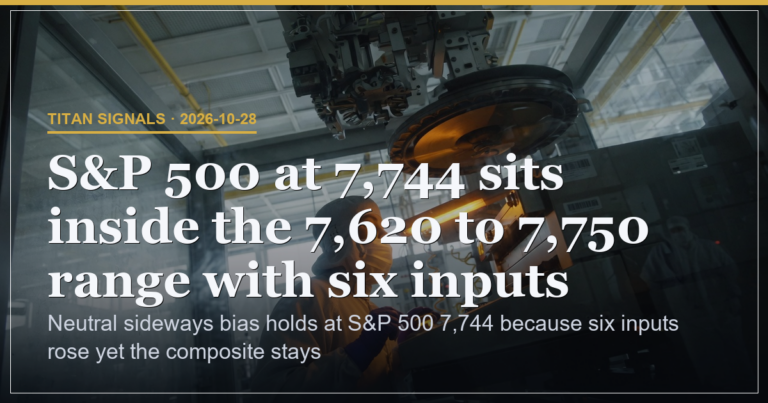
SPX closed at 7743.98 up 0.28 percent which means large cap breadth stayed positive because the advance held above support at 7718.37 and faced resistance at 7758.43. NDX closed at 29813.16 up 0.55 percent which means growth indices participated fully because futures cleared the low at 29618.42 and faced resistance at 29848.71. SPY printed 772.31 up 0.34 percent which means the lead ETF tracked the positive sector moves because volume reached 29.3 million shares on the session. QQQ printed 725.61 up 0.6 percent which means growth participation aligned with energy and real estate leadership because the close sat inside the upper half of the daily range.
| SPX support 7718.37 | held on the session which means breadth remained intact above the level |
| NDX resistance 29848.71 | marked the high which means further upside requires a break above it |
Rotation Dynamics
Real Estate led all sectors with a 4.06 percent gain which means the largest single day move concentrated in one area and drove index breadth because lower borrowing costs lifted property valuations and pulled flows away from growth names. Energy and utilities joined with gains above 3 percent which means defensive cyclical rotation broadened participation because commodity and yield exposure supported the tape beyond technology. The shift lifted consumer defensive and basic materials above 2 percent which means value areas reduced reliance on narrow leadership because the advance occurred on volume exceeding 3 billion shares in the S&P 500.
Scenario Probabilities
SPX holds above 7718.37 support carries 55 weight because sustained sector rotation keeps breadth intact. A move above 7758.43 resistance triggers 30 weight because the next leg higher opens once resistance clears. A close below 7718.37 support carries 15 weight because downside pressure increases if the level breaks.
Risk and Experience Watchpoints
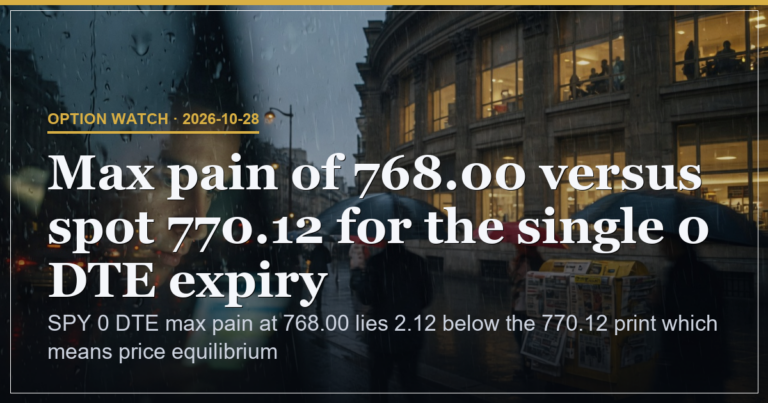
Risk sits at 18 percent because the largest single day move concentrated in real estate leaves the tape exposed to any reversal in rate sensitive areas. Position Pressure shows call heavy flows align with the 768 max pain level which means equilibrium rests slightly below current prints.
| Beginner | Watch how real estate outperformance affects the daily tape range |
| Intermediate | Track whether energy and utilities sustain gains above 3 percent into the next session |
| Advanced | Monitor the gap between SPX support at 7718.37 and resistance at 7758.43 for breadth shifts |
Broad positive sector moves led by real estate and energy keep equities biased higher while levels remain intact.
This is analysis, not financial advice. Always manage your risk.