
Predictive Edge Series
Predictive Edge 04: Trend Analysis
Trading against the trend is not brave. It is expensive. Understanding trend health before you enter is how you avoid paying for lessons the market charges full price for.
What a Trend Actually Is
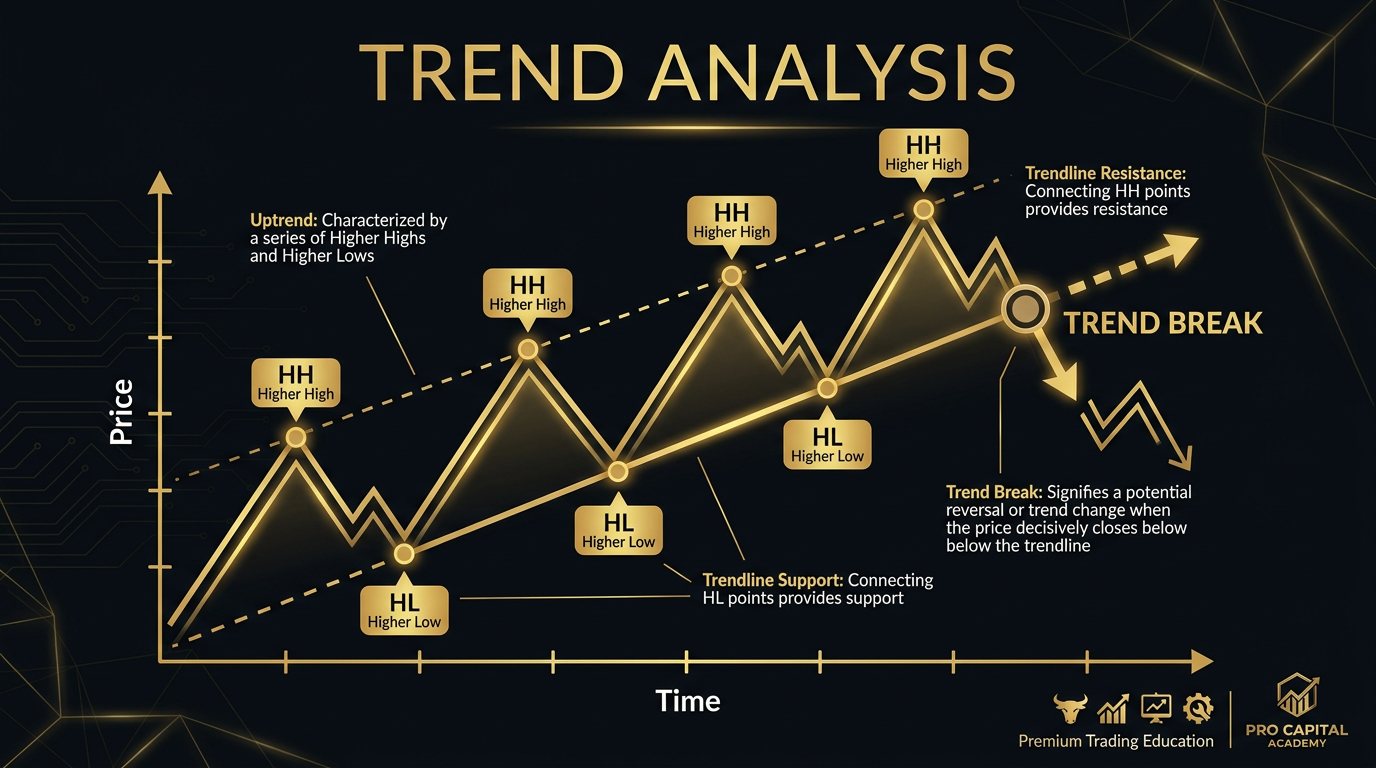
A trend is a sequence of price behaviour in which the market consistently makes progress in one direction. An uptrend is defined by higher highs and higher lows: each rally reaches a higher price than the previous rally, and each pullback holds above the low of the previous pullback. A downtrend is the inverse: lower highs and lower lows, with each rally failing to reach the high of the prior one and each decline extending below the prior trough.
This definition is simple and it is the correct place to start. Most traders understand the concept. The practical difficulty is in applying it consistently, particularly during the pullback phases of a trend when price is moving against the prevailing direction and the temptation to reverse position is greatest. A pullback within an uptrend will feel like a reversal as it is happening. The bars are moving down. The news around the instrument may be negative. The emotional pressure is to get short. The structural read tells you the opposite: the trend remains intact as long as the prior higher low holds.
The failure to distinguish between a pullback and a reversal is responsible for a large proportion of trend-related losses. Traders exit valid long positions during normal pullbacks and re-enter too late, missing the continuation. Or they short the pullback in an uptrend, get stopped out when the trend resumes, and then miss the move they were trying to trade from the other side.
The Three Trend Phases
Trends tend to develop in recognisable phases, each with different characteristics and different implications for how to position within them. Understanding which phase the market is in changes what kind of entry is appropriate and where the genuine risk is.
The accumulation phase is the beginning. Price has been in a downtrend or a range. Smart money and institutional participants begin building positions at levels they consider undervalued. Volume picks up at lows without a corresponding acceleration in price. The bars start to hold higher lows. This phase is difficult to identify in real time because it looks like every prior failed rally. The entry here is early and carries higher risk, but the potential reward relative to where the trend eventually reaches is at its largest.
The participation phase is where the trend becomes visible to a wider audience. Higher highs and higher lows are established. Momentum is strong. Institutional buying is joined by trend-following participants and eventually retail traders. This is the most commonly traded phase because the trend is confirmed and entries on pullbacks to prior highs-turned-support offer a clear structural case with manageable risk.
The distribution phase is where institutional participants who built positions early begin selling into strength. The trend may still be making new highs, but the bars are getting smaller, volume at the highs is declining, and the higher highs are being made by increasingly smaller margins. This is the phase where late trend entries are most dangerous. The structural uptrend is still technically intact, but the engine behind it is losing fuel.
Measuring Trend Health
The health of a trend is not a binary condition. Trends do not simply exist or not exist. They are strong, weakening, or failing, and reading which of those states applies changes how you should interact with the market.
A strong trend shows consistent progress in the trend direction with contained pullbacks. The pullbacks retrace a minority of the prior swing, typically less than half. Each new high or low extends meaningfully beyond the prior one. Volume expands on the moves in the trend direction and contracts on the pullbacks. This is the condition where holding positions through short-term volatility is rewarded.
A weakening trend shows the pullbacks beginning to deepen. The retracements reach more than half of the prior swing. New highs or lows are being made by smaller increments than before. Volume on the trend moves is declining relative to volume on the pullbacks. This is not yet a reversal signal, but it is a signal to tighten stops, reduce position size, and be more selective about new entries.
A failing trend shows the sequence of higher highs and higher lows breaking down. A pullback that takes out a prior higher low is the first structural warning. If price then fails to make a new high above the previous swing, the trend has formally broken. The market is now in transition. The correct response is to close trend-following positions and wait for the new structure to clarify, not to add to positions on the assumption that the trend will resume.
The Counter-Trend Trap
Counter-trend trading attracts traders for a specific psychological reason: fading an established trend feels clever. You are going against the crowd. You are anticipating the reversal. The implied narrative is that everyone else is following the trend mindlessly while you are seeing something they are not.
The problem is that trending markets can continue far longer than counter-trend analysis suggests. A market that looks overbought on a momentum basis in the middle of a strong participation phase may continue to look overbought for weeks while continuing to make new highs. The statistical probability of any given counter-trend setup stopping the trend is low. The market does not reverse because a single setup looks compelling. It reverses when the structural conditions that supported the trend deteriorate to the point where they no longer hold.
This does not mean counter-trend trading has no place. It means counter-trend trades should only be taken with the full weight of structural evidence: trend phase transition signs, volume divergence at highs or lows, multiple timeframe breakdown, and clear structural invalidation of the prior trend sequence. Without those elements, a counter-trend trade is an opinion trade, not a structural trade. Opinion trades are expensive.
Multiple Timeframe Trend Alignment
The trend you are trading on your entry timeframe always exists within the context of the trend on higher timeframes. Trading a bullish setup on the hourly chart during a confirmed downtrend on the daily chart means fighting the higher-timeframe directional bias. Those trades can work, but they require tighter management and have a lower probability of reaching extended targets because the larger participants are positioned against you.
The highest-probability trend trades are those where the trend direction is aligned across at least two timeframes: the higher timeframe confirms the direction and the entry timeframe provides the setup. A daily chart uptrend with an hourly pullback setting up a higher-low entry is the textbook alignment. You are entering in the direction of the larger money with precision on the entry timeframe.
| Trend Health Indicator | Strong Trend | Weakening Trend | Failing Trend |
|---|---|---|---|
| Swing structure | Clear HH/HL sequence | Smaller incremental highs | Prior HL broken |
| Pullback depth | Less than 38% of prior swing | 50% to 62% of prior swing | Full retrace or beyond |
| Volume on trend moves | Expanding, above average | Declining, near average | Thin on advances, heavy on declines |
| Volume on pullbacks | Contracting, below average | Equal to trend moves | Expanding, exceeds trend volume |
| Momentum on new highs | Confirming, consistent | Diverging, lower highs on oscillators | Clear divergence, failing |
| Correct position action | Hold, add on pullbacks | Reduce size, tighten stops | Close positions, wait for new structure |
Action Items
- Before every trade, state the trend status on two timeframes: the daily and your entry timeframe. Write it down: “Daily: uptrend. Hourly: pullback to support.” If they contradict each other, acknowledge the conflict before entering.
- Identify the last three times you took a counter-trend position. Did those trades have full structural evidence of trend phase transition, or were they opinion trades based on the market looking extended? Note the distinction honestly.
- On any position you are currently holding in the direction of a trend, identify the prior higher low. That is your structural stop, the level at which the trend sequence is invalidated. Make sure your actual stop reflects that level, not just a comfortable distance from entry.
- For the next month, only take trend trades in the direction of the daily timeframe trend. Track the win rate and average result separately from counter-trend trades you would have otherwise taken. The comparison will be instructive.
- Pick one instrument and assess its trend health daily for two weeks using the table above. Note when the signals shift from strong to weakening. That transition period is when position management decisions are most important.
Continue Learning
- Predictive Edge 01: Confluence
- Predictive Edge 02: Price Action
- Predictive Edge 03: Support and Resistance
- Predictive Edge 05: Momentum
- Predictive Edge 06: Multi-Timeframe Analysis