
Predictive Edge Series
Predictive Edge 05: Momentum
Momentum is not what an oscillator number says. It is the rate at which buying or selling pressure is building or fading. That distinction changes how you read every setup.
Momentum vs Trend: Related but Different
Trend and momentum are related concepts that are often conflated, and conflating them leads to specific and avoidable errors. Trend describes the direction of price over a sequence of bars. Momentum describes the rate and force of price movement at a given moment. A market can be in an uptrend with declining momentum. A market can be in no clear trend with surging momentum. Reading them as the same thing produces the wrong conclusions.
The practical distinction is this: trend tells you where the market has been and the direction of the dominant bias. Momentum tells you how much conviction exists in the current move. A strong trend with deteriorating momentum is approaching a risk point, either a pause or a reversal. A market in a tight range that suddenly develops strong momentum on a break is signalling a potential trend initiation, even though the trend is not yet established by the sequence of highs and lows.
Most retail traders use momentum indicators to generate entry signals. That is the least reliable application. Momentum is most valuable as a context signal, a read on whether the force behind a price move is building, stable, or fading. Used that way, it materially improves the quality of entries generated by structural analysis.
Reading Momentum Without Relying on Numbers
Oscillators like the RSI or MACD calculate momentum and express it as a number or a line crossing. The number tells you something, but it can also mislead. A reading above 70 in a strong trending market does not mean the market is about to reverse. It means the recent move has been large. The interpretation of whether that is significant depends on context the number itself cannot supply.
The more direct approach is to read momentum from the price bars. The size of individual bars relative to their recent average tells you whether the pace of movement is accelerating or decelerating. Large bars, with closes near the high of the bar in an uptrend, indicate strong buying momentum. The market is moving with conviction and buyers are not waiting for dips. Shrinking bars with closes moving away from the highs indicate the momentum is fading. Buyers are becoming less aggressive. Sellers are beginning to push back within each session.
This bar-by-bar reading of momentum requires no calculation. You are observing the actual evidence of participation force rather than a derived summary of it. The derived summary will always lag by one bar at a minimum. The direct read is in real time.
Divergence That Matters vs Noise
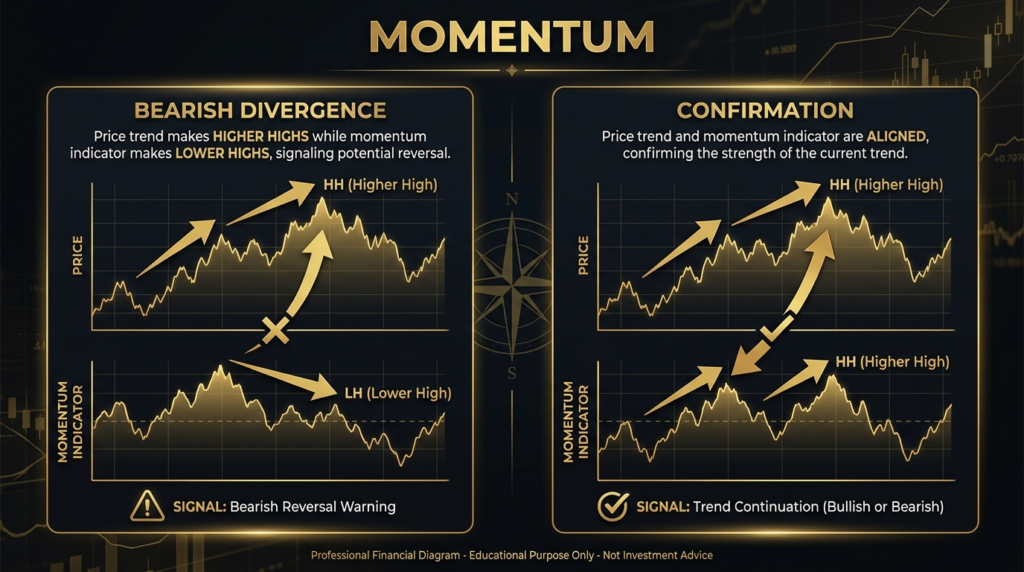
Momentum divergence is the condition where price makes a new high or low but the momentum reading does not confirm it. Price is higher but the pace of buying is not as strong as at the prior high. This is a genuine structural signal when it occurs in the right context, and it is noise when it occurs outside that context.
Divergence that matters typically forms at the end of a long trend move, after an extended period of consistent directional progress. The market has been trending for months. It makes a new all-time high. But the momentum behind the new high is materially weaker than it was at the previous high. Volume at the new high is declining. Bars are smaller. Closes are pulling away from the highs. This is evidence of distribution, of the participants who drove the trend selling into the new high rather than buying it.
Divergence that is noise forms constantly in markets that are consolidating or in the middle of a strong trend. A brief momentum dip while price grinds higher in a strong participation phase produces divergence signals on hourly charts throughout. Those signals have no predictive value because the market is not in the conditions where divergence is meaningful. The trend is intact, the volume is confirming, and the brief momentum dip is simply a pause within the larger move.
The filter for whether divergence is meaningful is the same filter that applies to everything else: structural context. Does the divergence occur at a major structural level, after an extended trend move, with volume declining at the extreme? All three present together makes divergence a high-quality signal. One of three present makes it background information.
Momentum Confirmation at Entry
When you have a structural case for a trade (level, trend alignment, setup), momentum can serve as the confirmation that the entry is timely. Entering a long at support is more compelling when the bars approaching the level are decelerating on the downside, the closes are moving away from the lows, and the first bar to hold at the level shows an upside close with expanding size. Each of those observations is a momentum confirmation that buyers are present and engaged at that level.
Entering without momentum confirmation means entering against whatever force is currently in control of price. If price is falling into support with large, accelerating bars and closes at the lows, the momentum is bearish. The structural level may hold, but the momentum context is saying sellers have control. You are entering against that control without evidence it has transferred. Wait for the momentum to show you that sellers have lost control before committing capital.
This one change, requiring momentum confirmation before entry rather than treating structural levels as automatic entry triggers, materially reduces the number of losses from entering into levels that break rather than hold.
Acceleration vs Deceleration
The most actionable momentum reads are changes in rate: acceleration and deceleration. A market that is accelerating is showing increasing participation force. Bars are getting bigger. Closes are increasingly strong in the direction of the move. Volume is rising. This is not the time to fade the move. Acceleration states are what trend-following approaches are built to capture.
A market that is decelerating is showing the opposite. Bars are getting smaller. Closes are less decisive. Volume is declining. This is not yet a reversal. It is a warning that the force behind the current move is diminishing. In a trend, deceleration is often a precursor to a pullback phase. At a major structural level, deceleration of the move into the level is confirmation that the level is being respected by participants.
The mistake is treating deceleration as a reversal signal. Deceleration means the pace of the current move is slowing. It does not mean the direction is reversing. A second confirmation, typically a structural level being reached and a price action signal at that level, is required before treating deceleration as an entry signal against the prior direction.
| Momentum State | What You See on the Chart | Trading Implication |
|---|---|---|
| Accelerating bullish | Bars growing, closes at highs, volume rising | Do not fade. Hold or add to longs on dips. |
| Decelerating bullish | Bars shrinking, closes less decisive, volume fading | Tighten stops on longs. Pullback likely. |
| Momentum shift at level | Deceleration into level, then first strong opposite close | Highest-quality entry signal. All three signals present. |
| Divergence in trend context | New price high, smaller bars, lower volume | Watch for distribution. Reduce size. Do not add. |
| Divergence in range context | Minor new high in consolidation, small bars | Ignore. Noise. No structural case for trade. |
| Accelerating bearish | Large bars, closes at lows, volume surging | Do not buy. Protect any open longs immediately. |
| Neutral / indeterminate | Mixed closes, average volume, no clear bias | No momentum confirmation available. Wait. |
Action Items
- On your next ten trade setups, describe the momentum state in plain terms before entering: “Momentum is decelerating into this level, closes are pulling away from the lows.” If you cannot describe it, the signal is not clear enough to trade.
- Identify the last five trades where you entered into a level that broke through rather than held. Review the momentum state at the point of entry. Were bars accelerating into the level? If so, the momentum was telling you the level would fail before you entered.
- Remove oscillator buy/sell signals from your decision-making process for two weeks. Use the oscillator as a context reference only. Note whether this changes your entry quality.
- Look at the last major divergence signal your indicator produced. Was it at the end of an extended trend move at a significant structural level with declining volume? Or was it in the middle of a consolidation? Classify it as meaningful or noise based on context.
- For the next two weeks, only enter a trade against a prior move once you can identify three bars of deceleration in the move into the level. No exceptions. Track whether this reduces your number of losses from entering into breaks.
Continue Learning
- Predictive Edge 01: Confluence
- Predictive Edge 02: Price Action
- Predictive Edge 03: Support and Resistance
- Predictive Edge 04: Trend Analysis
- Predictive Edge 06: Multi-Timeframe Analysis